| Param | Original file | Final file |
|---|---|---|
| Filename | modeM0/AS1A07_100T02_9000003470_23464cztM0_level2.evt | modeM0/AS1A07_100T02_9000003470_23464cztM0_level2_quad_clean.evt |
| Size (bytes) | 569,289,600 | 101,756,160 |
| Size | 542.9 MB | 97.0 MB |
| Events in quadrant A | 3,360,664 | 693,158 |
| Events in quadrant B | 3,136,171 | 713,669 |
| Events in quadrant C | 3,195,992 | 683,145 |
| Events in quadrant D | 7,153,386 | 583,878 |
| Mode M0 | |||
|---|---|---|---|
| Quadrant | BADHDUFLAG | Total packets | Discarded packets |
| A | 0 | 13308 | 1 |
| B | 0 | 12641 | 1 |
| C | 0 | 12942 | 1 |
| D | 0 | 25219 | 1 |
| Mode M9 | |||
|---|---|---|---|
| Quadrant | BADHDUFLAG | Total packets | Discarded packets |
| A | 0 | 13 | 0 |
| B | 0 | 13 | 0 |
| C | 0 | 13 | 0 |
| D | 0 | 13 | 0 |
| Mode SS | |||
|---|---|---|---|
| Quadrant | BADHDUFLAG | Total packets | Discarded packets |
| A | 0 | 118 | 0 |
| B | 0 | 118 | 0 |
| C | 0 | 118 | 0 |
| D | 0 | 118 | 0 |
| Quadrant | Total seconds | Saturated seconds | Saturation percentage |
|---|---|---|---|
| A | 5829 | 203 | 3.482587% |
| B | 5830 | 47 | 0.806175% |
| C | 5830 | 101 | 1.732419% |
| D | 5830 | 1276 | 21.886792% |
Noise dominated data is calculated using 1-second bins in cleaned event files. If a bin has >2000 counts, and if more than 50% of those come from <1% of pixels, then it is considered to be noise-dominated and hence unusable.
| Quadrant | # 1 sec bins | Bins with >0 counts | Bins with >2000 counts | High rate bins dominated by noise | Noise dominated (total time) | Noise dominated (detector-on time) | Marked lightcurve |
|---|---|---|---|---|---|---|---|
| A | 7174 | 5830 | 113 | 113 | 1.58% | 1.94% | 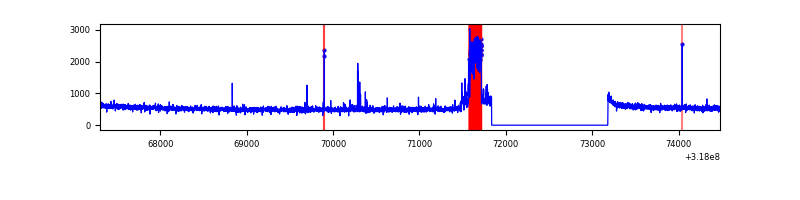 |
| B | 7175 | 5831 | 1 | 1 | 0.01% | 0.02% | 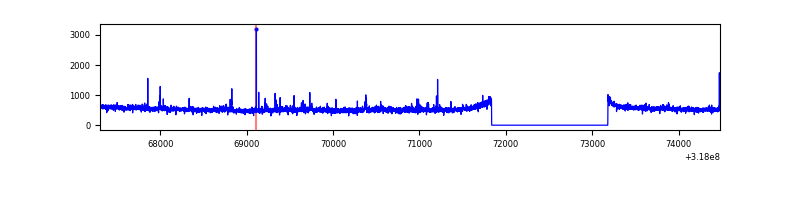 |
| C | 7175 | 5831 | 1 | 1 | 0.01% | 0.02% | 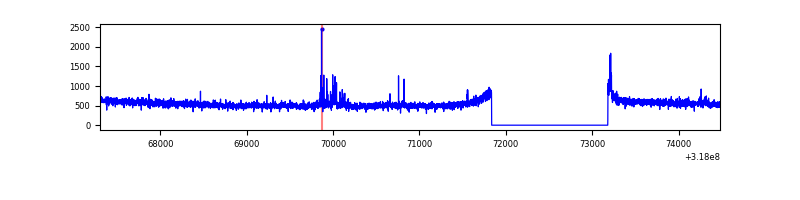 |
| D | 7175 | 5830 | 1203 | 1203 | 16.77% | 20.63% | 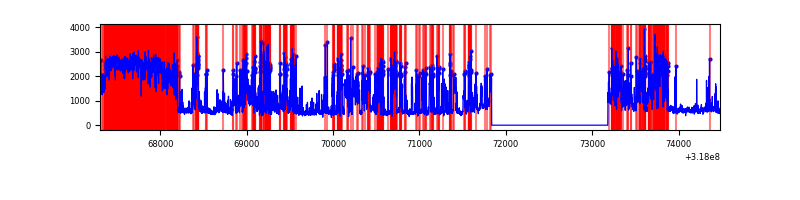 |
Top three noisy pixels from each quadrant. If the there are fewer than three noisy pixels in the level2.evt file, extra rows are filled as -1
| Pixel properties | Quadrant properties | ||||||
|---|---|---|---|---|---|---|---|
| Quadrant | DetID | PixID | Counts | Sigma | Mean | Median | Sigma |
| A | 15 | 174 | 308912 | 1986.42 | 784 | 770 | 155.1 |
| A | 6 | 16 | 27627 | 173.13 | 784 | 770 | 155.1 |
| A | 13 | 254 | 9760 | 57.95 | 784 | 770 | 155.1 |
| B | 12 | 111 | 15814 | 104.25 | 784 | 766 | 144.3 |
| B | 0 | 228 | 14620 | 95.98 | 784 | 766 | 144.3 |
| B | 0 | 229 | 14576 | 95.68 | 784 | 766 | 144.3 |
| C | 14 | 238 | 121673 | 684.48 | 766 | 774 | 176.6 |
| C | 3 | 233 | 54510 | 304.23 | 766 | 774 | 176.6 |
| C | 0 | 10 | 13558 | 72.38 | 766 | 774 | 176.6 |
| D | 7 | 238 | 2251074 | 13069.74 | 721 | 702 | 172.2 |
| D | 1 | 52 | 1981789 | 11505.78 | 721 | 702 | 172.2 |
| D | 13 | 104 | 69109 | 397.3 | 721 | 702 | 172.2 |
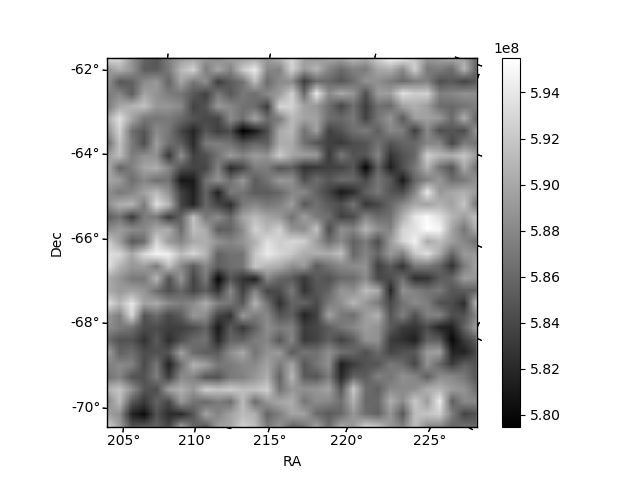
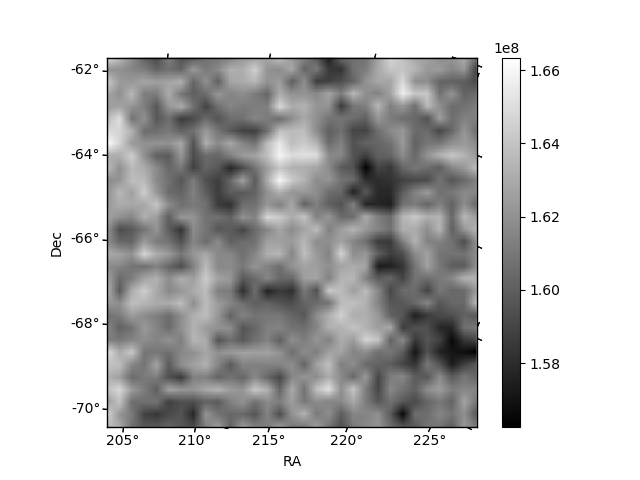
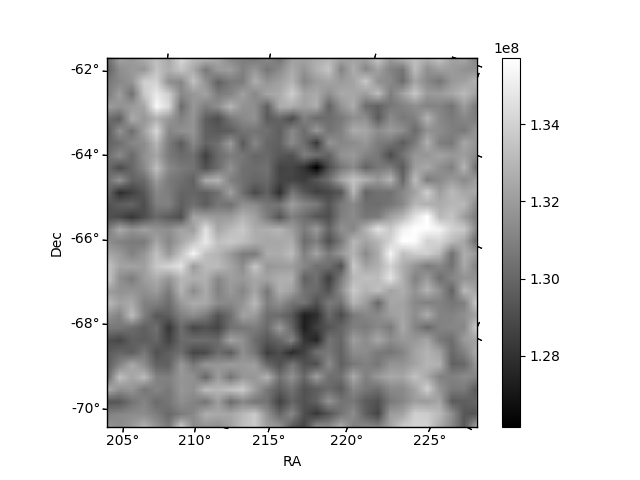
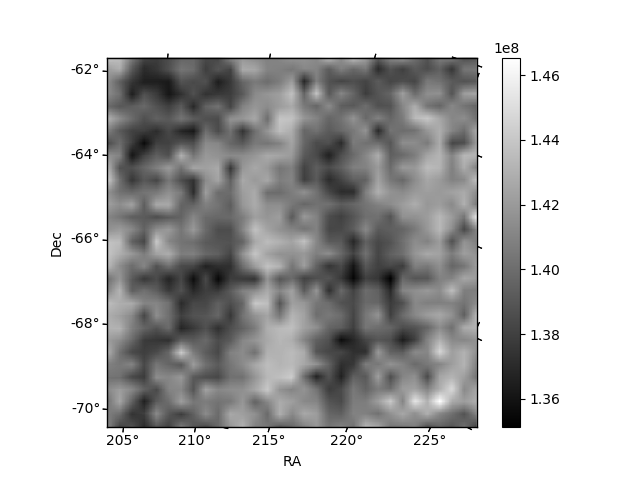
Histogram calculated using DETX and DETY for each event in the final _common_clean file
| Quadrant A | 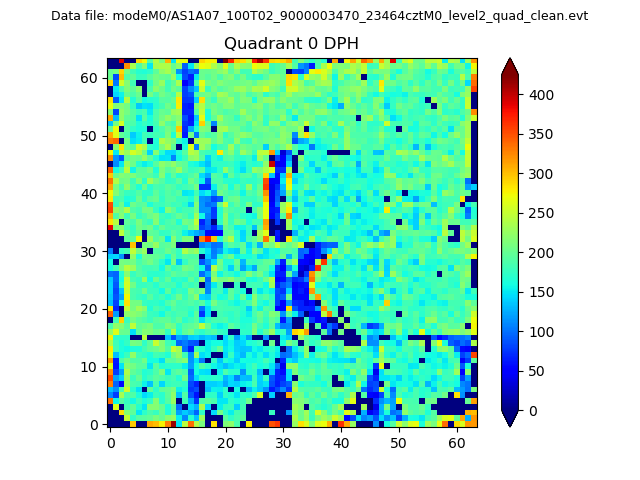 |
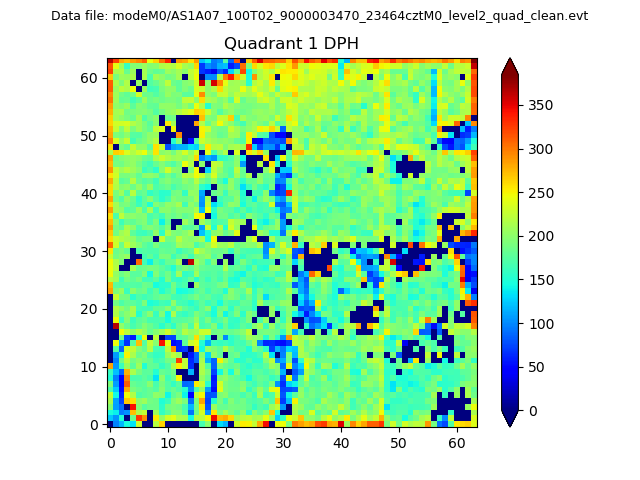 |
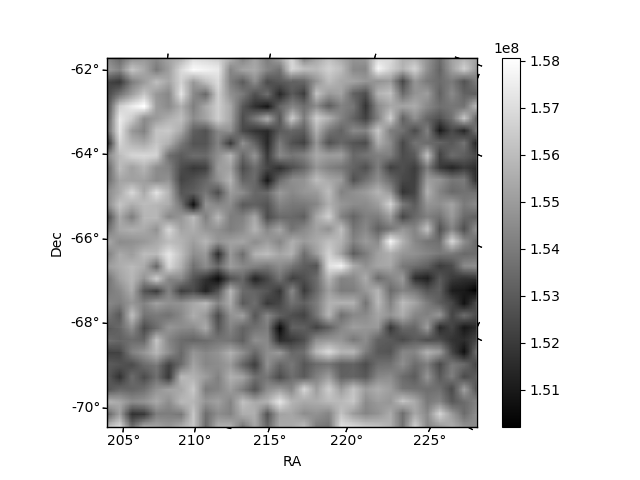
Quadrant B |
|---|---|---|---|
| Quadrant D | 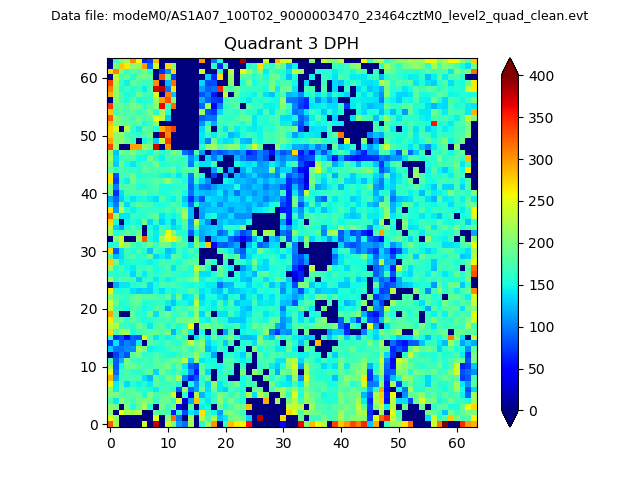 |
 |
Quadrant C |
| Plot type | Count rate plots | Images |
|---|---|---|
| Comparison with Poisson distribution Blue bars denote a histogram of data divided into 1 sec bins. Red curve is a Poisson curve with rate = median count rate of data. |
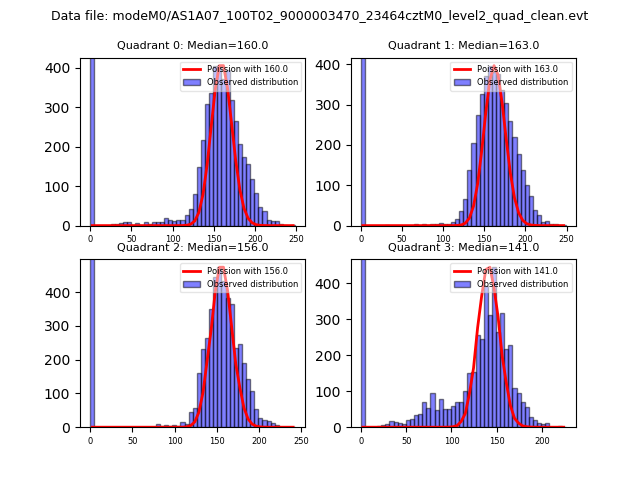 |
 |
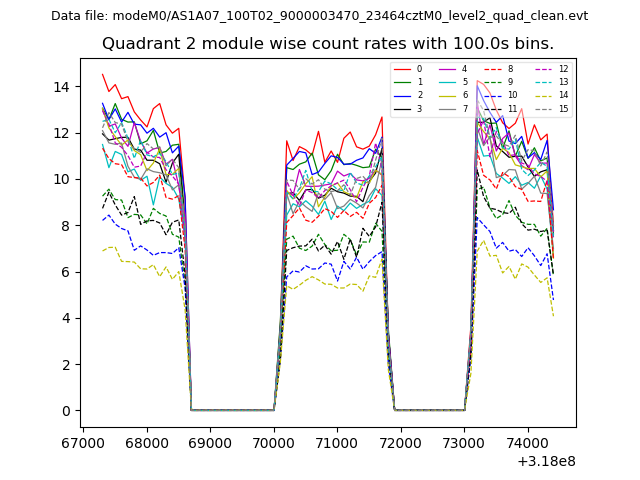
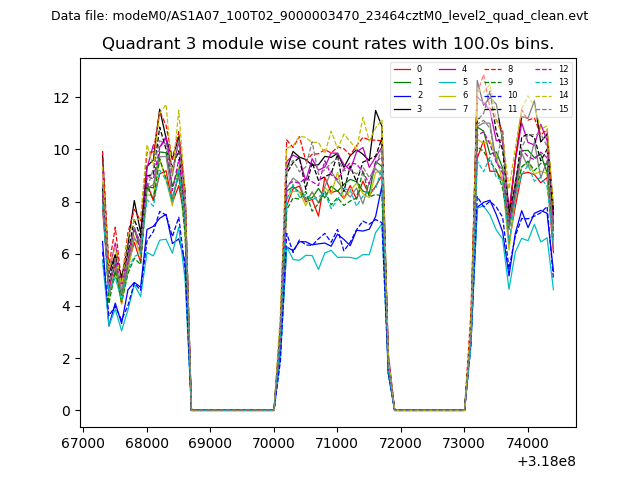
| Quadrant-wise count rates Data is divided into 100 sec bins |
 |
|
| Module-wise count rates for Quadrant A Data is divided into 100 sec bins |
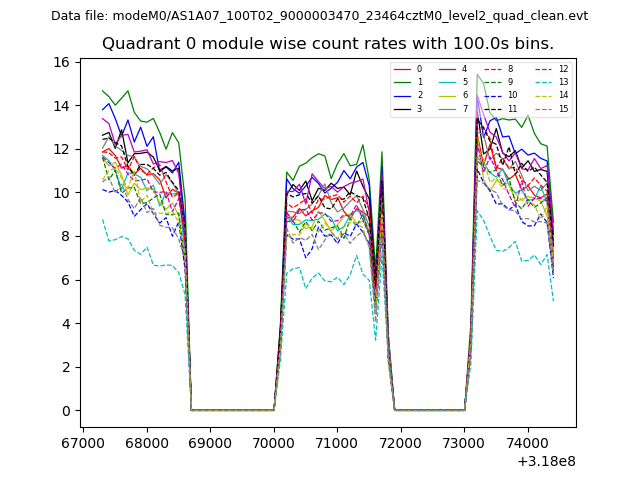 |
 |
| Module-wise count rates for Quadrant B Data is divided into 100 sec bins |
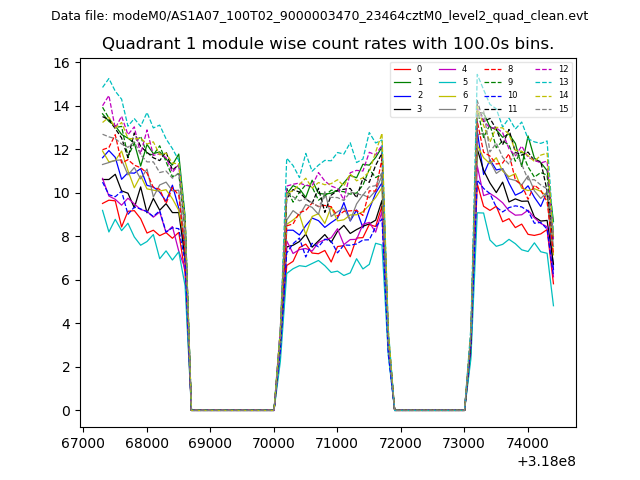 |
 |
| Module-wise count rates for Quadrant C Data is divided into 100 sec bins |
 |
 |
| Module-wise count rates for Quadrant D Data is divided into 100 sec bins |
 |
 |
| Parameter | Plot |
|---|---|
| CZT HV Monitor | 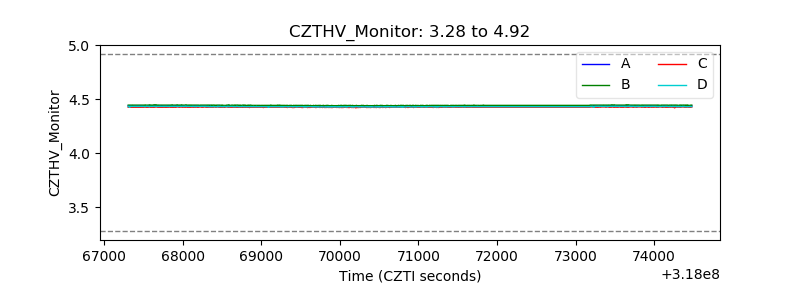 |
| D_VDD | 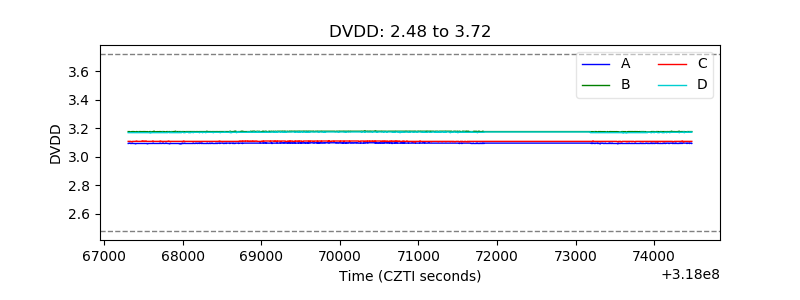 |
| Temperature 1 | 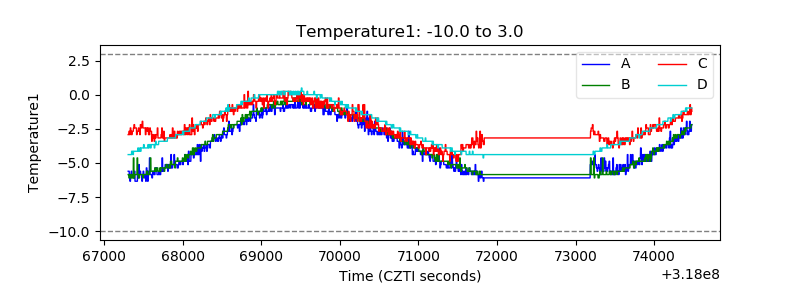 |
| Veto HV Monitor | 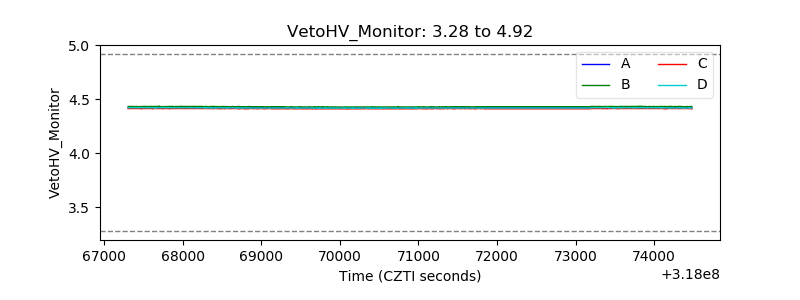 |
| Veto LLD | 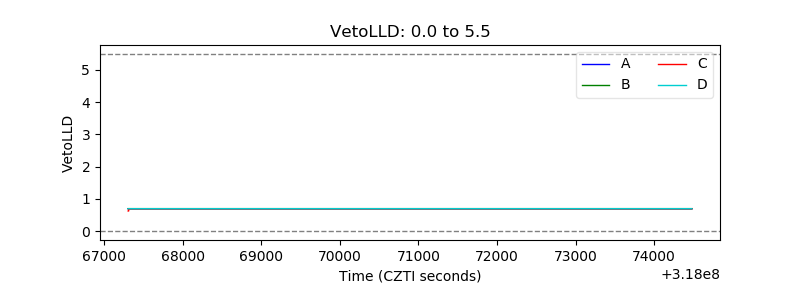 |
| Alpha Counter | 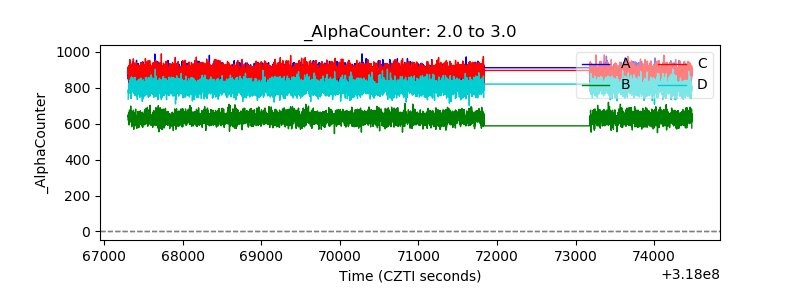 |
| _CPM_Rate | 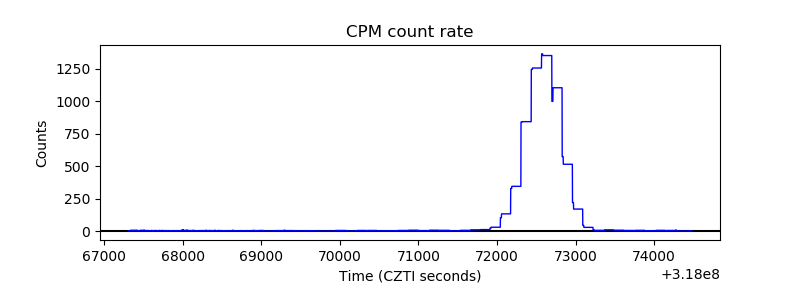 |
| CZT Counter |  |
| +2.5 Volts monitor |  |
| +5 Volts monitor |  |
| _ROLL_ROT | 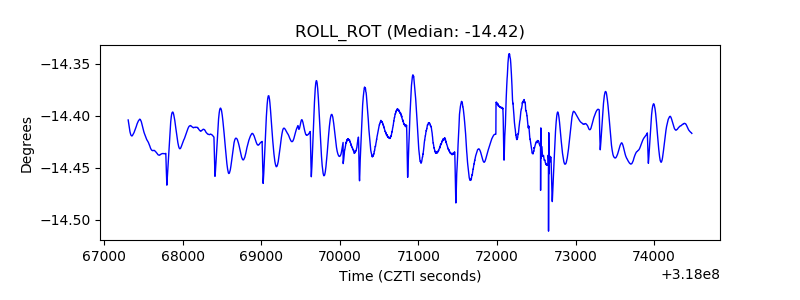 |
| _Roll_DEC | 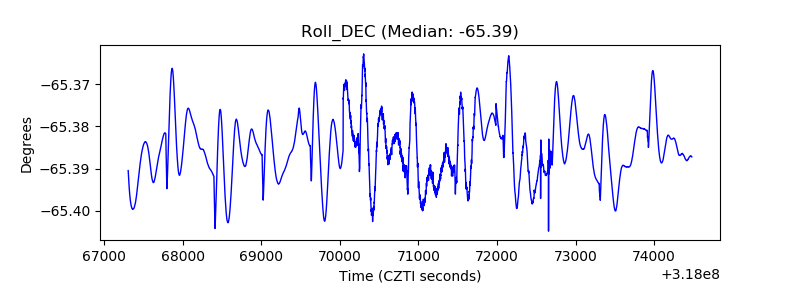 |
| _Roll_RA |  |
| Veto Counter | 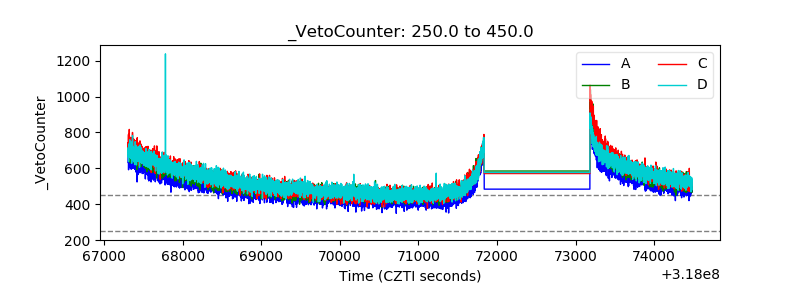 |