| Param | Original file | Final file |
|---|---|---|
| Filename | modeM0/AS1A07_100T02_9000003470_23625cztM0_level2.evt | modeM0/AS1A07_100T02_9000003470_23625cztM0_level2_quad_clean.evt |
| Size (bytes) | 530,688,960 | 113,037,120 |
| Size | 506.1 MB | 107.8 MB |
| Events in quadrant A | 3,059,784 | 752,685 |
| Events in quadrant B | 3,553,683 | 776,484 |
| Events in quadrant C | 3,206,724 | 749,559 |
| Events in quadrant D | 5,822,466 | 703,313 |
| Mode M0 | |||
|---|---|---|---|
| Quadrant | BADHDUFLAG | Total packets | Discarded packets |
| A | 0 | 13602 | 635 |
| B | 0 | 14911 | 660 |
| C | 0 | 13929 | 720 |
| D | 0 | 22049 | 651 |
| Mode M9 | |||
|---|---|---|---|
| Quadrant | BADHDUFLAG | Total packets | Discarded packets |
| A | 0 | 9 | 0 |
| B | 0 | 10 | 0 |
| C | 0 | 10 | 0 |
| D | 0 | 10 | 1 |
| Mode SS | |||
|---|---|---|---|
| Quadrant | BADHDUFLAG | Total packets | Discarded packets |
| A | 0 | 134 | 6 |
| B | 0 | 134 | 6 |
| C | 0 | 134 | 4 |
| D | 0 | 134 | 4 |
| Quadrant | Total seconds | Saturated seconds | Saturation percentage |
|---|---|---|---|
| A | 6320 | 84 | 1.329114% |
| B | 6324 | 197 | 3.115117% |
| C | 6319 | 155 | 2.452920% |
| D | 6328 | 829 | 13.100506% |
Noise dominated data is calculated using 1-second bins in cleaned event files. If a bin has >2000 counts, and if more than 50% of those come from <1% of pixels, then it is considered to be noise-dominated and hence unusable.
| Quadrant | # 1 sec bins | Bins with >0 counts | Bins with >2000 counts | High rate bins dominated by noise | Noise dominated (total time) | Noise dominated (detector-on time) | Marked lightcurve |
|---|---|---|---|---|---|---|---|
| A | 7502 | 6358 | 0 | 0 | 0.00% | 0.00% |  |
| B | 7516 | 6357 | 70 | 70 | 0.93% | 1.10% | 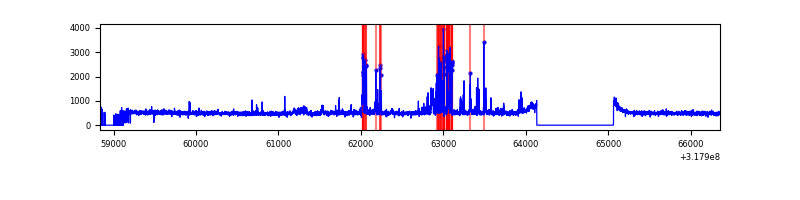 |
| C | 7516 | 6347 | 0 | 0 | 0.00% | 0.00% | 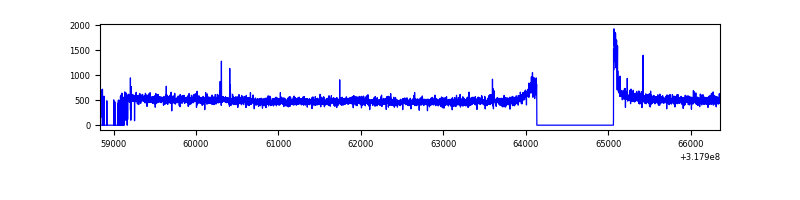 |
| D | 7514 | 6365 | 721 | 721 | 9.60% | 11.33% | 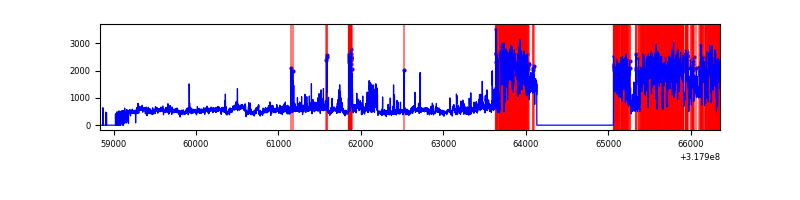 |
Top three noisy pixels from each quadrant. If the there are fewer than three noisy pixels in the level2.evt file, extra rows are filled as -1
| Pixel properties | Quadrant properties | ||||||
|---|---|---|---|---|---|---|---|
| Quadrant | DetID | PixID | Counts | Sigma | Mean | Median | Sigma |
| A | 13 | 254 | 8541 | 48.81 | 794 | 780 | 159.0 |
| A | 3 | 137 | 7154 | 40.09 | 794 | 780 | 159.0 |
| A | 0 | 226 | 6633 | 36.81 | 794 | 780 | 159.0 |
| B | 3 | 64 | 364901 | 2406.71 | 791 | 770 | 151.3 |
| B | 0 | 189 | 51222 | 333.46 | 791 | 770 | 151.3 |
| B | 0 | 229 | 36728 | 237.66 | 791 | 770 | 151.3 |
| C | 14 | 238 | 121613 | 667.69 | 774 | 778 | 181.0 |
| C | 0 | 10 | 42130 | 228.5 | 774 | 778 | 181.0 |
| C | 7 | 247 | 27733 | 148.94 | 774 | 778 | 181.0 |
| D | 1 | 52 | 2849501 | 15557.19 | 757 | 734 | 183.1 |
| D | 12 | 233 | 85350 | 462.09 | 757 | 734 | 183.1 |
| D | 8 | 195 | 39194 | 210.03 | 757 | 734 | 183.1 |
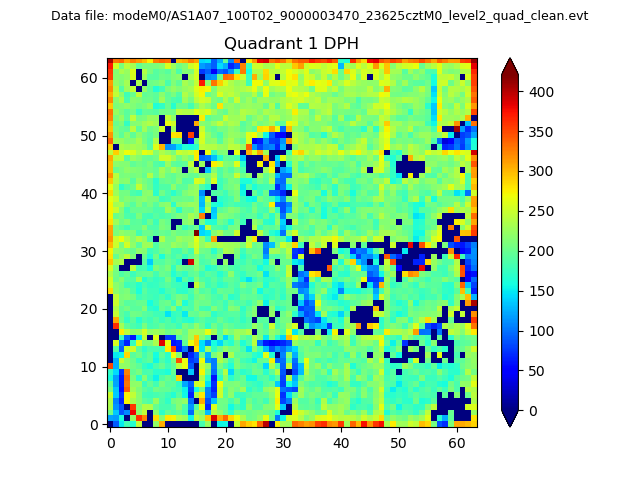
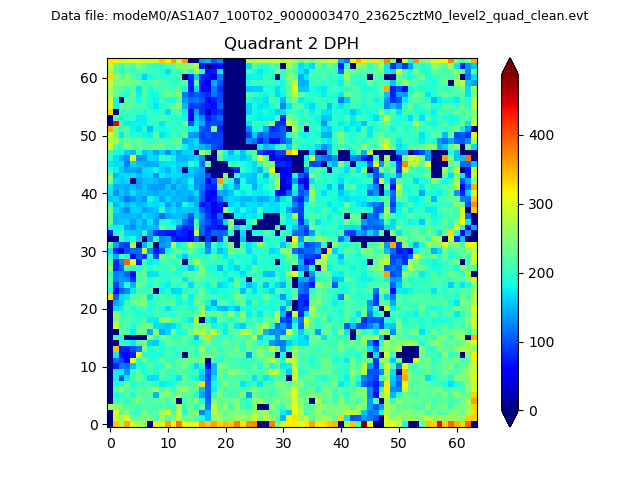
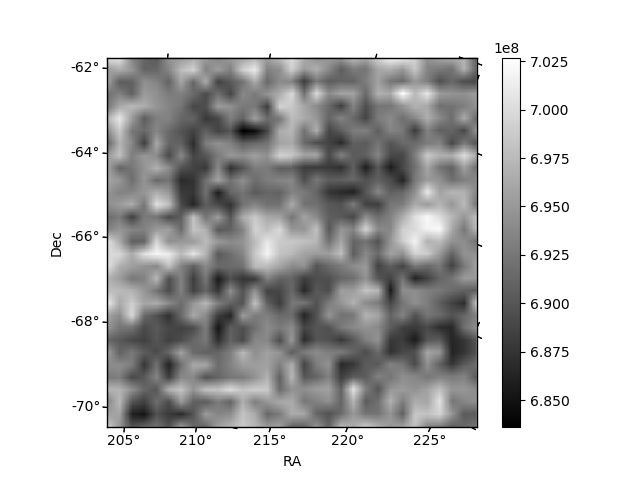
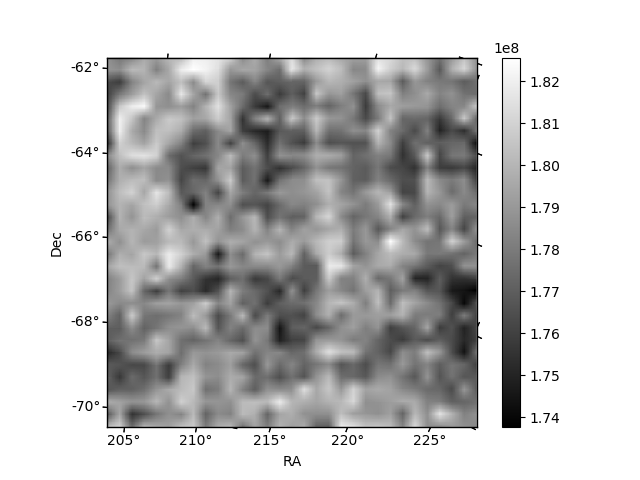
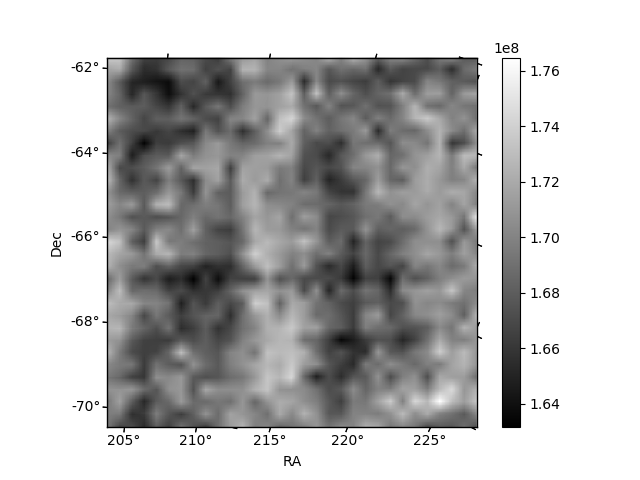
Histogram calculated using DETX and DETY for each event in the final _common_clean file
| Quadrant A | 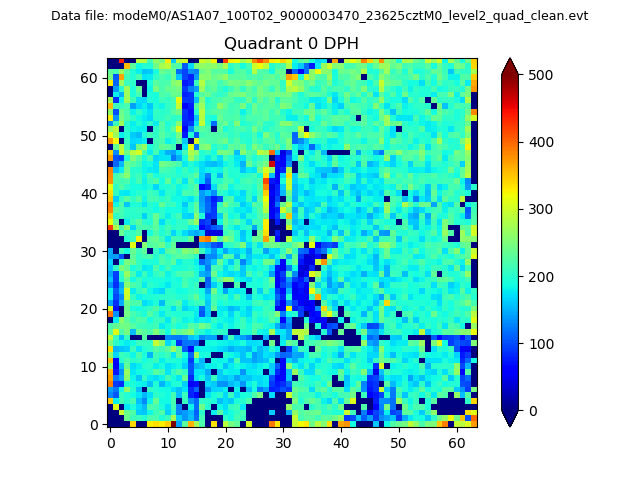 |
 |
Quadrant B |
|---|---|---|---|
| Quadrant D | 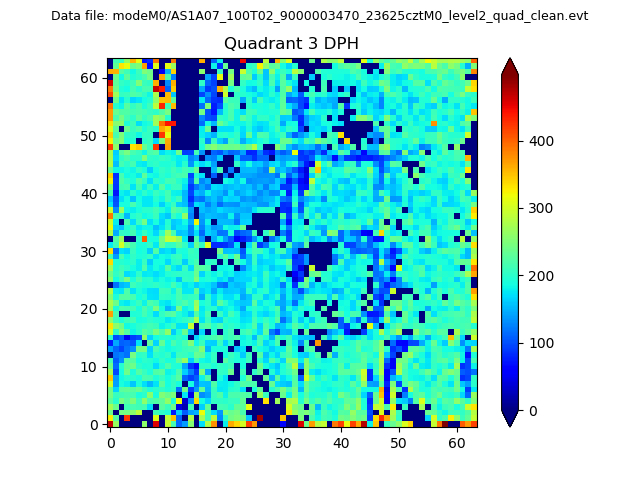 |
 |
Quadrant C |
| Plot type | Count rate plots | Images |
|---|---|---|
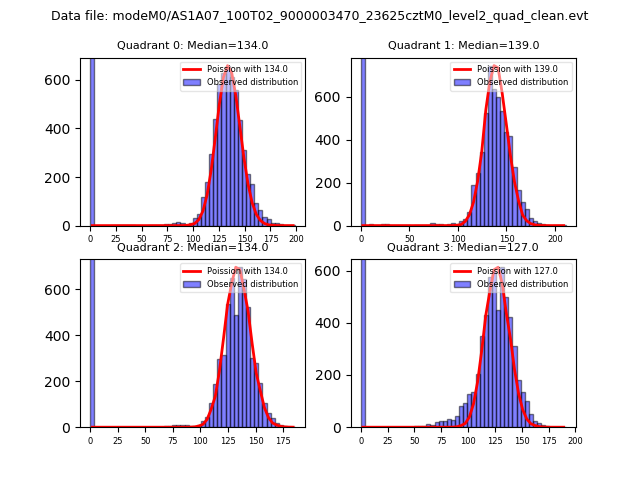
| Comparison with Poisson distribution Blue bars denote a histogram of data divided into 1 sec bins. Red curve is a Poisson curve with rate = median count rate of data. |
 |
 |
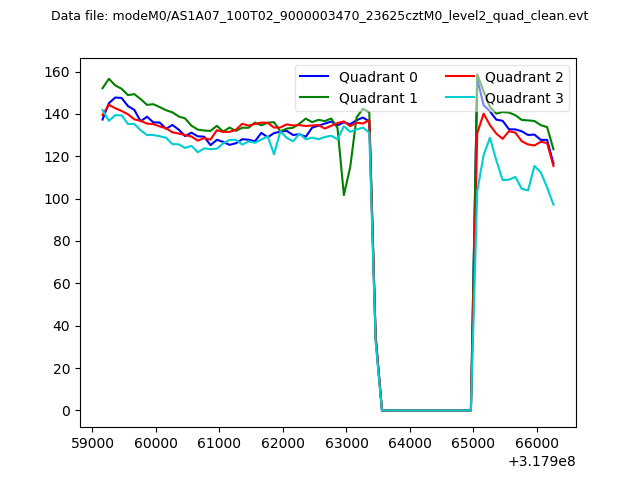
| Quadrant-wise count rates Data is divided into 100 sec bins |
 |
|
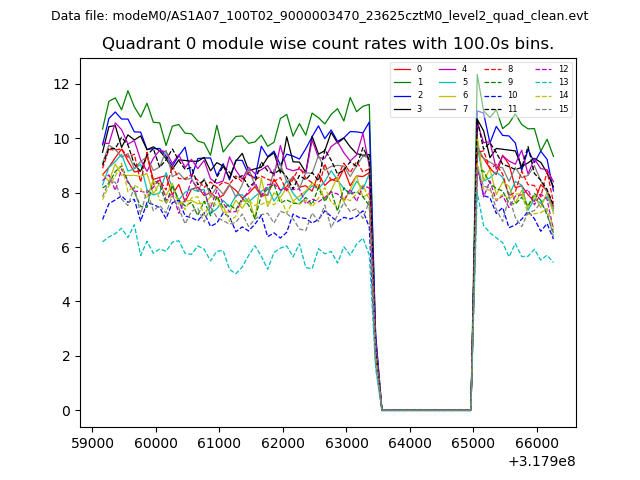
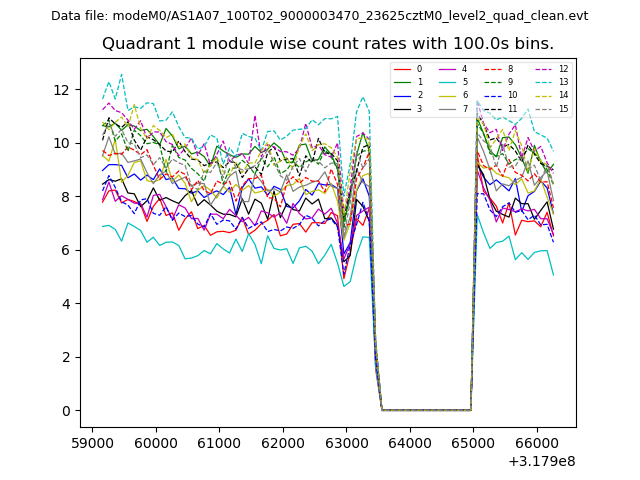
| Module-wise count rates for Quadrant A Data is divided into 100 sec bins |
 |
 |
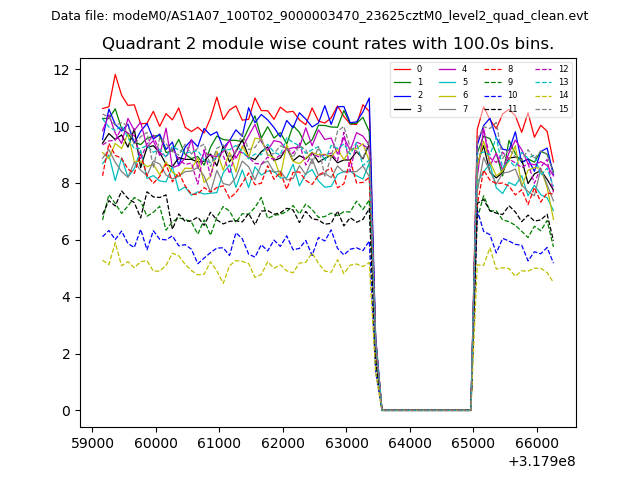
| Module-wise count rates for Quadrant B Data is divided into 100 sec bins |
 |
 |
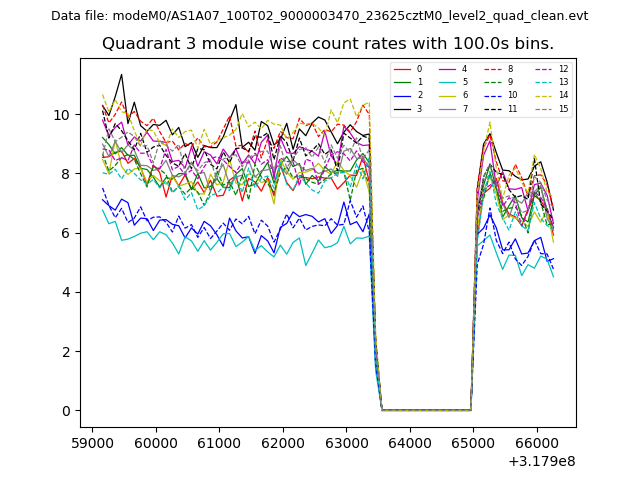
| Module-wise count rates for Quadrant C Data is divided into 100 sec bins |
 |
 |
| Module-wise count rates for Quadrant D Data is divided into 100 sec bins |
 |
 |
| Parameter | Plot |
|---|---|
| CZT HV Monitor | 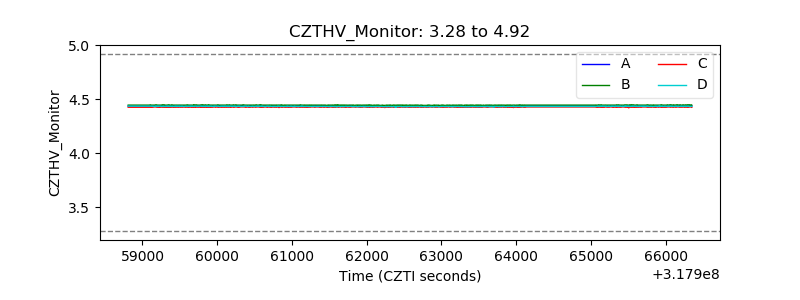 |
| D_VDD | 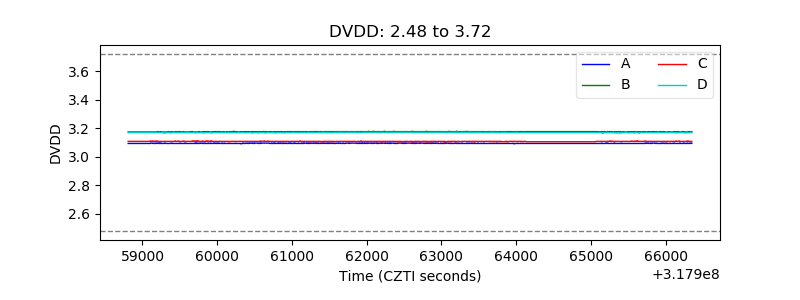 |
| Temperature 1 | 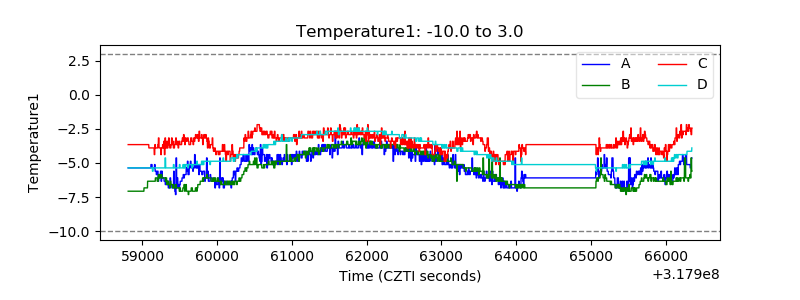 |
| Veto HV Monitor | 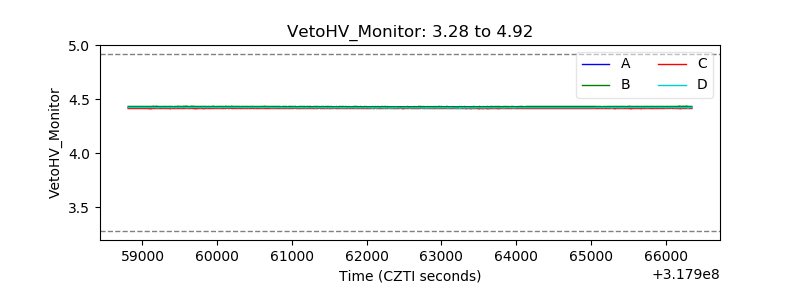 |
| Veto LLD | 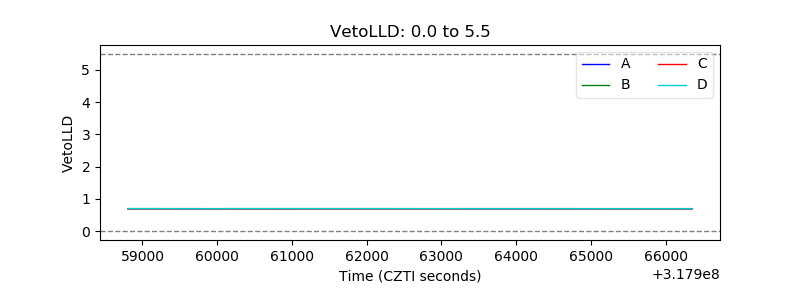 |
| Alpha Counter | 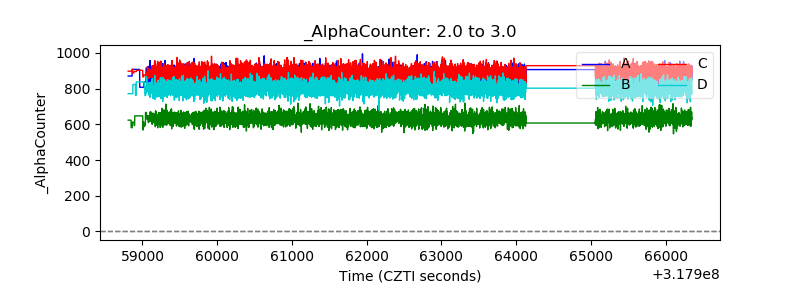 |
| _CPM_Rate | 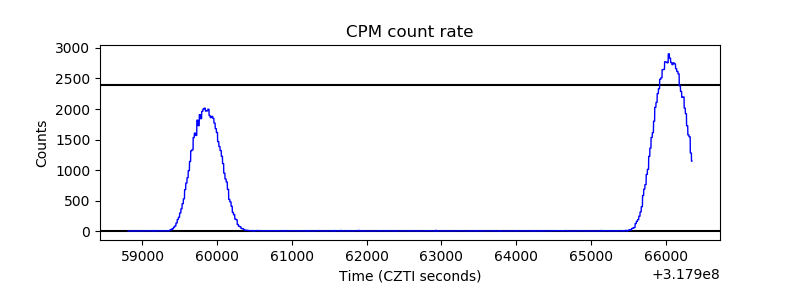 |
| CZT Counter | 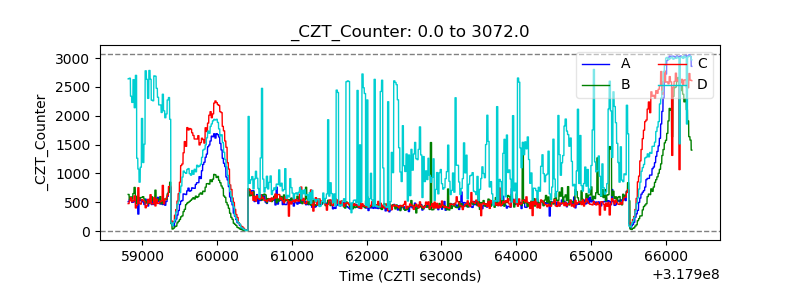 |
| +2.5 Volts monitor |  |
| +5 Volts monitor |  |
| _ROLL_ROT | 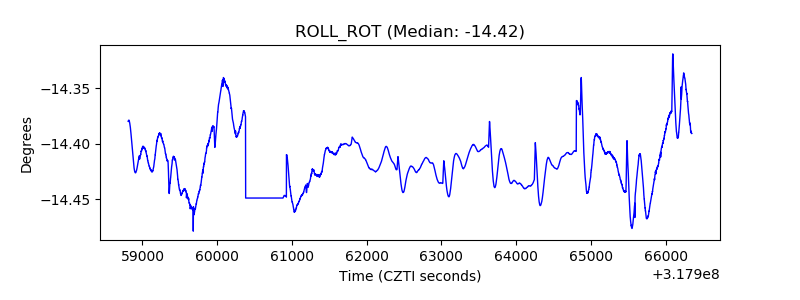 |
| _Roll_DEC | 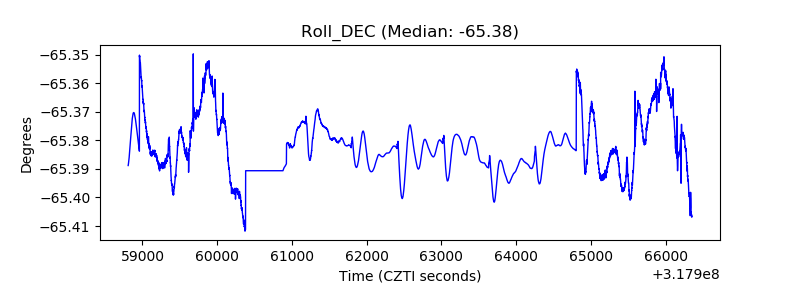 |
| _Roll_RA | 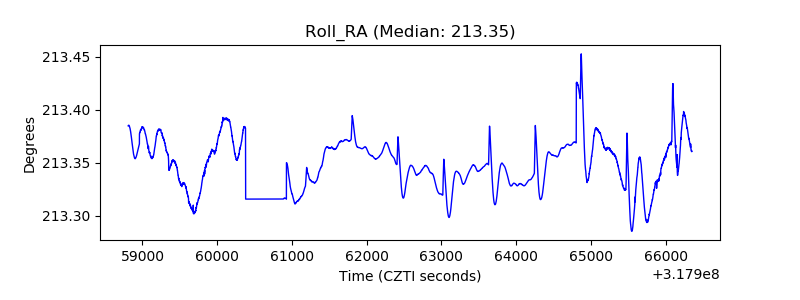 |
| Veto Counter | 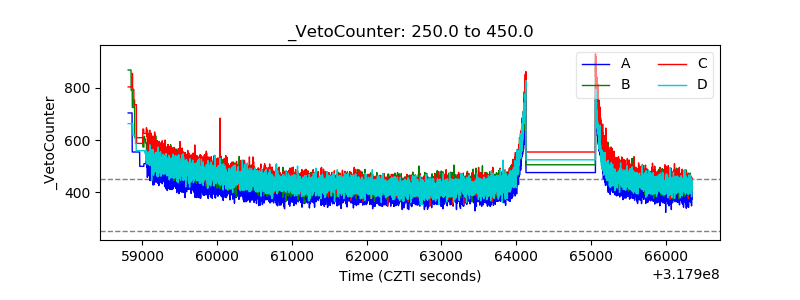 |