| Param | Original file | Final file |
|---|---|---|
| Filename | modeM0/AS1A07_127T01_9000003468cztM0_level2.fits | modeM0/AS1A07_127T01_9000003468cztM0_level2_quad_clean.evt |
| Size (bytes) | 401,569,920 | 336,741,120 |
| Size | 383.0 MB | 321.1 MB |
| Events in quadrant A | 2,545,942 | 2,030,629 |
| Events in quadrant B | 2,410,576 | 2,023,847 |
| Events in quadrant C | 2,364,960 | 1,707,322 |
| Events in quadrant D | 2,104,340 | 1,702,829 |
| Mode SS | |||
|---|---|---|---|
| Quadrant | BADHDUFLAG | Total packets | Discarded packets |
| A | 0 | 812 | 0 |
| B | 0 | 812 | 0 |
| C | 0 | 812 | 0 |
| D | 0 | 812 | 0 |
| Mode M9 | |||
|---|---|---|---|
| Quadrant | BADHDUFLAG | Total packets | Discarded packets |
| A | 0 | 59 | 0 |
| B | 0 | 59 | 0 |
| C | 0 | 59 | 0 |
| D | 0 | 59 | 0 |
| Mode M0 | |||
|---|---|---|---|
| Quadrant | BADHDUFLAG | Total packets | Discarded packets |
| A | 0 | 83661 | 0 |
| B | 0 | 86336 | 0 |
| C | 0 | 125419 | 0 |
| D | 0 | 117243 | 0 |
| Quadrant | Total seconds | Saturated seconds | Saturation percentage |
|---|---|---|---|
| A | 39783 | 512 | 1.286982% |
| B | 39783 | 714 | 1.794736% |
| C | 39783 | 5441 | 13.676696% |
| D | 39783 | 3537 | 8.890732% |
Noise dominated data is calculated using 1-second bins in cleaned event files. If a bin has >2000 counts, and if more than 50% of those come from <1% of pixels, then it is considered to be noise-dominated and hence unusable.
| Quadrant | # 1 sec bins | Bins with >0 counts | Bins with >2000 counts | High rate bins dominated by noise | Noise dominated (total time) | Noise dominated (detector-on time) | Marked lightcurve |
|---|---|---|---|---|---|---|---|
| A | 44677 | 39778 | 0 | 0 | 0.00% | 0.00% |  |
| B | 44677 | 39776 | 0 | 0 | 0.00% | 0.00% |  |
| C | 44677 | 39778 | 0 | 0 | 0.00% | 0.00% |  |
| D | 44677 | 39772 | 0 | 0 | 0.00% | 0.00% |  |
Top three noisy pixels from each quadrant. If the there are fewer than three noisy pixels in the level2.evt file, extra rows are filled as -1
| Pixel properties | Quadrant properties | ||||||
|---|---|---|---|---|---|---|---|
| Quadrant | DetID | PixID | Counts | Sigma | Mean | Median | Sigma |
| A | 0 | 29 | 2364 | 10.74 | 662 | 621 | 162.3 |
| A | 7 | 110 | 2063 | 8.88 | 662 | 621 | 162.3 |
| A | 9 | 19 | 1926 | 8.04 | 662 | 621 | 162.3 |
| B | 2 | 9 | 2006 | 11.01 | 636 | 606 | 127.1 |
| B | 2 | 8 | 1658 | 8.27 | 636 | 606 | 127.1 |
| B | 5 | 128 | 1606 | 7.87 | 636 | 606 | 127.1 |
| C | 1 | 80 | 1846 | 7.97 | 624 | 586 | 158.1 |
| C | 1 | 81 | 1778 | 7.54 | 624 | 586 | 158.1 |
| C | 12 | 250 | 1596 | 6.39 | 624 | 586 | 158.1 |
| D | 3 | 14 | 1519 | 6.08 | 601 | 549 | 159.5 |
| D | 6 | 231 | 1491 | 5.91 | 601 | 549 | 159.5 |
| D | 6 | 67 | 1457 | 5.69 | 601 | 549 | 159.5 |
Histogram calculated using DETX and DETY for each event in the final _common_clean file
| Quadrant A | 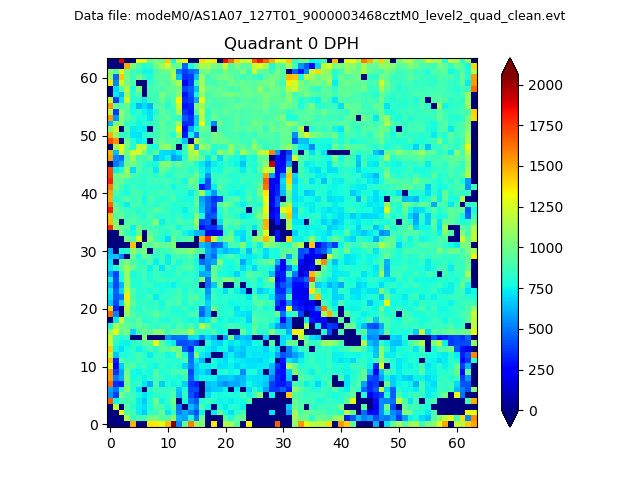 |
 |
Quadrant B |
|---|---|---|---|
| Quadrant D |  |
 |
Quadrant C |
| Plot type | Count rate plots | Images |
|---|---|---|
| Comparison with Poisson distribution Blue bars denote a histogram of data divided into 1 sec bins. Red curve is a Poisson curve with rate = median count rate of data. |
 |
 |
| Quadrant-wise count rates Data is divided into 100 sec bins |
 |
|
| Module-wise count rates for Quadrant A Data is divided into 100 sec bins |
 |
 |
| Module-wise count rates for Quadrant B Data is divided into 100 sec bins |
 |
 |
| Module-wise count rates for Quadrant C Data is divided into 100 sec bins |
 |
 |
| Module-wise count rates for Quadrant D Data is divided into 100 sec bins |
 |
 |
| Parameter | Plot |
|---|---|
| CZT HV Monitor |  |
| D_VDD |  |
| Temperature 1 |  |
| Veto HV Monitor |  |
| Veto LLD |  |
| Alpha Counter |  |
| _CPM_Rate |  |
| CZT Counter |  |
| +2.5 Volts monitor |  |
| +5 Volts monitor |  |
| _ROLL_ROT |  |
| _Roll_DEC |  |
| _Roll_RA |  |
| Veto Counter |  |