| Param | Original file | Final file |
|---|---|---|
| Filename | modeM0/AS1A07_127T01_9000003468_23435cztM0_level2.evt | modeM0/AS1A07_127T01_9000003468_23435cztM0_level2_quad_clean.evt |
| Size (bytes) | 488,793,600 | 84,257,280 |
| Size | 466.1 MB | 80.4 MB |
| Events in quadrant A | 3,462,994 | 538,698 |
| Events in quadrant B | 3,641,082 | 543,537 |
| Events in quadrant C | 3,546,710 | 520,247 |
| Events in quadrant D | 3,730,155 | 514,784 |
| Mode SS | |||
|---|---|---|---|
| Quadrant | BADHDUFLAG | Total packets | Discarded packets |
| A | 0 | 126 | 0 |
| B | 0 | 126 | 0 |
| C | 0 | 126 | 0 |
| D | 0 | 126 | 0 |
| Mode M9 | |||
|---|---|---|---|
| Quadrant | BADHDUFLAG | Total packets | Discarded packets |
| A | 0 | 13 | 0 |
| B | 0 | 14 | 0 |
| C | 0 | 14 | 0 |
| D | 0 | 14 | 0 |
| Mode M0 | |||
|---|---|---|---|
| Quadrant | BADHDUFLAG | Total packets | Discarded packets |
| A | 0 | 13923 | 2 |
| B | 0 | 14504 | 2 |
| C | 0 | 14213 | 2 |
| D | 0 | 14824 | 3 |
| Quadrant | Total seconds | Saturated seconds | Saturation percentage |
|---|---|---|---|
| A | 6223 | 127 | 2.040816% |
| B | 6223 | 139 | 2.233649% |
| C | 6223 | 153 | 2.458621% |
| D | 6222 | 127 | 2.041144% |
Noise dominated data is calculated using 1-second bins in cleaned event files. If a bin has >2000 counts, and if more than 50% of those come from <1% of pixels, then it is considered to be noise-dominated and hence unusable.
| Quadrant | # 1 sec bins | Bins with >0 counts | Bins with >2000 counts | High rate bins dominated by noise | Noise dominated (total time) | Noise dominated (detector-on time) | Marked lightcurve |
|---|---|---|---|---|---|---|---|
| A | 7528 | 6223 | 0 | 0 | 0.00% | 0.00% | 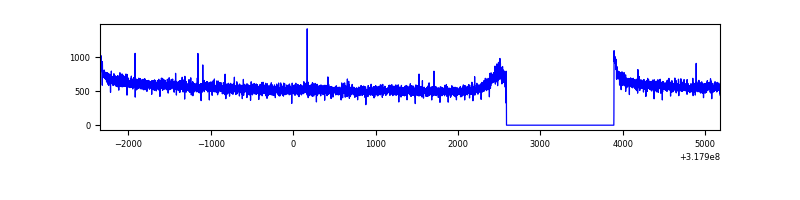 |
| B | 7528 | 6223 | 2 | 2 | 0.03% | 0.03% | 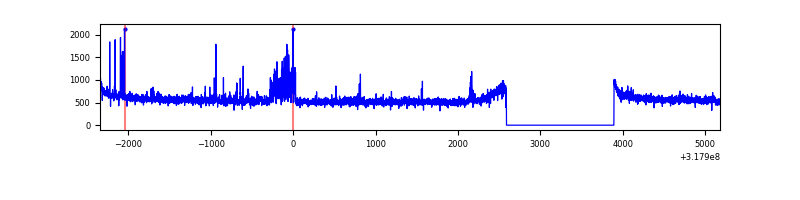 |
| C | 7528 | 6223 | 0 | 0 | 0.00% | 0.00% | 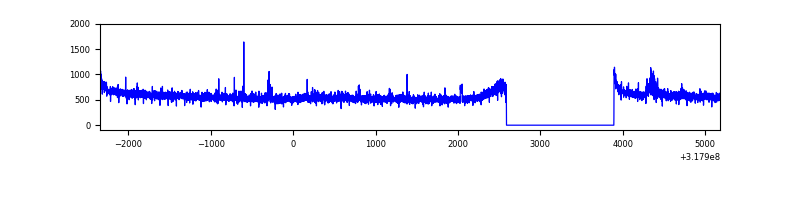 |
| D | 7527 | 6222 | 24 | 24 | 0.32% | 0.39% | 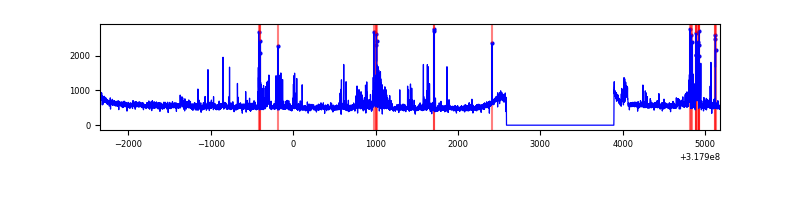 |
Top three noisy pixels from each quadrant. If the there are fewer than three noisy pixels in the level2.evt file, extra rows are filled as -1
| Pixel properties | Quadrant properties | ||||||
|---|---|---|---|---|---|---|---|
| Quadrant | DetID | PixID | Counts | Sigma | Mean | Median | Sigma |
| A | 13 | 254 | 9674 | 49.23 | 898 | 880 | 178.6 |
| A | 0 | 226 | 8013 | 39.93 | 898 | 880 | 178.6 |
| A | 3 | 137 | 7151 | 35.11 | 898 | 880 | 178.6 |
| B | 0 | 190 | 140411 | 862.76 | 875 | 858 | 161.8 |
| B | 0 | 189 | 40066 | 242.4 | 875 | 858 | 161.8 |
| B | 4 | 173 | 19905 | 117.75 | 875 | 858 | 161.8 |
| C | 14 | 238 | 137841 | 698.72 | 853 | 860 | 196.0 |
| C | 10 | 9 | 43580 | 217.91 | 853 | 860 | 196.0 |
| C | 0 | 207 | 20058 | 97.93 | 853 | 860 | 196.0 |
| D | 1 | 52 | 241460 | 1135.3 | 875 | 852 | 211.9 |
| D | 13 | 172 | 105012 | 491.48 | 875 | 852 | 211.9 |
| D | 12 | 233 | 41700 | 192.74 | 875 | 852 | 211.9 |
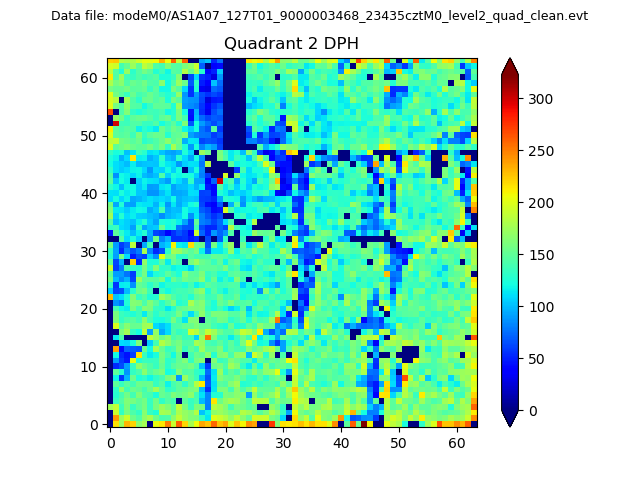
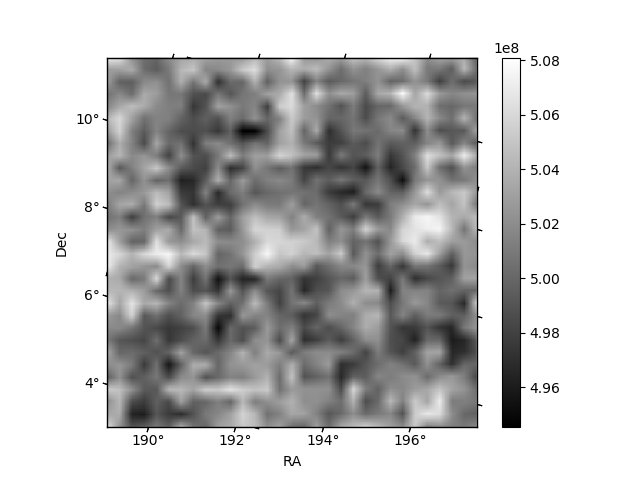
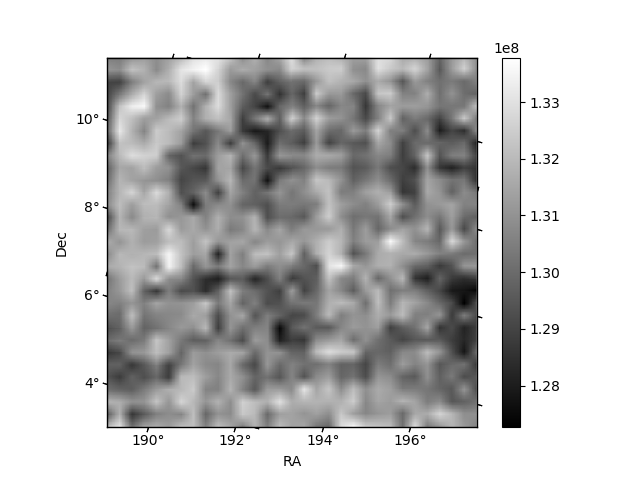
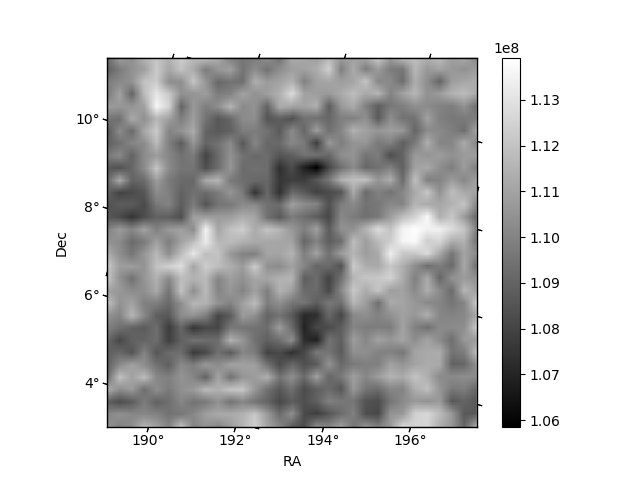
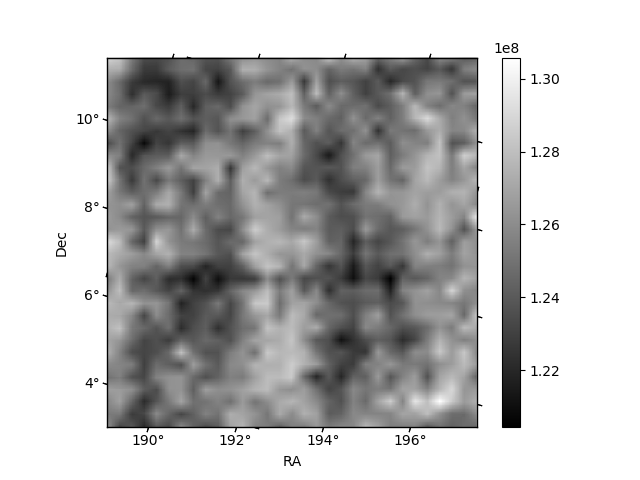
Histogram calculated using DETX and DETY for each event in the final _common_clean file
| Quadrant A | 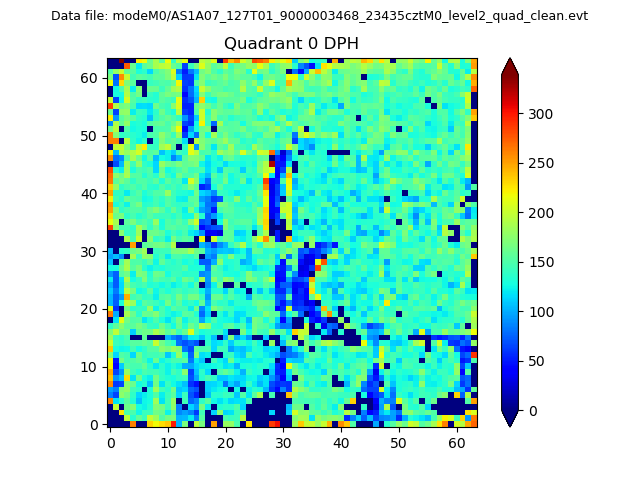 |
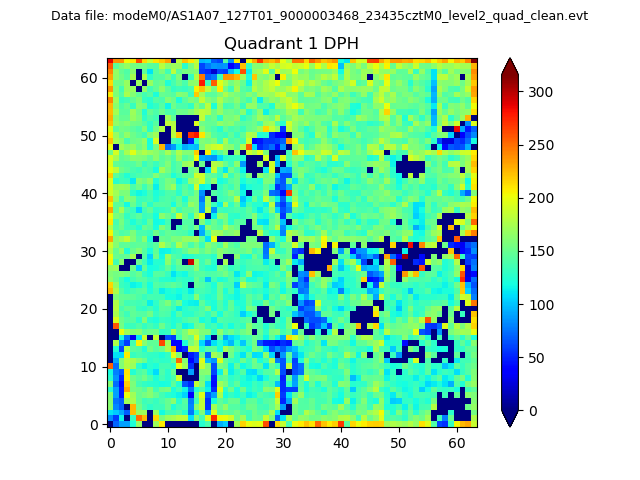 |
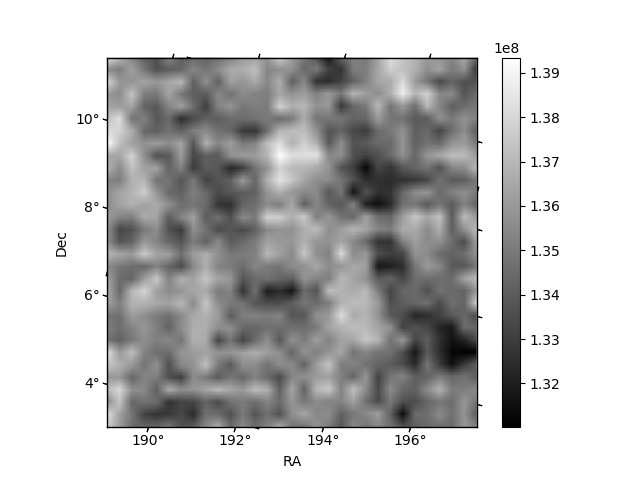
Quadrant B |
|---|---|---|---|
| Quadrant D | 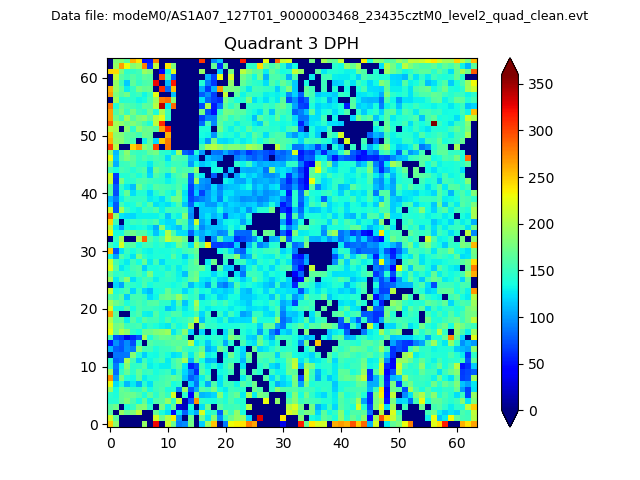 |
 |
Quadrant C |
| Plot type | Count rate plots | Images |
|---|---|---|
| Comparison with Poisson distribution Blue bars denote a histogram of data divided into 1 sec bins. Red curve is a Poisson curve with rate = median count rate of data. |
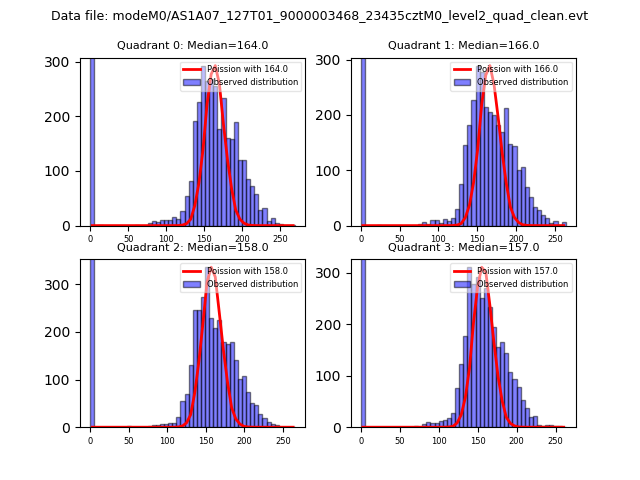 |
 |
| Quadrant-wise count rates Data is divided into 100 sec bins |
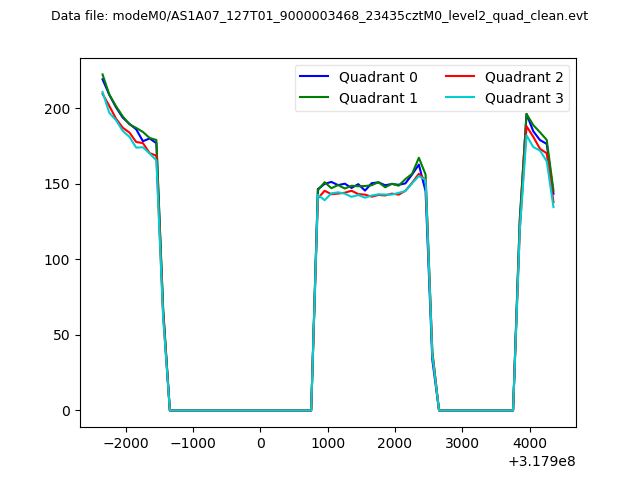 |
|
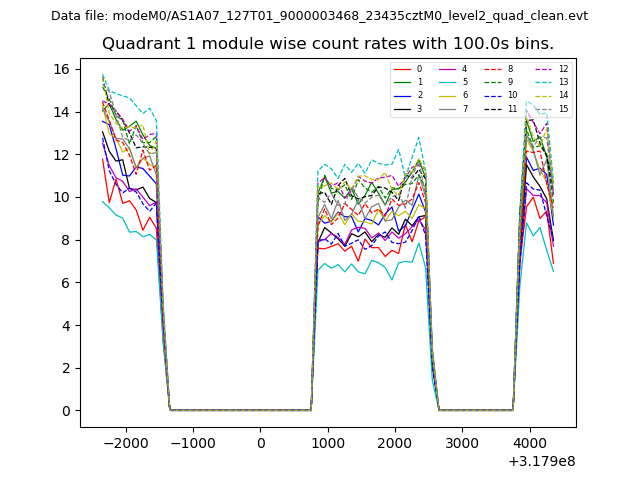
| Module-wise count rates for Quadrant A Data is divided into 100 sec bins |
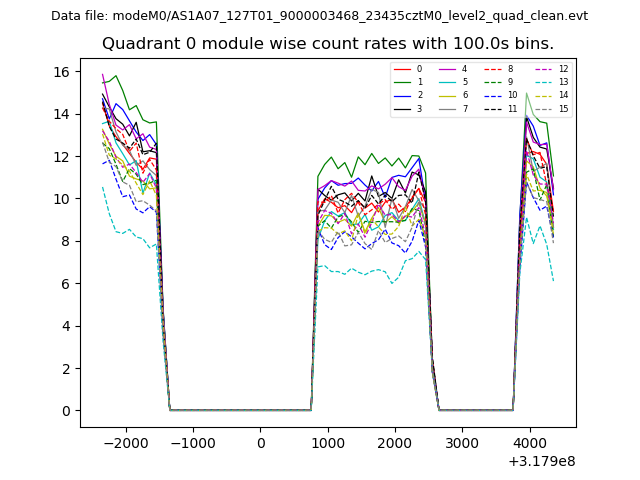 |
 |
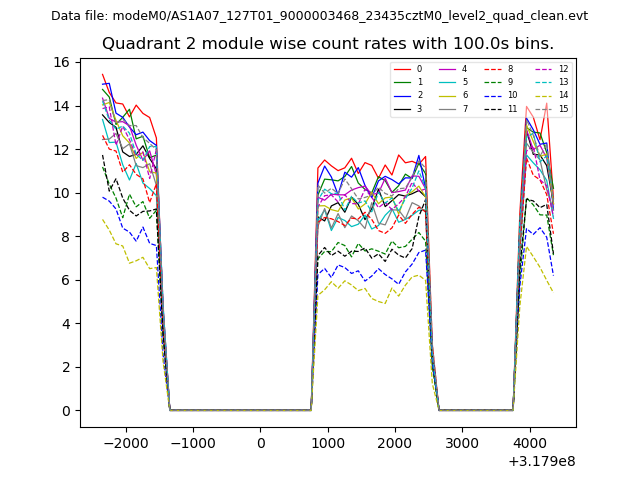
| Module-wise count rates for Quadrant B Data is divided into 100 sec bins |
 |
 |
| Module-wise count rates for Quadrant C Data is divided into 100 sec bins |
 |
 |
| Module-wise count rates for Quadrant D Data is divided into 100 sec bins |
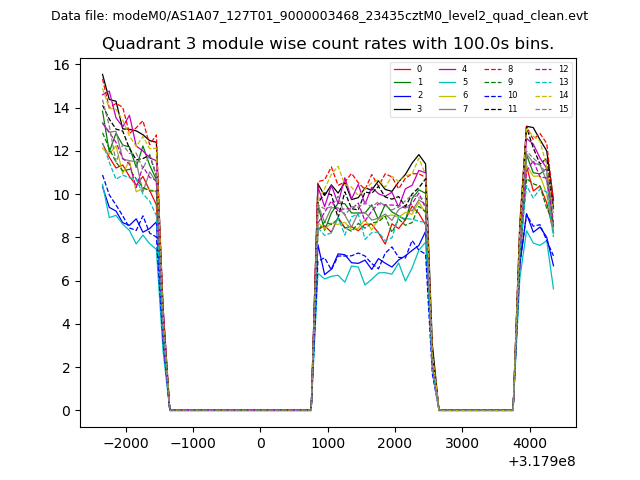 |
 |
| Parameter | Plot |
|---|---|
| CZT HV Monitor | 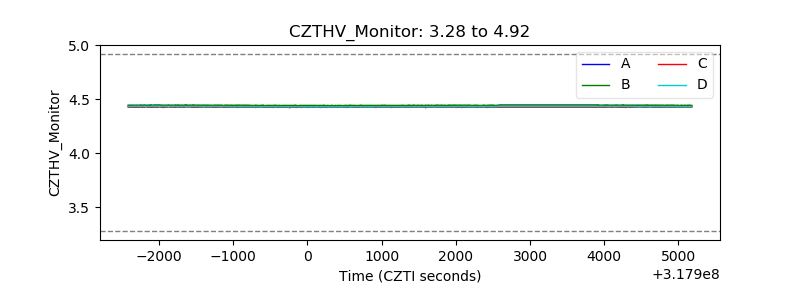 |
| D_VDD | 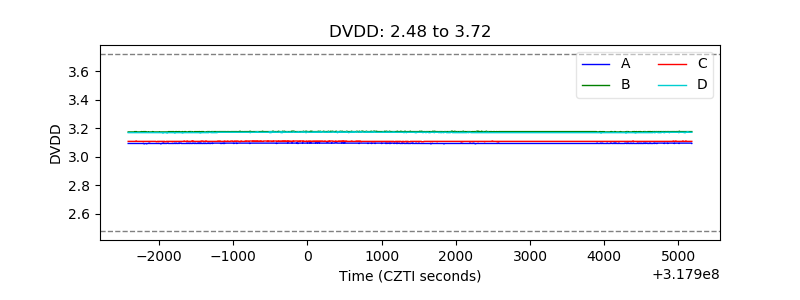 |
| Temperature 1 | 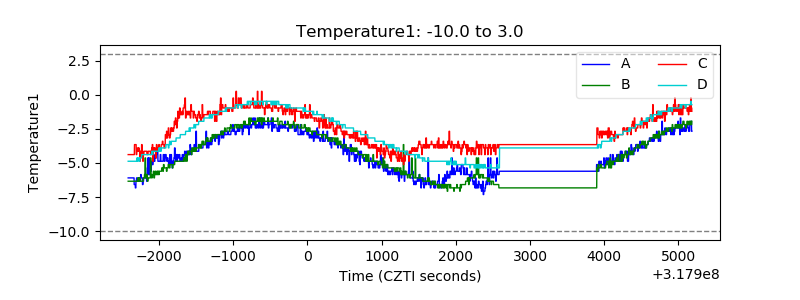 |
| Veto HV Monitor | 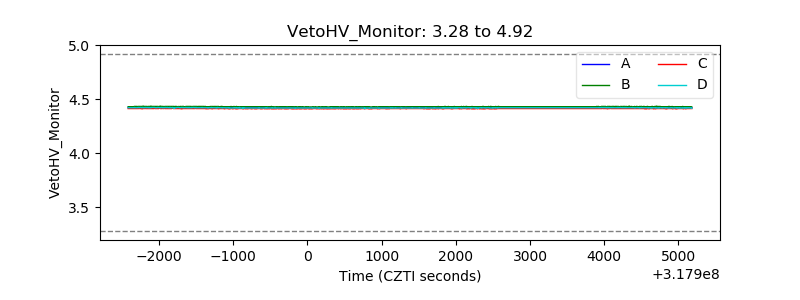 |
| Veto LLD | 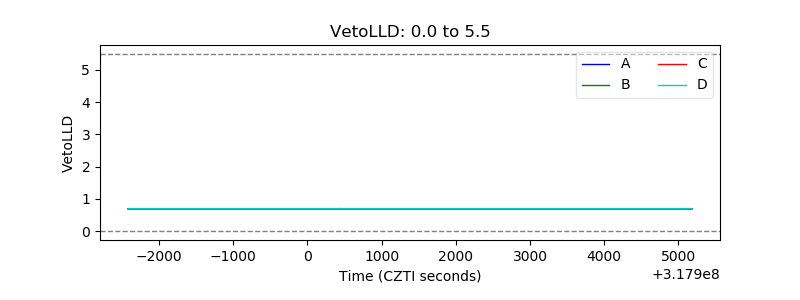 |
| Alpha Counter | 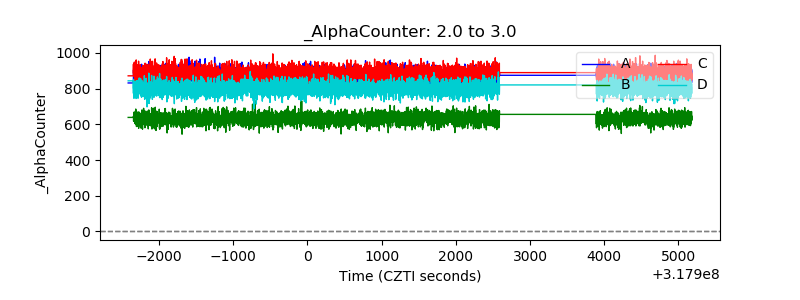 |
| _CPM_Rate | 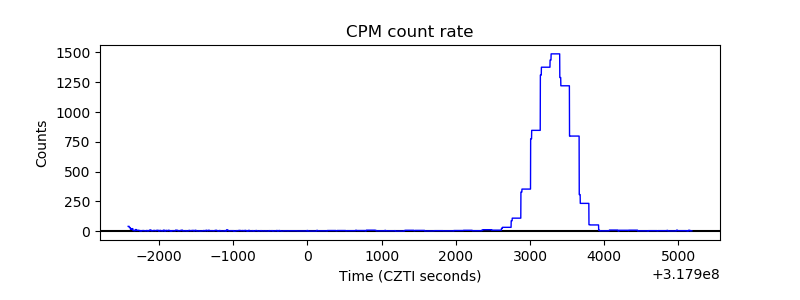 |
| CZT Counter |  |
| +2.5 Volts monitor | 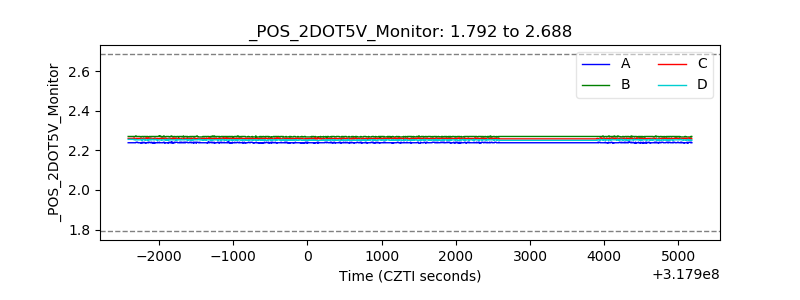 |
| +5 Volts monitor |  |
| _ROLL_ROT | 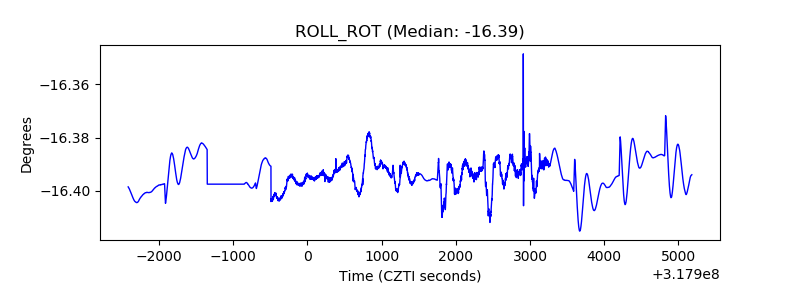 |
| _Roll_DEC | 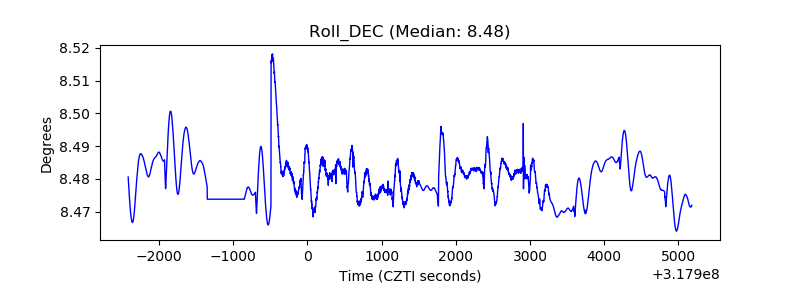 |
| _Roll_RA | 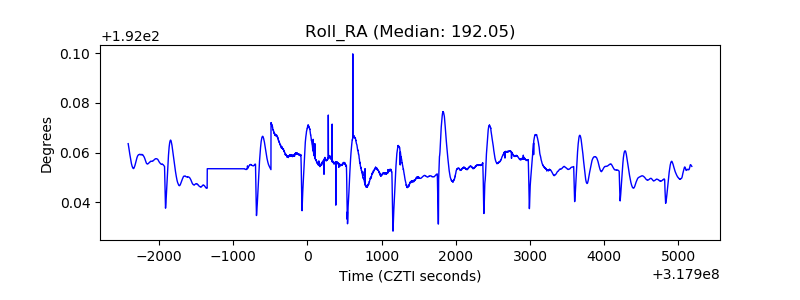 |
| Veto Counter | 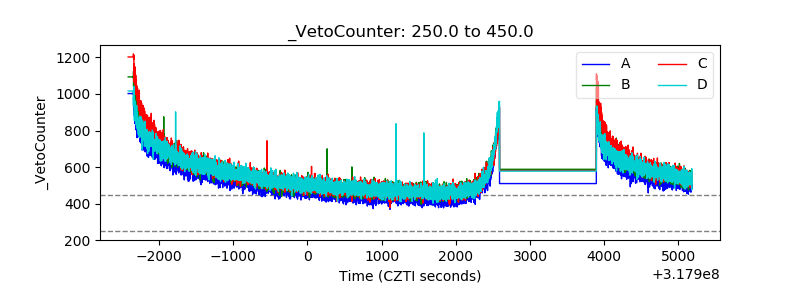 |