| Param | Original file | Final file |
|---|---|---|
| Filename | modeM0/AS1A07_127T01_9000003468_23439cztM0_level2.evt | modeM0/AS1A07_127T01_9000003468_23439cztM0_level2_quad_clean.evt |
| Size (bytes) | 696,205,440 | 80,907,840 |
| Size | 664.0 MB | 77.2 MB |
| Events in quadrant A | 3,461,757 | 505,330 |
| Events in quadrant B | 3,534,730 | 509,636 |
| Events in quadrant C | 5,755,552 | 483,586 |
| Events in quadrant D | 7,851,391 | 456,163 |
| Mode SS | |||
|---|---|---|---|
| Quadrant | BADHDUFLAG | Total packets | Discarded packets |
| A | 0 | 144 | 0 |
| B | 0 | 144 | 0 |
| C | 0 | 144 | 0 |
| D | 0 | 144 | 0 |
| Mode M9 | |||
|---|---|---|---|
| Quadrant | BADHDUFLAG | Total packets | Discarded packets |
| A | 0 | 2 | 0 |
| B | 0 | 2 | 0 |
| C | 0 | 2 | 0 |
| D | 0 | 2 | 0 |
| Mode M0 | |||
|---|---|---|---|
| Quadrant | BADHDUFLAG | Total packets | Discarded packets |
| A | 0 | 14796 | 1 |
| B | 0 | 14859 | 1 |
| C | 0 | 21700 | 2 |
| D | 0 | 28277 | 1 |
| Quadrant | Total seconds | Saturated seconds | Saturation percentage |
|---|---|---|---|
| A | 7109 | 77 | 1.083134% |
| B | 7109 | 107 | 1.505134% |
| C | 7108 | 951 | 13.379291% |
| D | 7108 | 1603 | 22.552054% |
Noise dominated data is calculated using 1-second bins in cleaned event files. If a bin has >2000 counts, and if more than 50% of those come from <1% of pixels, then it is considered to be noise-dominated and hence unusable.
| Quadrant | # 1 sec bins | Bins with >0 counts | Bins with >2000 counts | High rate bins dominated by noise | Noise dominated (total time) | Noise dominated (detector-on time) | Marked lightcurve |
|---|---|---|---|---|---|---|---|
| A | 7309 | 7110 | 2 | 2 | 0.03% | 0.03% | 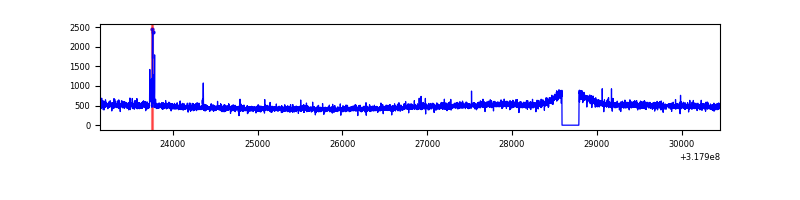 |
| B | 7309 | 7110 | 9 | 9 | 0.12% | 0.13% | 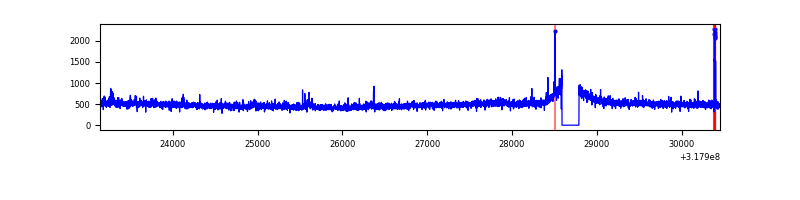 |
| C | 7308 | 7109 | 530 | 530 | 7.25% | 7.46% | 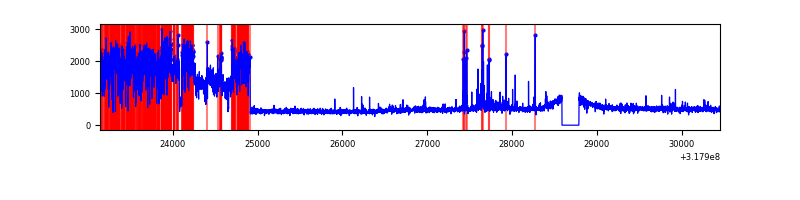 |
| D | 7308 | 7108 | 1390 | 1390 | 19.02% | 19.56% | 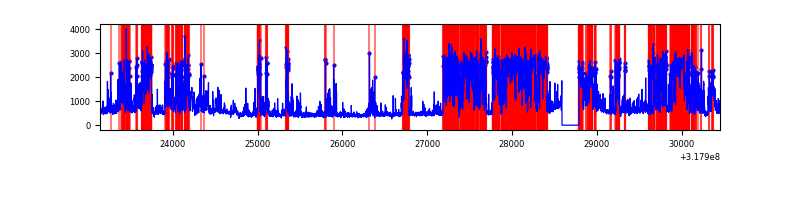 |
Top three noisy pixels from each quadrant. If the there are fewer than three noisy pixels in the level2.evt file, extra rows are filled as -1
| Pixel properties | Quadrant properties | ||||||
|---|---|---|---|---|---|---|---|
| Quadrant | DetID | PixID | Counts | Sigma | Mean | Median | Sigma |
| A | 15 | 174 | 35068 | 189.84 | 887 | 868 | 180.2 |
| A | 13 | 254 | 11724 | 60.26 | 887 | 868 | 180.2 |
| A | 3 | 137 | 7881 | 38.93 | 887 | 868 | 180.2 |
| B | 0 | 189 | 48199 | 282.01 | 879 | 858 | 167.9 |
| B | 0 | 228 | 27130 | 156.5 | 879 | 858 | 167.9 |
| B | 12 | 111 | 20558 | 117.35 | 879 | 858 | 167.9 |
| C | 10 | 9 | 2374009 | 12226.91 | 828 | 834 | 194.1 |
| C | 14 | 238 | 128941 | 660.02 | 828 | 834 | 194.1 |
| C | 7 | 247 | 11122 | 53.01 | 828 | 834 | 194.1 |
| D | 1 | 52 | 4167687 | 21504.91 | 786 | 764 | 193.8 |
| D | 13 | 172 | 479072 | 2468.48 | 786 | 764 | 193.8 |
| D | 12 | 233 | 84370 | 431.48 | 786 | 764 | 193.8 |
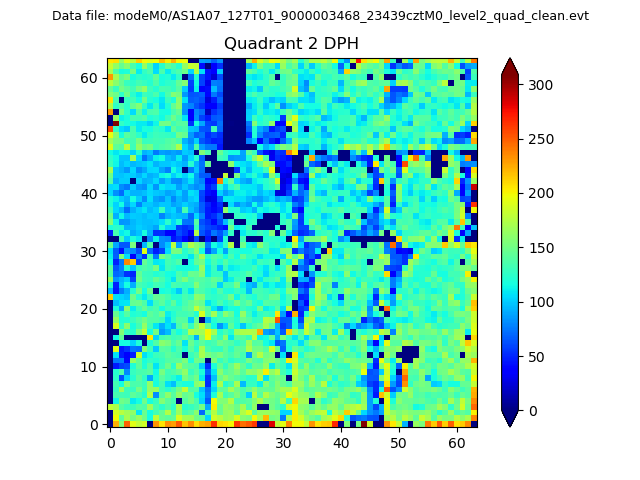
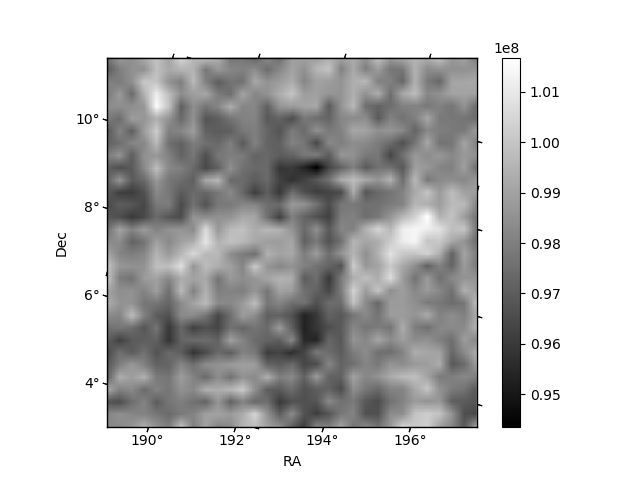
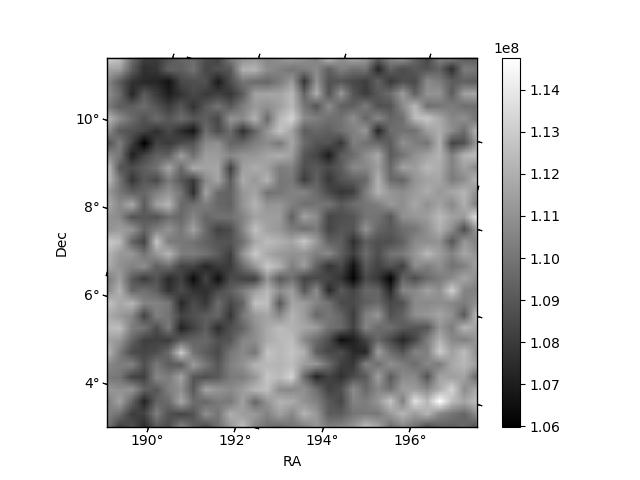
Histogram calculated using DETX and DETY for each event in the final _common_clean file
| Quadrant A | 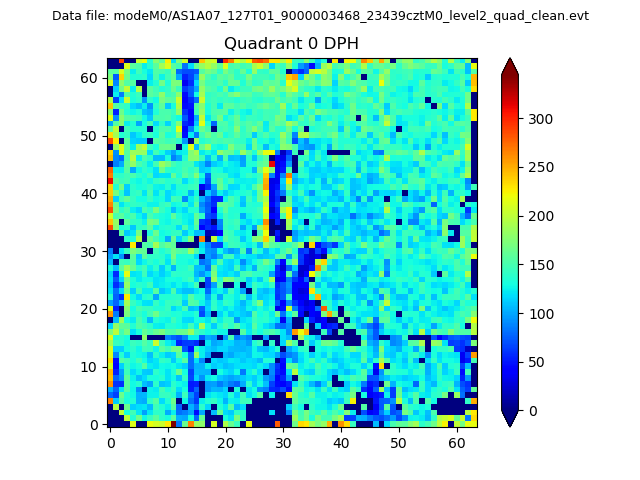 |
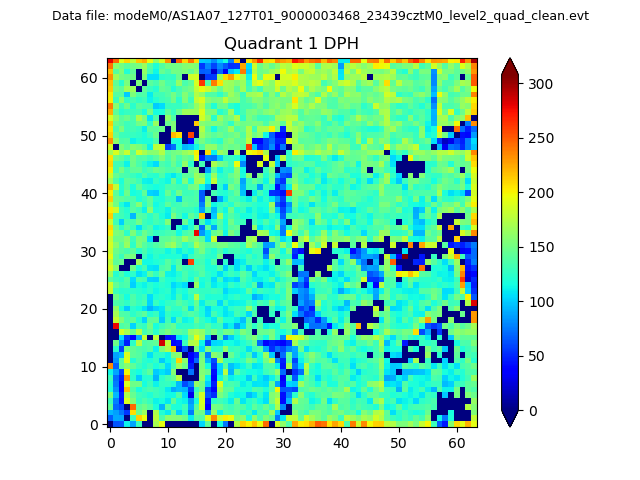 |
Quadrant B |
|---|---|---|---|
| Quadrant D | 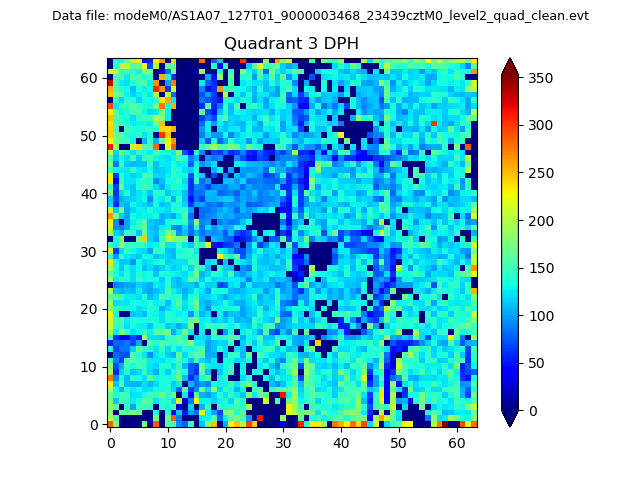 |
 |
Quadrant C |
| Plot type | Count rate plots | Images |
|---|---|---|
| Comparison with Poisson distribution Blue bars denote a histogram of data divided into 1 sec bins. Red curve is a Poisson curve with rate = median count rate of data. |
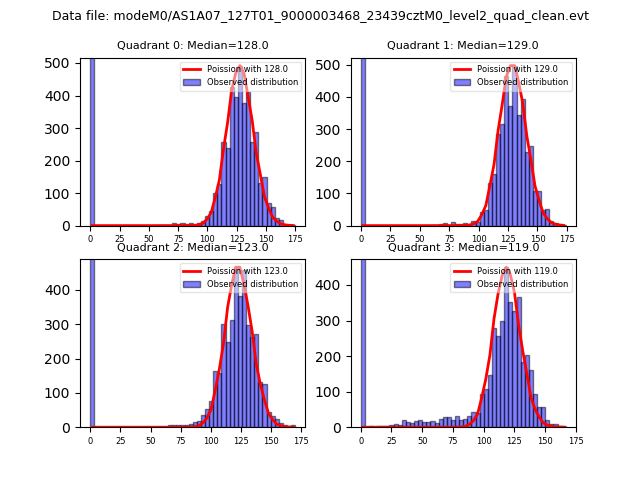 |
 |
| Quadrant-wise count rates Data is divided into 100 sec bins |
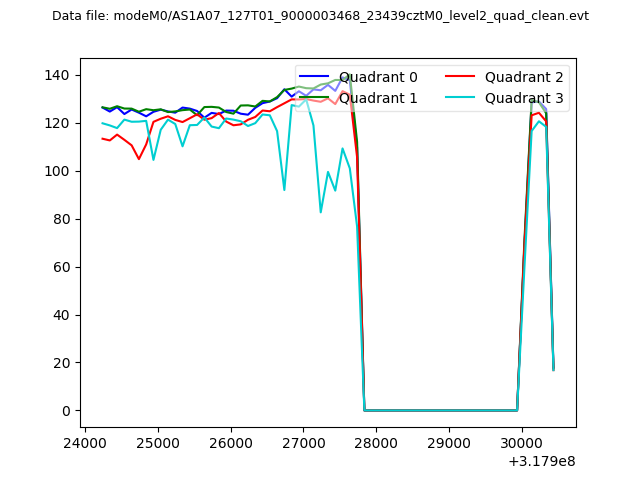 |
|
| Module-wise count rates for Quadrant A Data is divided into 100 sec bins |
 |
 |
| Module-wise count rates for Quadrant B Data is divided into 100 sec bins |
 |
 |
| Module-wise count rates for Quadrant C Data is divided into 100 sec bins |
 |
 |
| Module-wise count rates for Quadrant D Data is divided into 100 sec bins |
 |
 |
| Parameter | Plot |
|---|---|
| CZT HV Monitor |  |
| D_VDD | 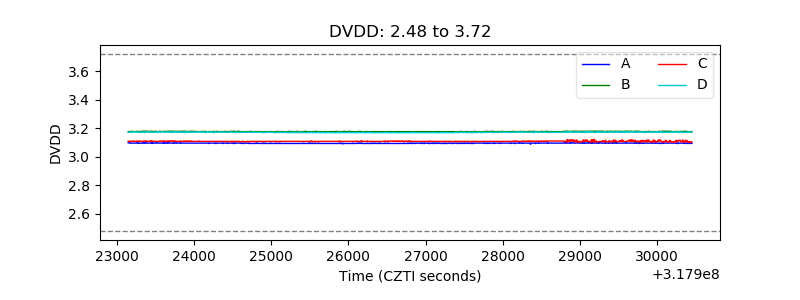 |
| Temperature 1 | 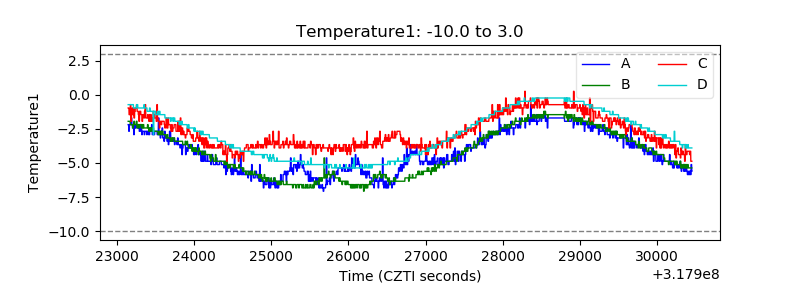 |
| Veto HV Monitor | 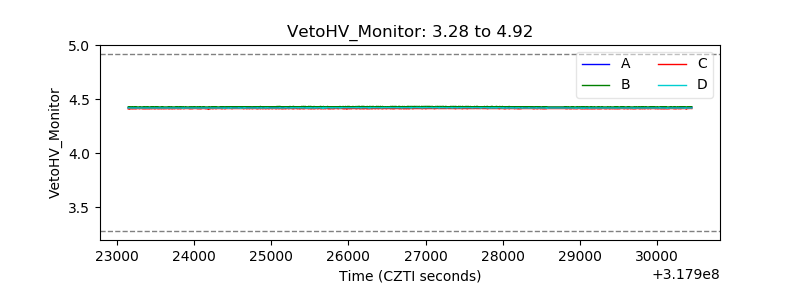 |
| Veto LLD | 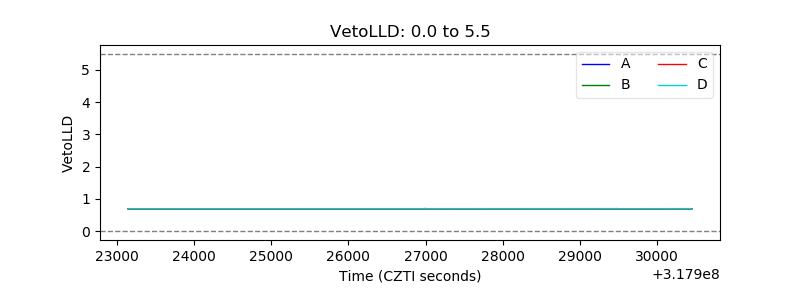 |
| Alpha Counter | 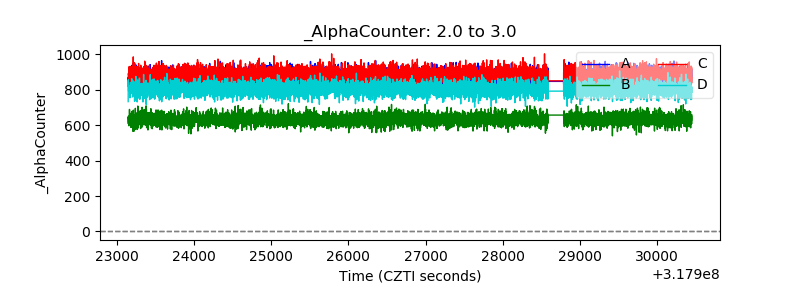 |
| _CPM_Rate | 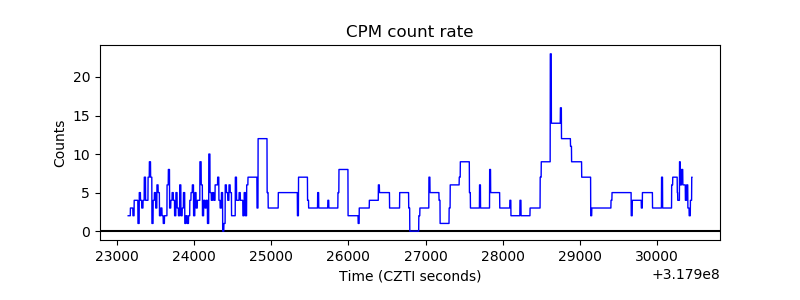 |
| CZT Counter | 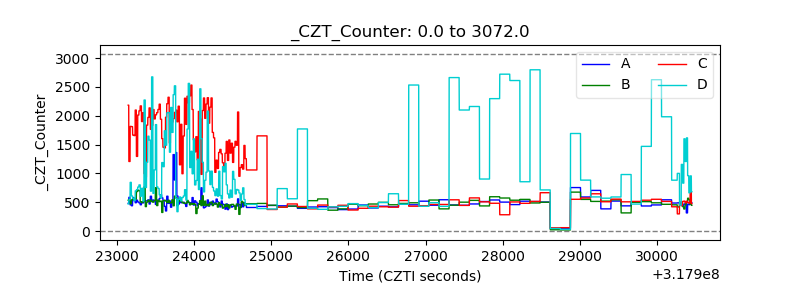 |
| +2.5 Volts monitor |  |
| +5 Volts monitor |  |
| _ROLL_ROT | 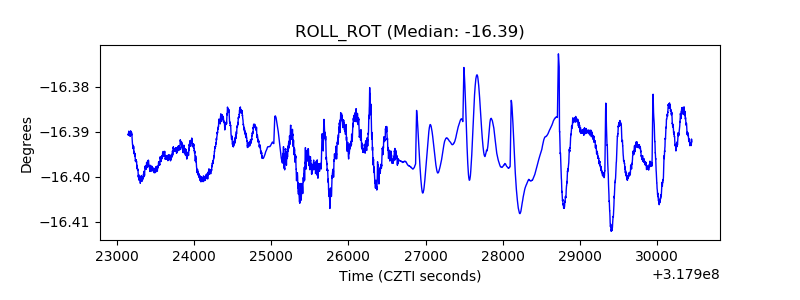 |
| _Roll_DEC | 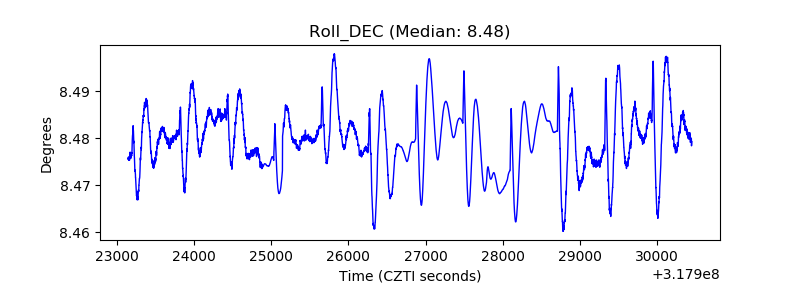 |
| _Roll_RA |  |
| Veto Counter |  |