| Param | Original file | Final file |
|---|---|---|
| Filename | modeM0/AS1A07_127T01_9000003468_23440cztM0_level2.evt | modeM0/AS1A07_127T01_9000003468_23440cztM0_level2_quad_clean.evt |
| Size (bytes) | 563,760,000 | 87,943,680 |
| Size | 537.6 MB | 83.9 MB |
| Events in quadrant A | 3,354,846 | 556,266 |
| Events in quadrant B | 3,586,861 | 559,443 |
| Events in quadrant C | 3,542,584 | 540,513 |
| Events in quadrant D | 6,108,353 | 512,973 |
| Mode SS | |||
|---|---|---|---|
| Quadrant | BADHDUFLAG | Total packets | Discarded packets |
| A | 0 | 144 | 0 |
| B | 0 | 144 | 0 |
| C | 0 | 144 | 0 |
| D | 0 | 144 | 0 |
| Mode M9 | |||
|---|---|---|---|
| Quadrant | BADHDUFLAG | Total packets | Discarded packets |
| A | 0 | 3 | 0 |
| B | 0 | 3 | 0 |
| C | 0 | 3 | 0 |
| D | 0 | 3 | 0 |
| Mode M0 | |||
|---|---|---|---|
| Quadrant | BADHDUFLAG | Total packets | Discarded packets |
| A | 0 | 14553 | 1 |
| B | 0 | 15151 | 1 |
| C | 0 | 14914 | 1 |
| D | 0 | 23048 | 4 |
| Quadrant | Total seconds | Saturated seconds | Saturation percentage |
|---|---|---|---|
| A | 7090 | 27 | 0.380818% |
| B | 7091 | 100 | 1.410238% |
| C | 7091 | 97 | 1.367931% |
| D | 7090 | 758 | 10.691114% |
Noise dominated data is calculated using 1-second bins in cleaned event files. If a bin has >2000 counts, and if more than 50% of those come from <1% of pixels, then it is considered to be noise-dominated and hence unusable.
| Quadrant | # 1 sec bins | Bins with >0 counts | Bins with >2000 counts | High rate bins dominated by noise | Noise dominated (total time) | Noise dominated (detector-on time) | Marked lightcurve |
|---|---|---|---|---|---|---|---|
| A | 7435 | 7091 | 0 | 0 | 0.00% | 0.00% | 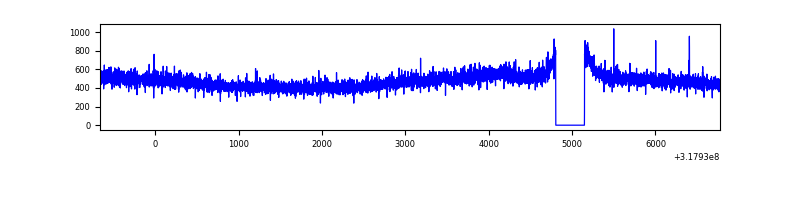 |
| B | 7436 | 7092 | 13 | 13 | 0.17% | 0.18% | 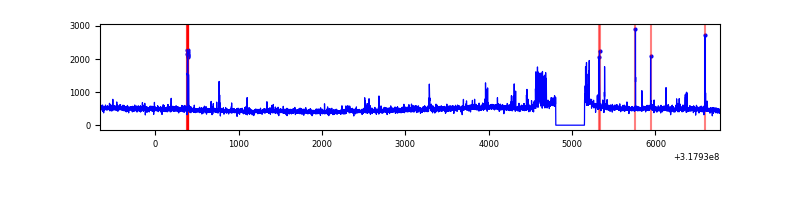 |
| C | 7436 | 7092 | 5 | 5 | 0.07% | 0.07% | 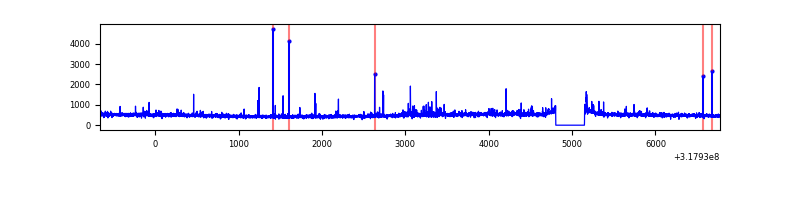 |
| D | 7435 | 7090 | 694 | 694 | 9.33% | 9.79% | 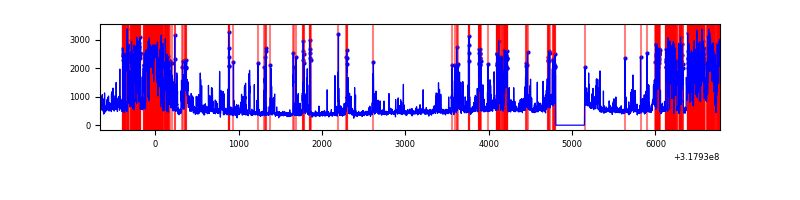 |
Top three noisy pixels from each quadrant. If the there are fewer than three noisy pixels in the level2.evt file, extra rows are filled as -1
| Pixel properties | Quadrant properties | ||||||
|---|---|---|---|---|---|---|---|
| Quadrant | DetID | PixID | Counts | Sigma | Mean | Median | Sigma |
| A | 13 | 254 | 11372 | 59.61 | 868 | 849 | 176.5 |
| A | 3 | 137 | 7649 | 38.52 | 868 | 849 | 176.5 |
| A | 0 | 226 | 7536 | 37.88 | 868 | 849 | 176.5 |
| B | 0 | 189 | 81998 | 491.05 | 859 | 837 | 165.3 |
| B | 0 | 190 | 78115 | 467.56 | 859 | 837 | 165.3 |
| B | 0 | 228 | 32247 | 190.04 | 859 | 837 | 165.3 |
| C | 10 | 9 | 139046 | 705.23 | 831 | 836 | 196.0 |
| C | 14 | 238 | 130153 | 659.85 | 831 | 836 | 196.0 |
| C | 7 | 247 | 10162 | 47.59 | 831 | 836 | 196.0 |
| D | 1 | 52 | 2656352 | 13246.34 | 816 | 792 | 200.5 |
| D | 12 | 233 | 158515 | 786.75 | 816 | 792 | 200.5 |
| D | 7 | 238 | 145640 | 722.52 | 816 | 792 | 200.5 |
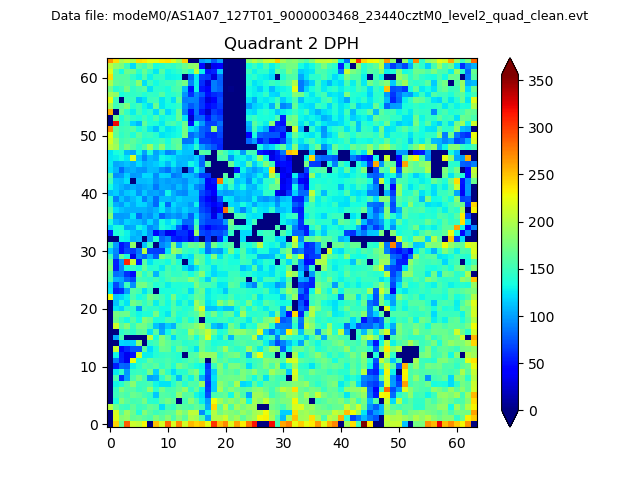
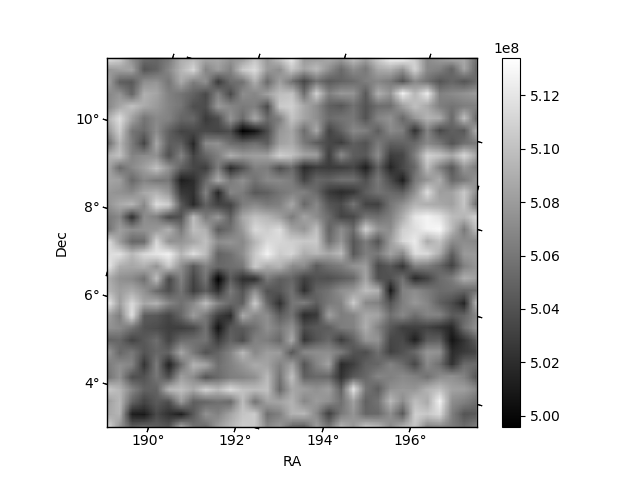
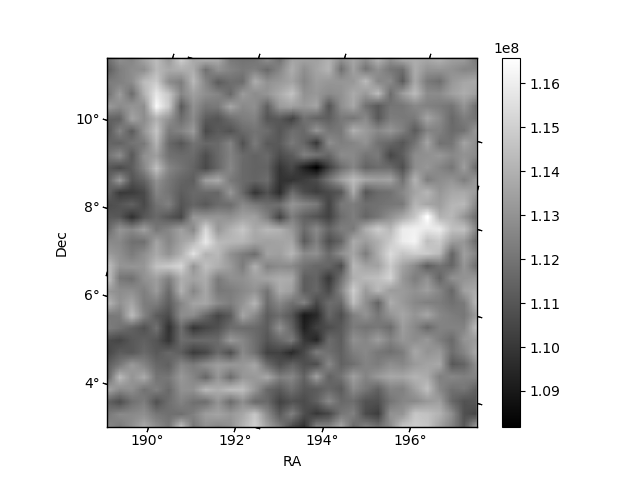
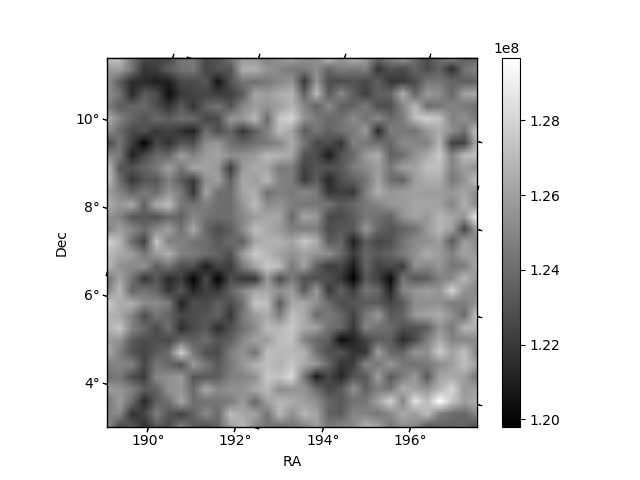
Histogram calculated using DETX and DETY for each event in the final _common_clean file
| Quadrant A | 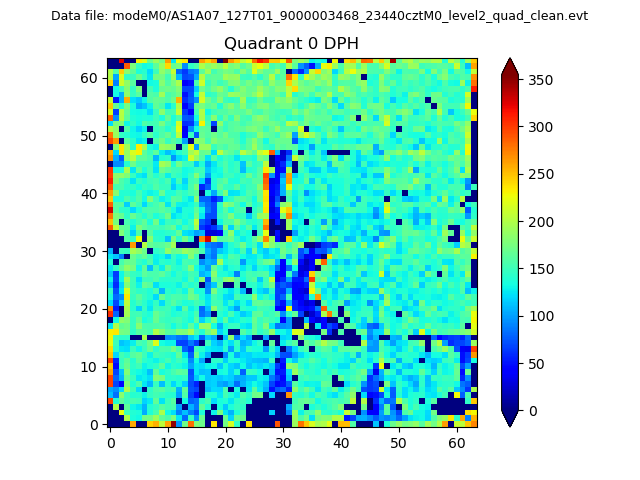 |
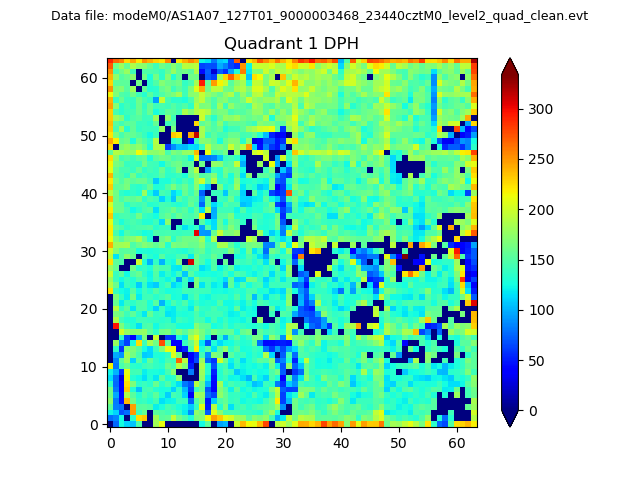 |
Quadrant B |
|---|---|---|---|
| Quadrant D | 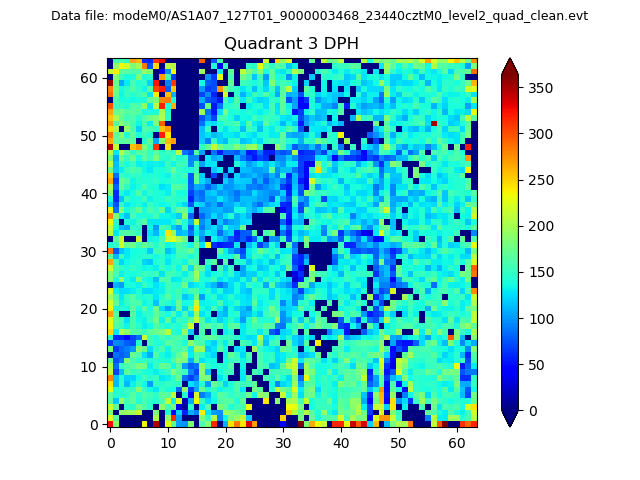 |
 |
Quadrant C |
| Plot type | Count rate plots | Images |
|---|---|---|
| Comparison with Poisson distribution Blue bars denote a histogram of data divided into 1 sec bins. Red curve is a Poisson curve with rate = median count rate of data. |
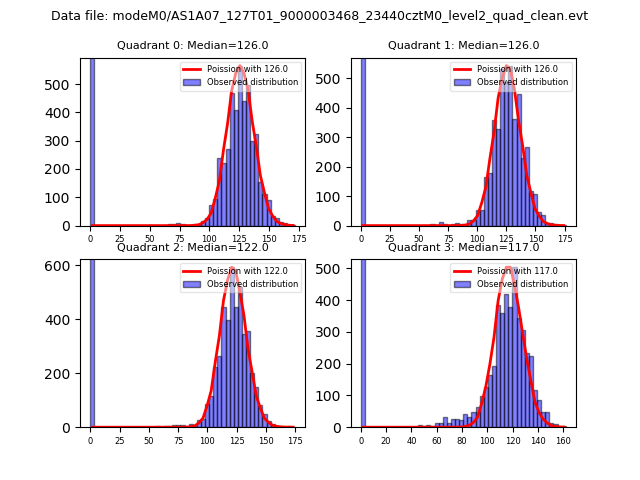 |
 |
| Quadrant-wise count rates Data is divided into 100 sec bins |
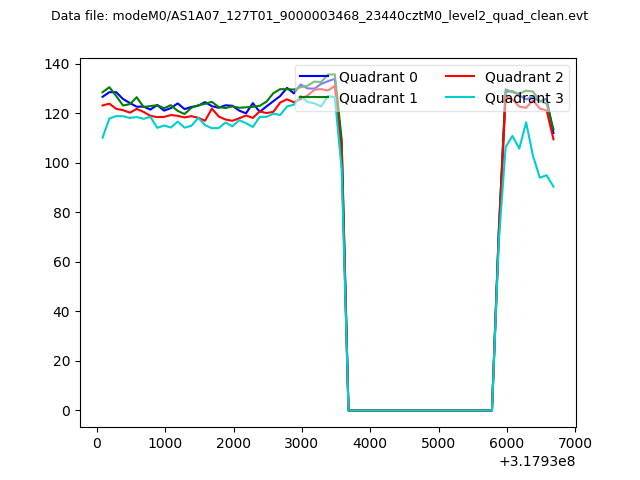 |
|
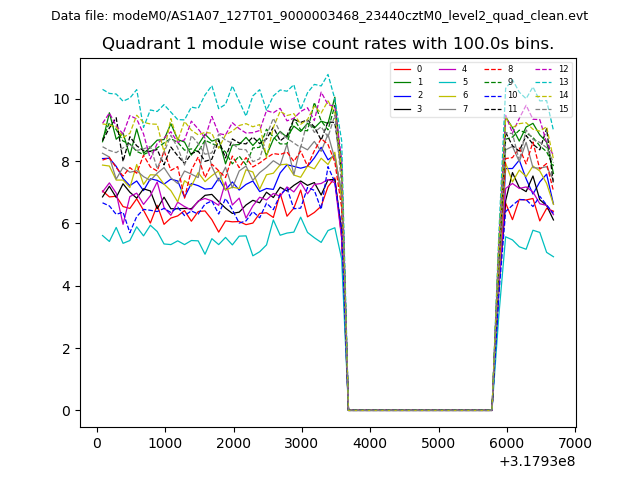
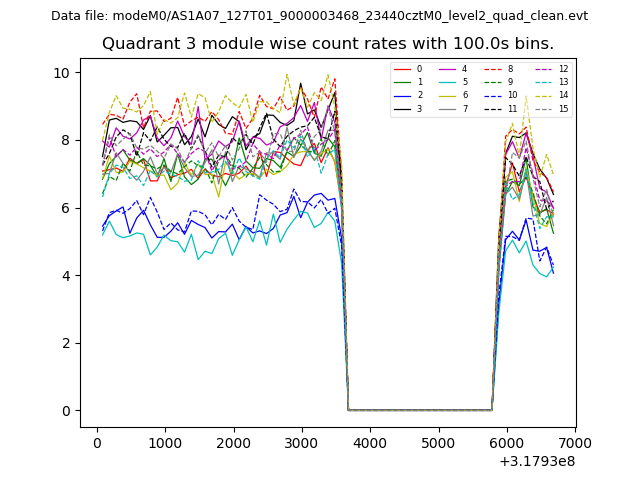
| Module-wise count rates for Quadrant A Data is divided into 100 sec bins |
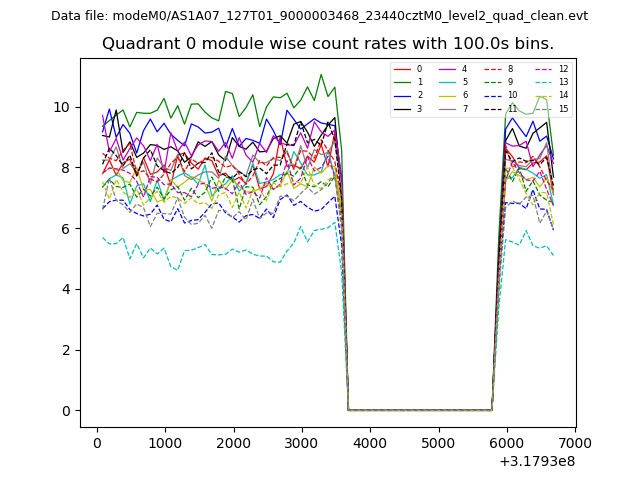 |
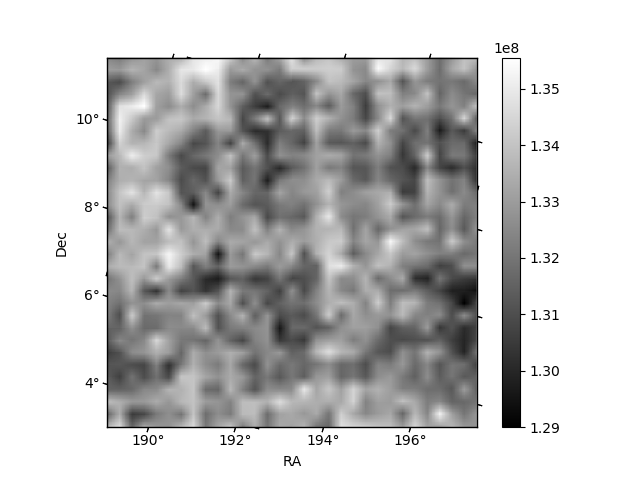 |
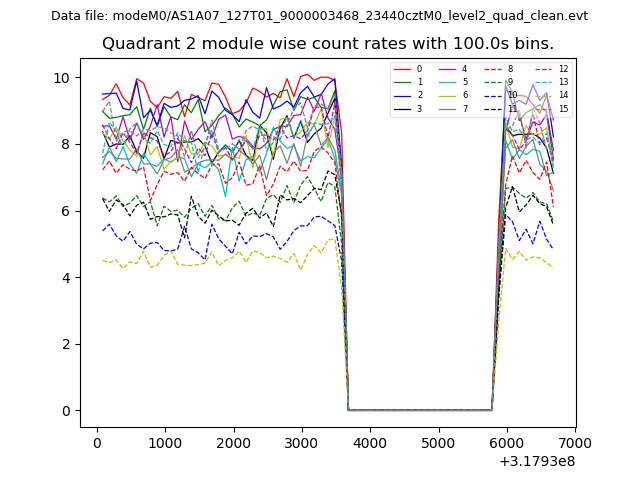
| Module-wise count rates for Quadrant B Data is divided into 100 sec bins |
 |
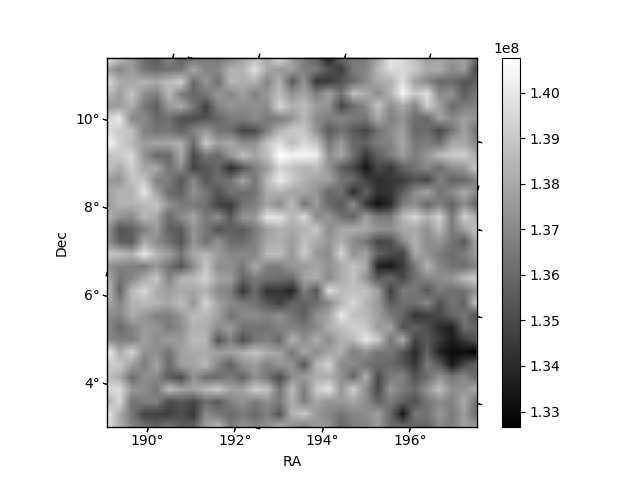 |
| Module-wise count rates for Quadrant C Data is divided into 100 sec bins |
 |
 |
| Module-wise count rates for Quadrant D Data is divided into 100 sec bins |
 |
 |
| Parameter | Plot |
|---|---|
| CZT HV Monitor | 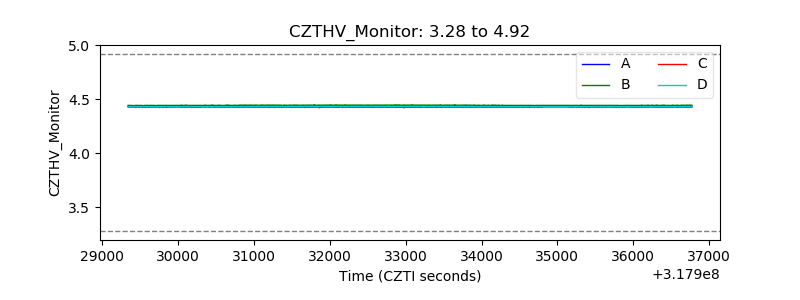 |
| D_VDD | 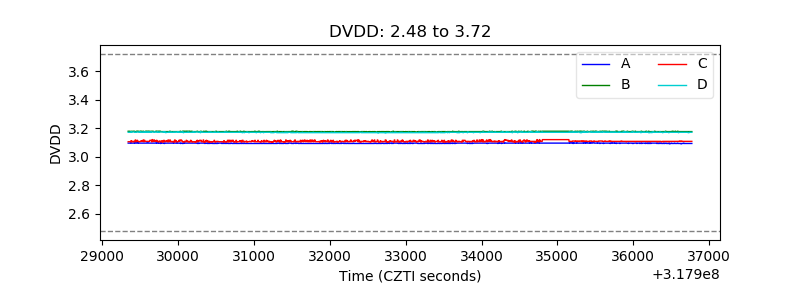 |
| Temperature 1 | 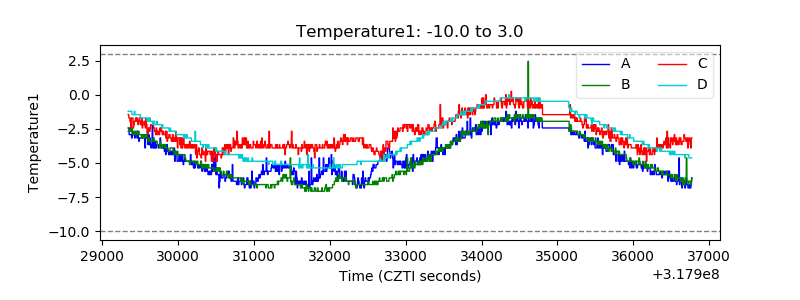 |
| Veto HV Monitor | 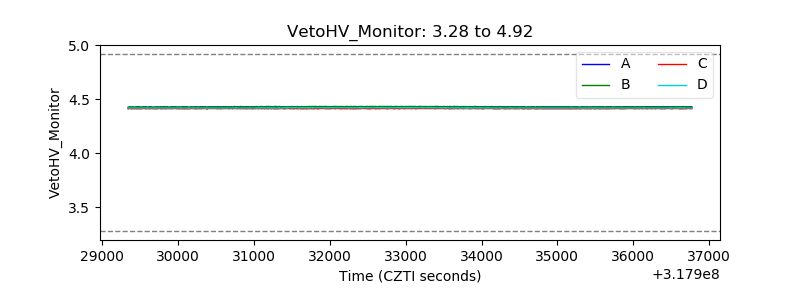 |
| Veto LLD | 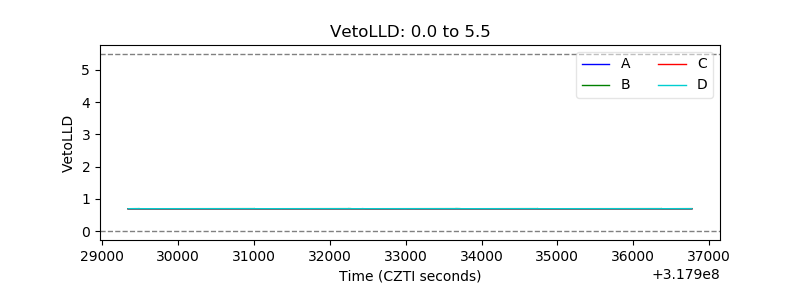 |
| Alpha Counter | 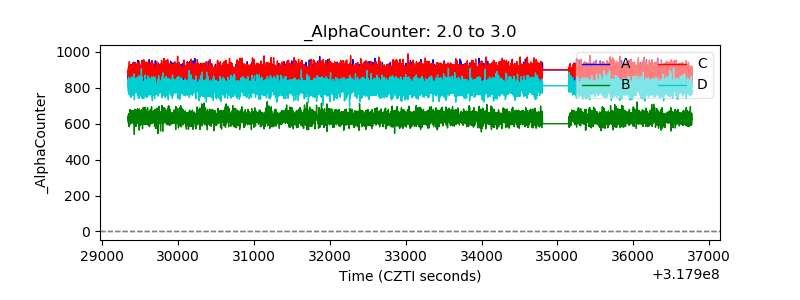 |
| _CPM_Rate | 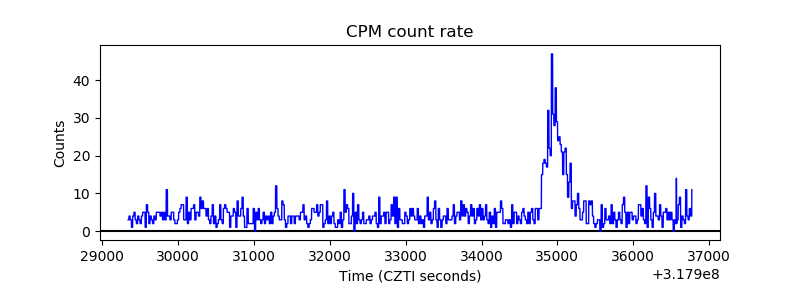 |
| CZT Counter | 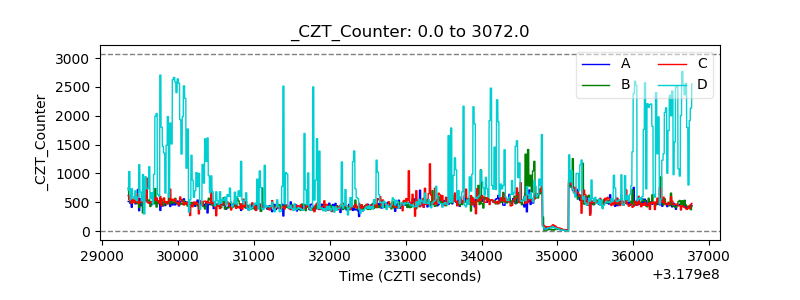 |
| +2.5 Volts monitor |  |
| +5 Volts monitor | 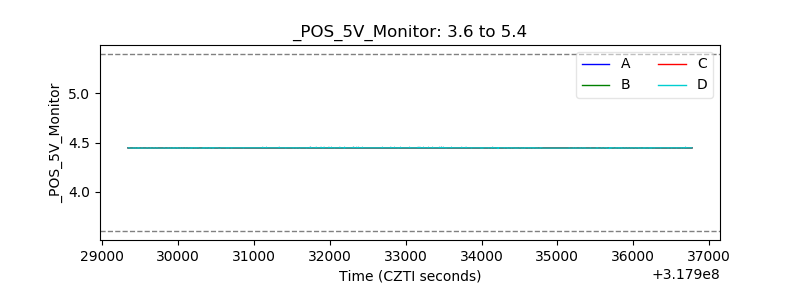 |
| _ROLL_ROT | 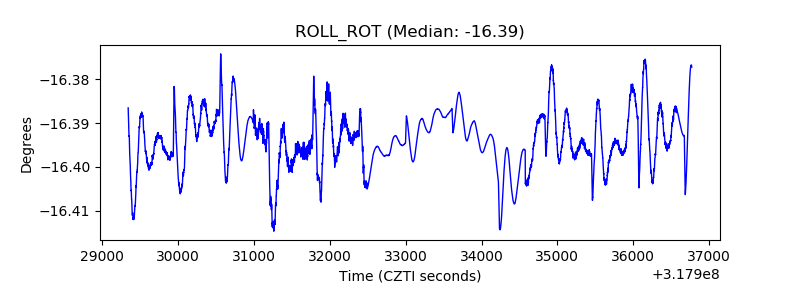 |
| _Roll_DEC | 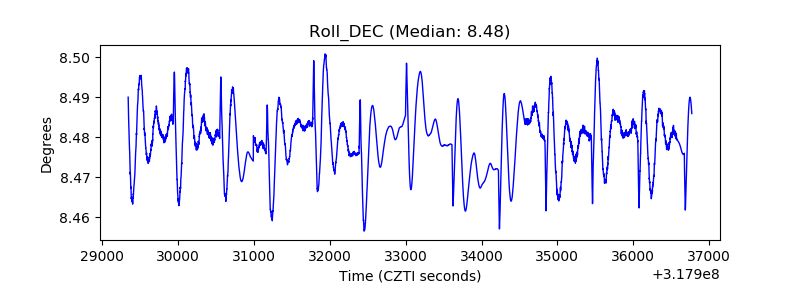 |
| _Roll_RA | 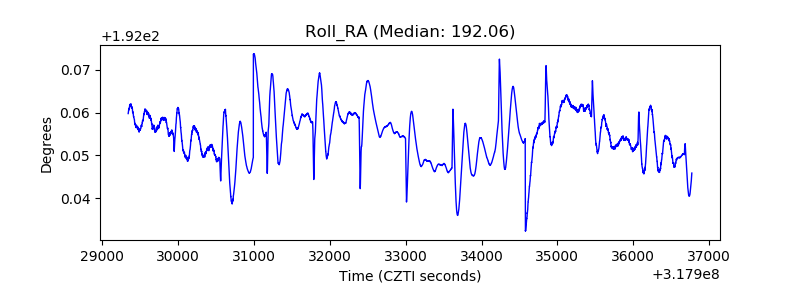 |
| Veto Counter | 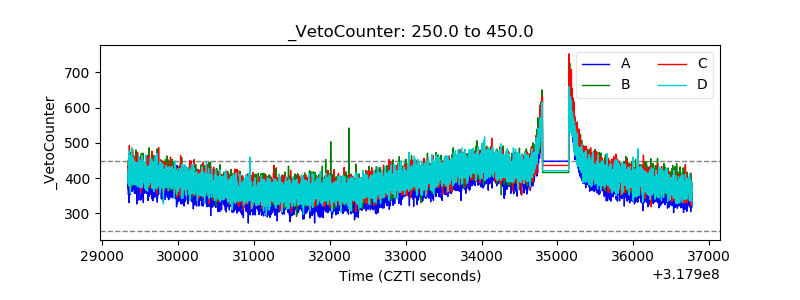 |