| Param | Original file | Final file |
|---|---|---|
| Filename | modeM0/AS1A07_127T01_9000003468_23442cztM0_level2.evt | modeM0/AS1A07_127T01_9000003468_23442cztM0_level2_quad_clean.evt |
| Size (bytes) | 504,705,600 | 79,585,920 |
| Size | 481.3 MB | 75.9 MB |
| Events in quadrant A | 2,748,255 | 516,804 |
| Events in quadrant B | 2,960,293 | 518,770 |
| Events in quadrant C | 3,061,111 | 502,809 |
| Events in quadrant D | 6,116,251 | 460,519 |
| Mode SS | |||
|---|---|---|---|
| Quadrant | BADHDUFLAG | Total packets | Discarded packets |
| A | 0 | 118 | 0 |
| B | 0 | 118 | 0 |
| C | 0 | 118 | 0 |
| D | 0 | 118 | 0 |
| Mode M9 | |||
|---|---|---|---|
| Quadrant | BADHDUFLAG | Total packets | Discarded packets |
| A | 0 | 6 | 0 |
| B | 0 | 6 | 0 |
| C | 0 | 6 | 0 |
| D | 0 | 6 | 0 |
| Mode M0 | |||
|---|---|---|---|
| Quadrant | BADHDUFLAG | Total packets | Discarded packets |
| A | 0 | 12035 | 1 |
| B | 0 | 12634 | 1 |
| C | 0 | 12867 | 1 |
| D | 0 | 22350 | 1 |
| Quadrant | Total seconds | Saturated seconds | Saturation percentage |
|---|---|---|---|
| A | 5883 | 19 | 0.322964% |
| B | 5884 | 52 | 0.883753% |
| C | 5884 | 108 | 1.835486% |
| D | 5884 | 1102 | 18.728756% |
Noise dominated data is calculated using 1-second bins in cleaned event files. If a bin has >2000 counts, and if more than 50% of those come from <1% of pixels, then it is considered to be noise-dominated and hence unusable.
| Quadrant | # 1 sec bins | Bins with >0 counts | Bins with >2000 counts | High rate bins dominated by noise | Noise dominated (total time) | Noise dominated (detector-on time) | Marked lightcurve |
|---|---|---|---|---|---|---|---|
| A | 6428 | 5884 | 0 | 0 | 0.00% | 0.00% | 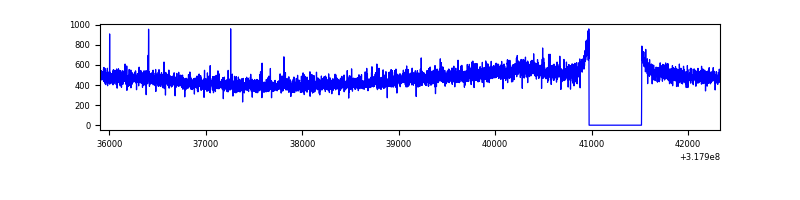 |
| B | 6429 | 5885 | 2 | 2 | 0.03% | 0.03% | 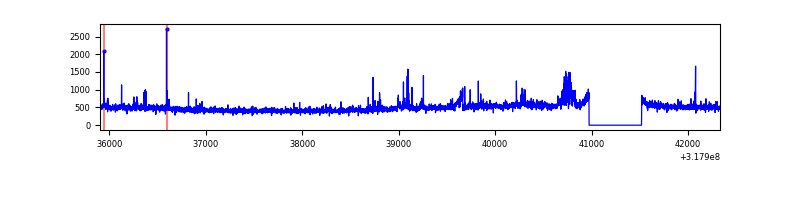 |
| C | 6429 | 5885 | 24 | 24 | 0.37% | 0.41% | 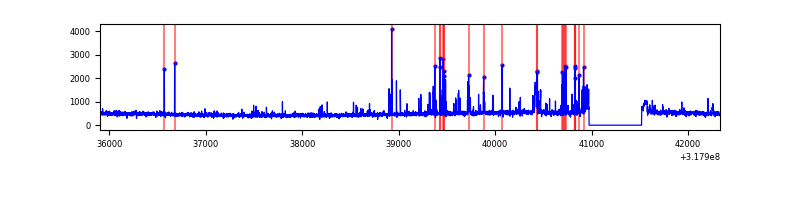 |
| D | 6429 | 5884 | 1026 | 1026 | 15.96% | 17.44% | 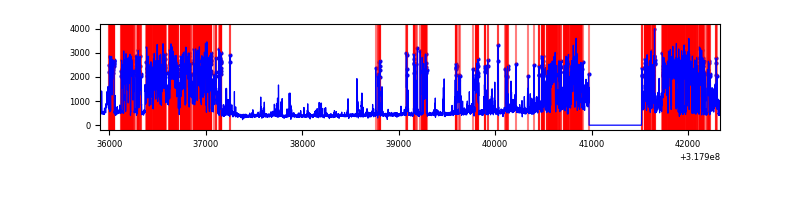 |
Top three noisy pixels from each quadrant. If the there are fewer than three noisy pixels in the level2.evt file, extra rows are filled as -1
| Pixel properties | Quadrant properties | ||||||
|---|---|---|---|---|---|---|---|
| Quadrant | DetID | PixID | Counts | Sigma | Mean | Median | Sigma |
| A | 13 | 254 | 8917 | 56.6 | 712 | 696 | 145.2 |
| A | 3 | 137 | 6246 | 38.21 | 712 | 696 | 145.2 |
| A | 0 | 226 | 6021 | 36.66 | 712 | 696 | 145.2 |
| B | 0 | 229 | 70103 | 505.08 | 707 | 687 | 137.4 |
| B | 0 | 190 | 68480 | 493.27 | 707 | 687 | 137.4 |
| B | 0 | 189 | 32202 | 229.31 | 707 | 687 | 137.4 |
| C | 10 | 9 | 301654 | 1866.74 | 680 | 684 | 161.2 |
| C | 14 | 238 | 105431 | 649.69 | 680 | 684 | 161.2 |
| C | 7 | 247 | 6046 | 33.26 | 680 | 684 | 161.2 |
| D | 1 | 52 | 3392924 | 21113.32 | 653 | 634 | 160.7 |
| D | 7 | 238 | 110245 | 682.21 | 653 | 634 | 160.7 |
| D | 13 | 172 | 61700 | 380.07 | 653 | 634 | 160.7 |
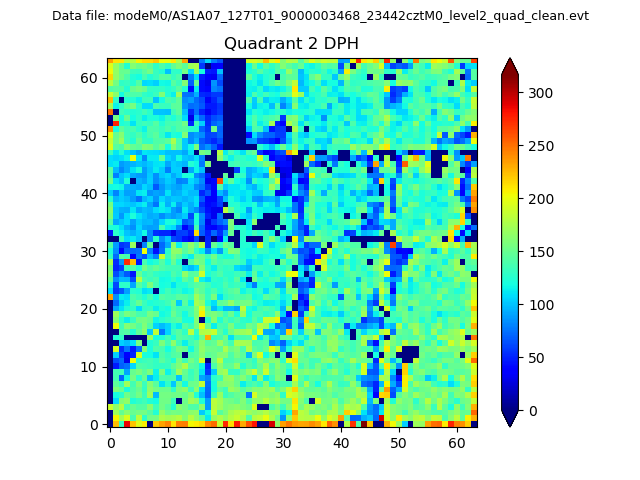
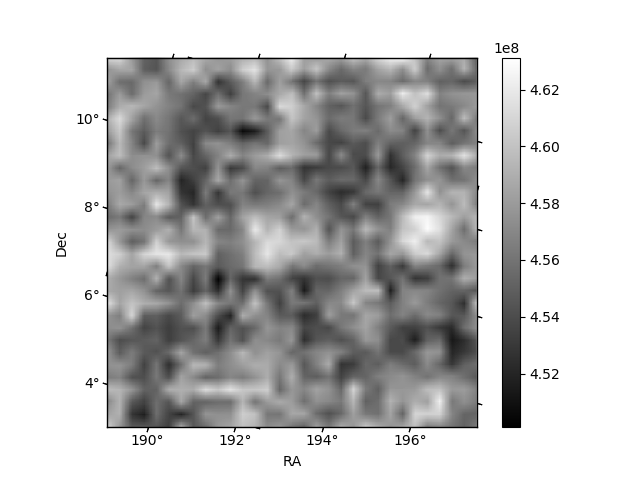
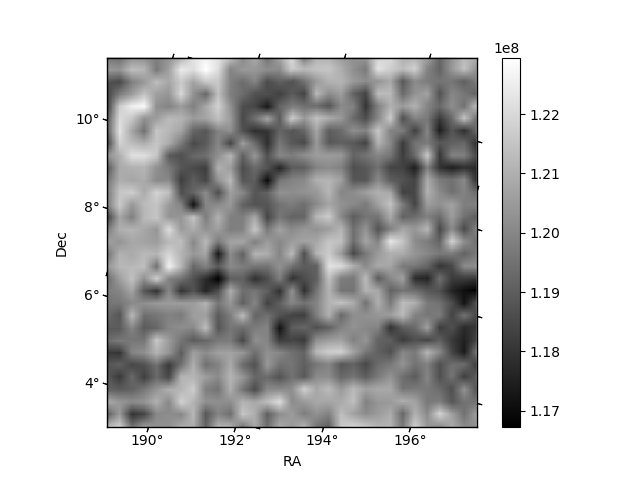
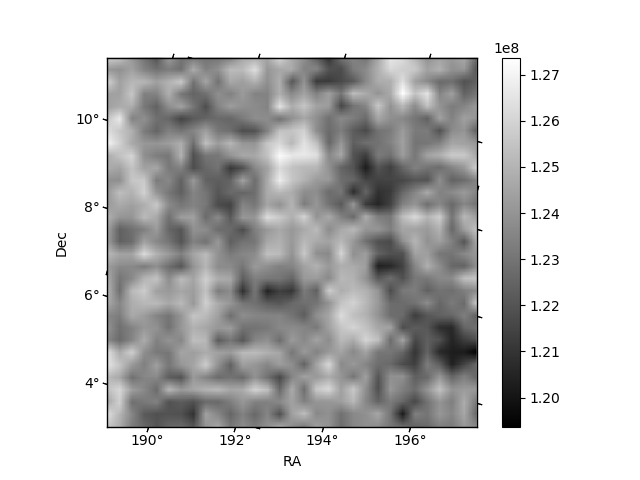
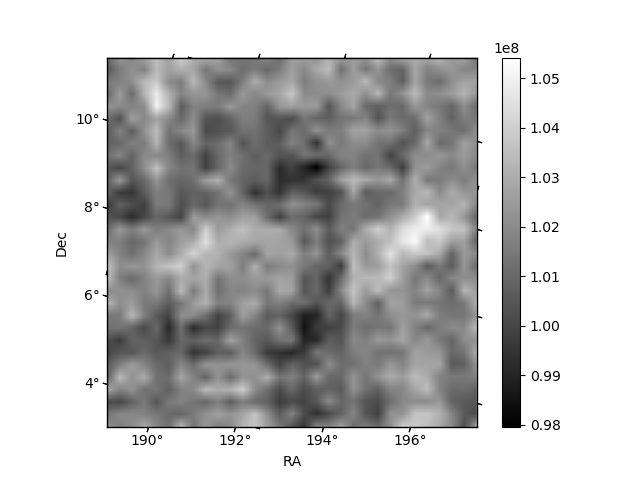
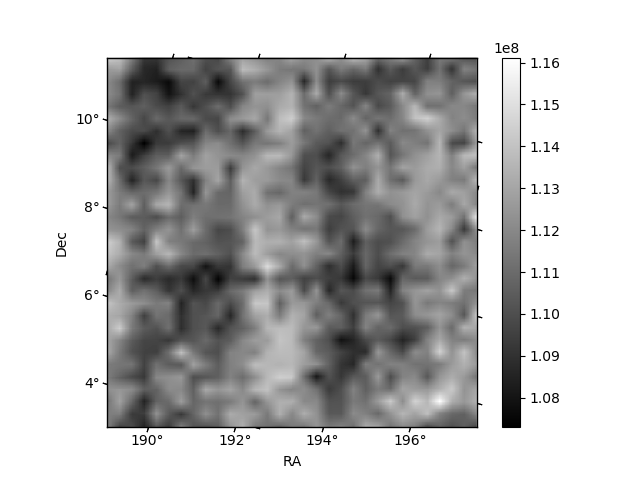
Histogram calculated using DETX and DETY for each event in the final _common_clean file
| Quadrant A | 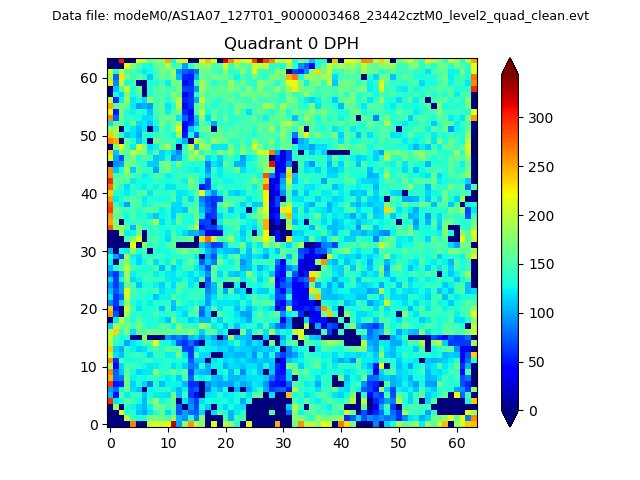 |
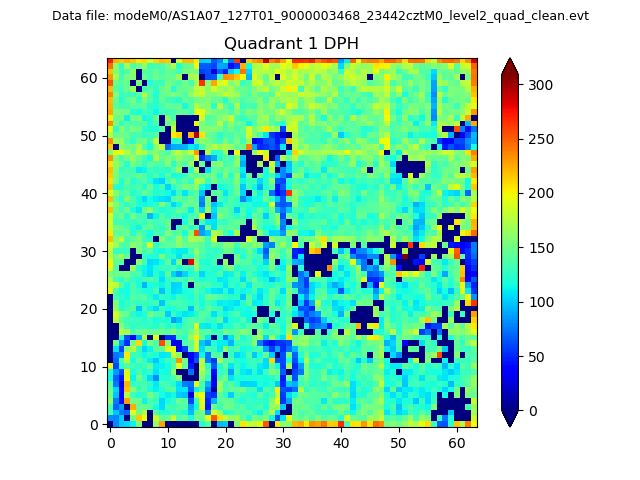 |
Quadrant B |
|---|---|---|---|
| Quadrant D | 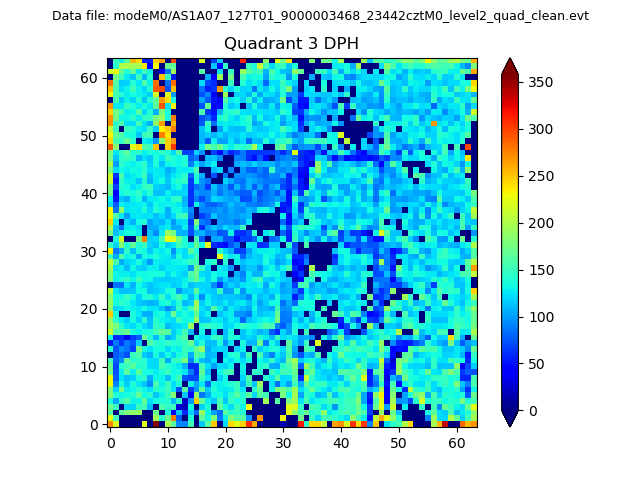 |
 |
Quadrant C |
| Plot type | Count rate plots | Images |
|---|---|---|
| Comparison with Poisson distribution Blue bars denote a histogram of data divided into 1 sec bins. Red curve is a Poisson curve with rate = median count rate of data. |
 |
 |
| Quadrant-wise count rates Data is divided into 100 sec bins |
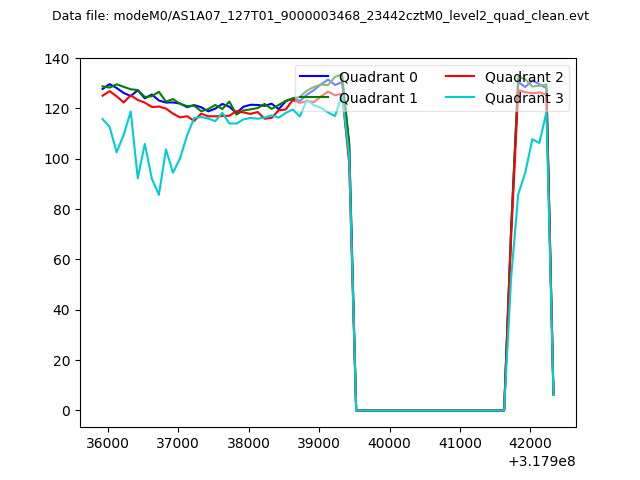 |
|
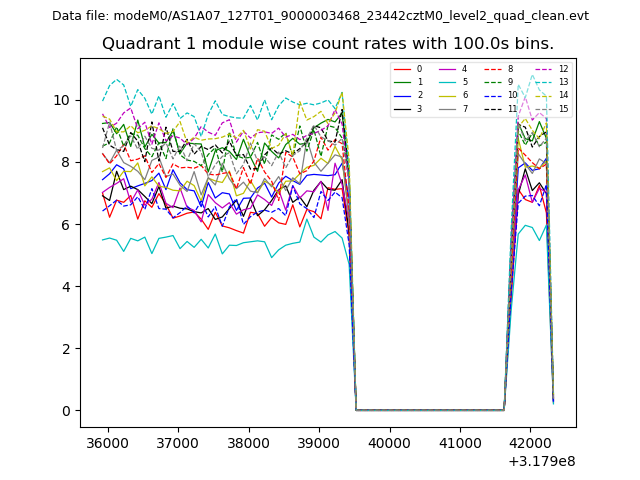
| Module-wise count rates for Quadrant A Data is divided into 100 sec bins |
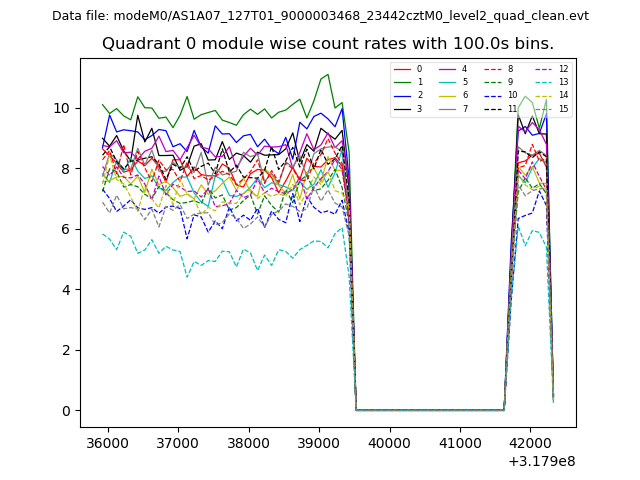 |
 |
| Module-wise count rates for Quadrant B Data is divided into 100 sec bins |
 |
 |
| Module-wise count rates for Quadrant C Data is divided into 100 sec bins |
 |
 |
| Module-wise count rates for Quadrant D Data is divided into 100 sec bins |
 |
 |
| Parameter | Plot |
|---|---|
| CZT HV Monitor |  |
| D_VDD | 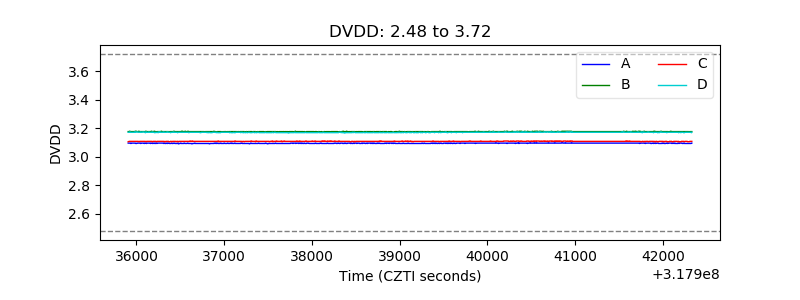 |
| Temperature 1 | 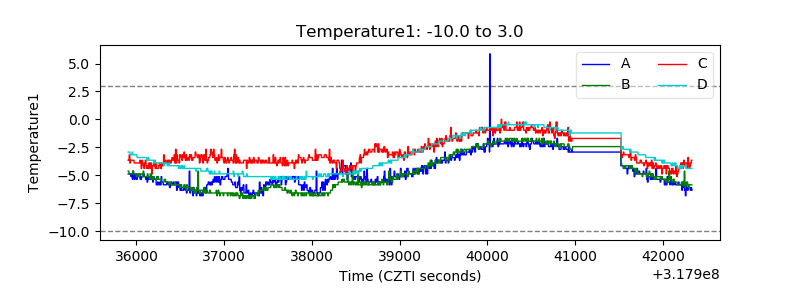 |
| Veto HV Monitor | 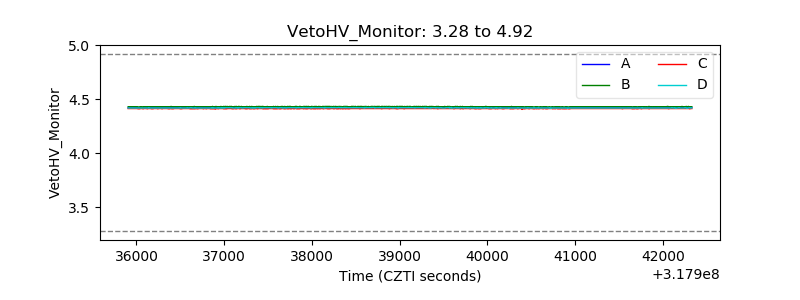 |
| Veto LLD | 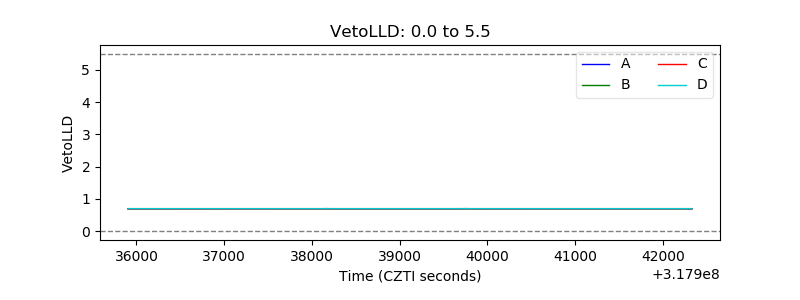 |
| Alpha Counter | 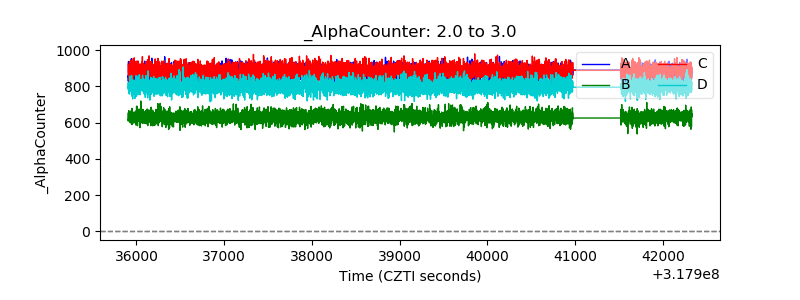 |
| _CPM_Rate | 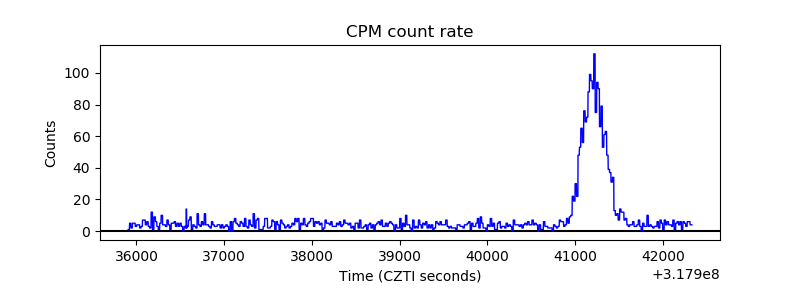 |
| CZT Counter | 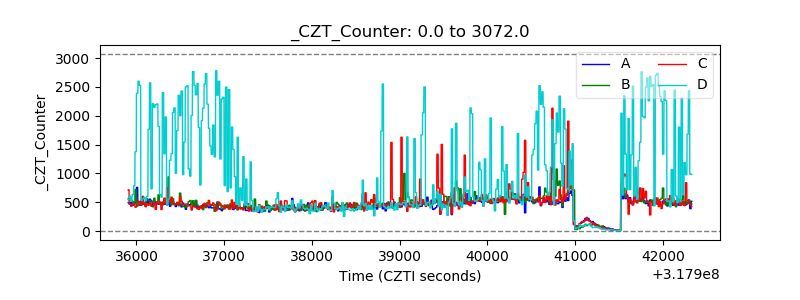 |
| +2.5 Volts monitor |  |
| +5 Volts monitor |  |
| _ROLL_ROT |  |
| _Roll_DEC | 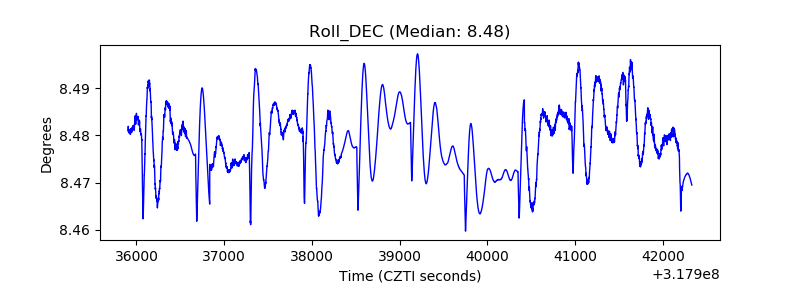 |
| _Roll_RA | 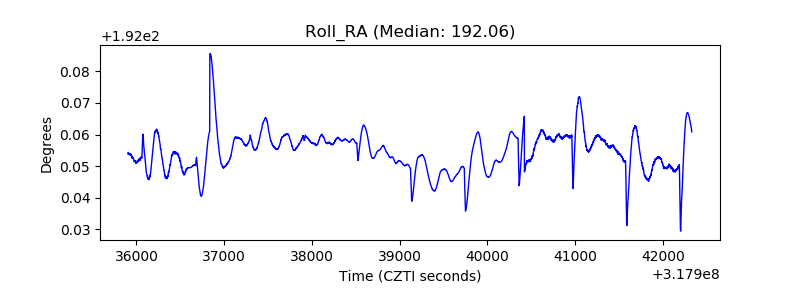 |
| Veto Counter | 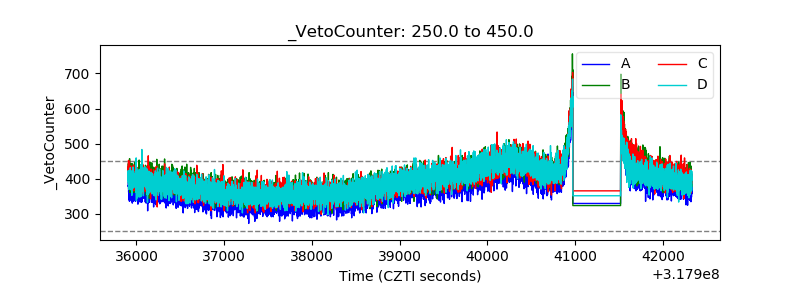 |