| Param | Original file | Final file |
|---|---|---|
| Filename | modeM0/AS1A07_148T02_9000003474cztM0_level2.fits | modeM0/AS1A07_148T02_9000003474cztM0_level2_quad_clean.evt |
| Size (bytes) | 383,762,880 | 375,978,240 |
| Size | 366.0 MB | 358.6 MB |
| Events in quadrant A | 2,387,006 | 2,422,428 |
| Events in quadrant B | 2,287,356 | 2,429,760 |
| Events in quadrant C | 2,342,876 | 2,346,291 |
| Events in quadrant D | 1,818,338 | 1,405,853 |
| Mode M9 | |||
|---|---|---|---|
| Quadrant | BADHDUFLAG | Total packets | Discarded packets |
| A | 0 | 110 | 0 |
| B | 0 | 111 | 0 |
| C | 0 | 111 | 0 |
| D | 0 | 111 | 0 |
| Mode M0 | |||
|---|---|---|---|
| Quadrant | BADHDUFLAG | Total packets | Discarded packets |
| A | 0 | 83408 | 0 |
| B | 0 | 88956 | 0 |
| C | 0 | 84251 | 0 |
| D | 0 | 173498 | 0 |
| Mode SS | |||
|---|---|---|---|
| Quadrant | BADHDUFLAG | Total packets | Discarded packets |
| A | 0 | 828 | 0 |
| B | 0 | 828 | 0 |
| C | 0 | 828 | 0 |
| D | 0 | 828 | 0 |
| Quadrant | Total seconds | Saturated seconds | Saturation percentage |
|---|---|---|---|
| A | 40520 | 344 | 0.848963% |
| B | 40499 | 745 | 1.839552% |
| C | 40508 | 512 | 1.263948% |
| D | 40492 | 10218 | 25.234614% |
Noise dominated data is calculated using 1-second bins in cleaned event files. If a bin has >2000 counts, and if more than 50% of those come from <1% of pixels, then it is considered to be noise-dominated and hence unusable.
| Quadrant | # 1 sec bins | Bins with >0 counts | Bins with >2000 counts | High rate bins dominated by noise | Noise dominated (total time) | Noise dominated (detector-on time) | Marked lightcurve |
|---|---|---|---|---|---|---|---|
| A | 44982 | 40517 | 0 | 0 | 0.00% | 0.00% | 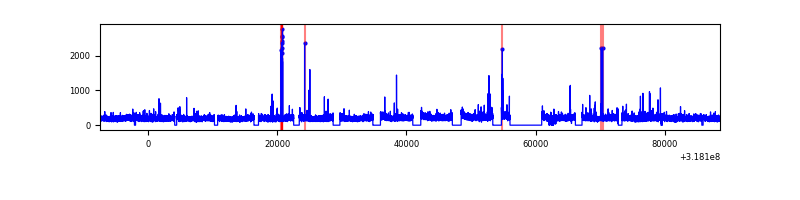 |
| B | 44982 | 40494 | 0 | 0 | 0.00% | 0.00% | 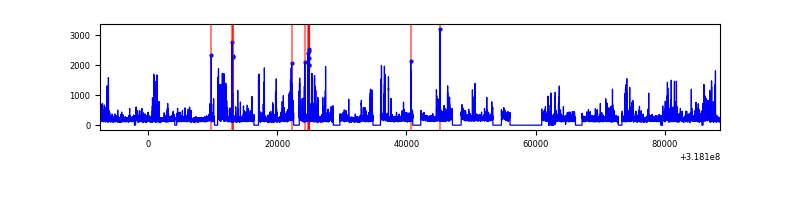 |
| C | 44982 | 40500 | 0 | 0 | 0.00% | 0.00% | 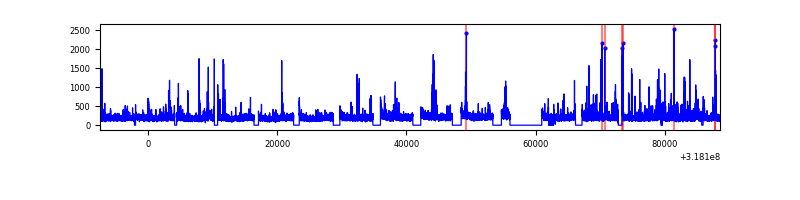 |
| D | 44982 | 40223 | 0 | 0 | 0.00% | 0.00% | 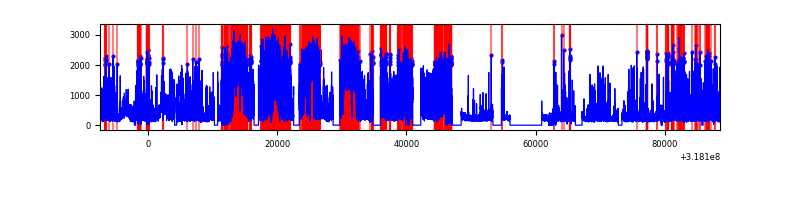 |
Top three noisy pixels from each quadrant. If the there are fewer than three noisy pixels in the level2.evt file, extra rows are filled as -1
| Pixel properties | Quadrant properties | ||||||
|---|---|---|---|---|---|---|---|
| Quadrant | DetID | PixID | Counts | Sigma | Mean | Median | Sigma |
| A | 0 | 29 | 2321 | 11.38 | 621 | 583 | 152.7 |
| A | 7 | 110 | 1937 | 8.87 | 621 | 583 | 152.7 |
| A | 0 | 30 | 1852 | 8.31 | 621 | 583 | 152.7 |
| B | 2 | 9 | 1884 | 10.83 | 603 | 573 | 121.0 |
| B | 2 | 8 | 1580 | 8.32 | 603 | 573 | 121.0 |
| B | 5 | 225 | 1521 | 7.83 | 603 | 573 | 121.0 |
| C | 3 | 126 | 1611 | 6.49 | 619 | 579 | 159.0 |
| C | 9 | 209 | 1566 | 6.21 | 619 | 579 | 159.0 |
| C | 3 | 235 | 1561 | 6.18 | 619 | 579 | 159.0 |
| D | 6 | 231 | 1315 | 5.97 | 519 | 474 | 140.9 |
| D | 3 | 14 | 1294 | 5.82 | 519 | 474 | 140.9 |
| D | 10 | 189 | 1262 | 5.59 | 519 | 474 | 140.9 |
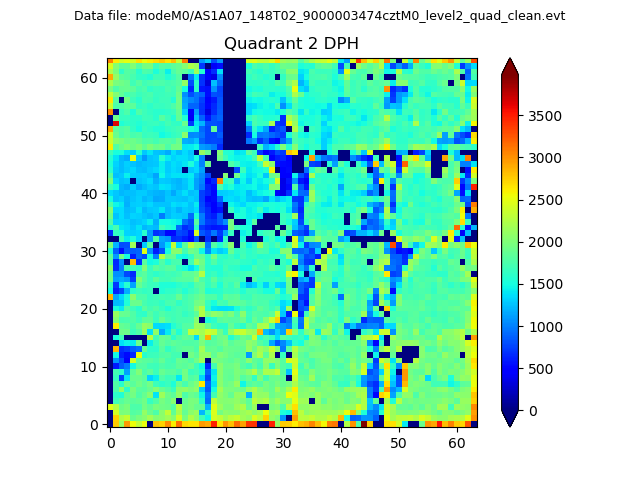
Histogram calculated using DETX and DETY for each event in the final _common_clean file
| Quadrant A | 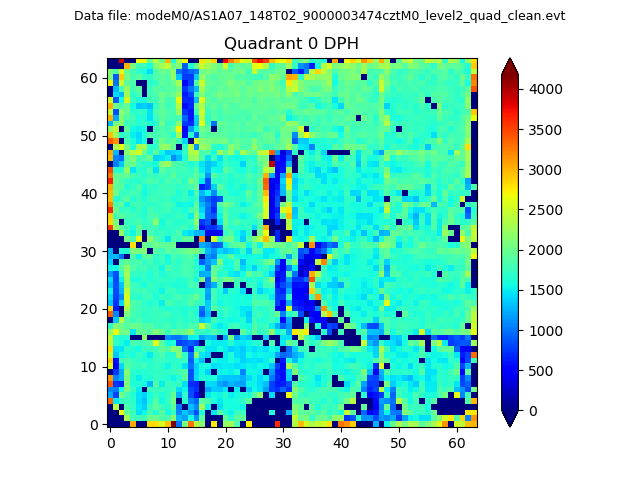 |
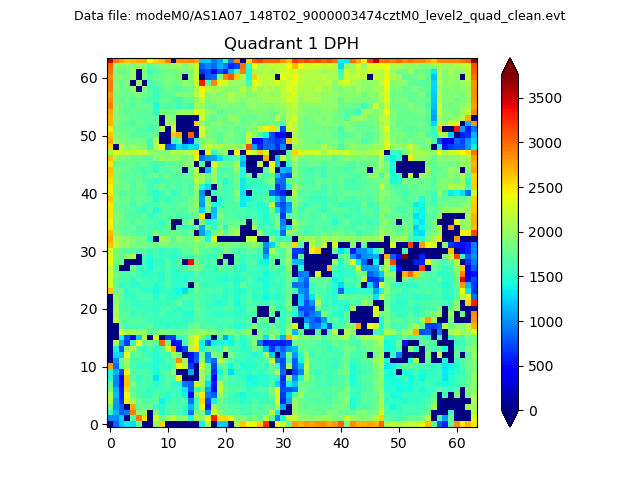 |
Quadrant B |
|---|---|---|---|
| Quadrant D | 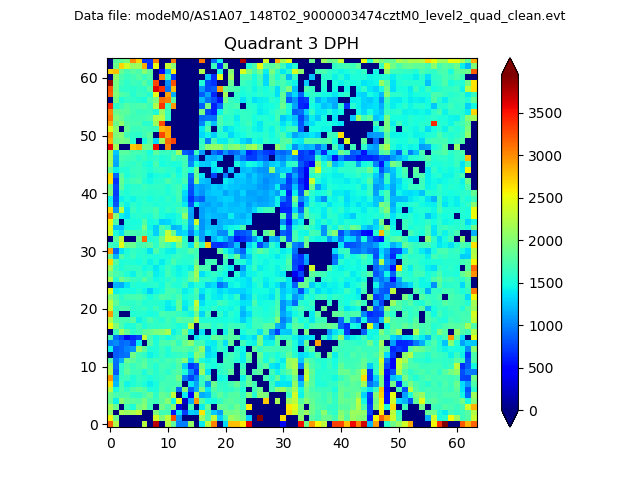 |
 |
Quadrant C |
| Plot type | Count rate plots | Images |
|---|---|---|
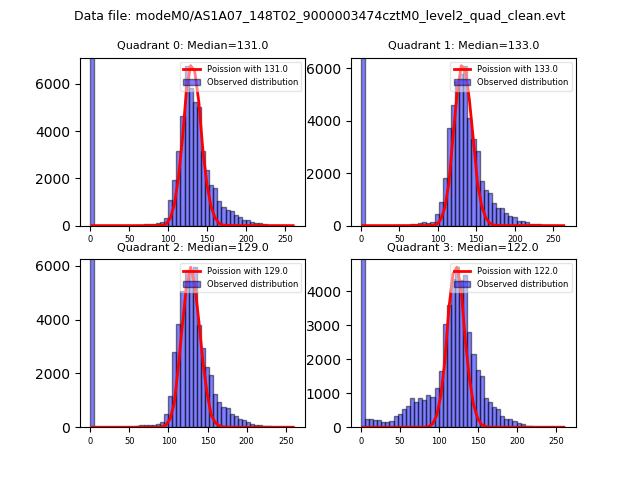
| Comparison with Poisson distribution Blue bars denote a histogram of data divided into 1 sec bins. Red curve is a Poisson curve with rate = median count rate of data. |
 |
 |
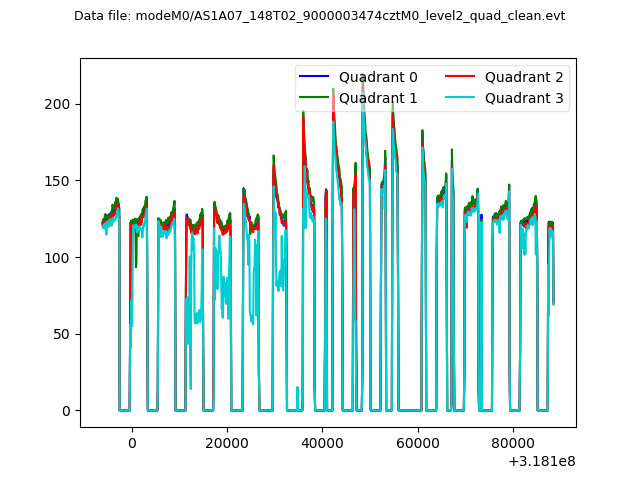
| Quadrant-wise count rates Data is divided into 100 sec bins |
 |
|
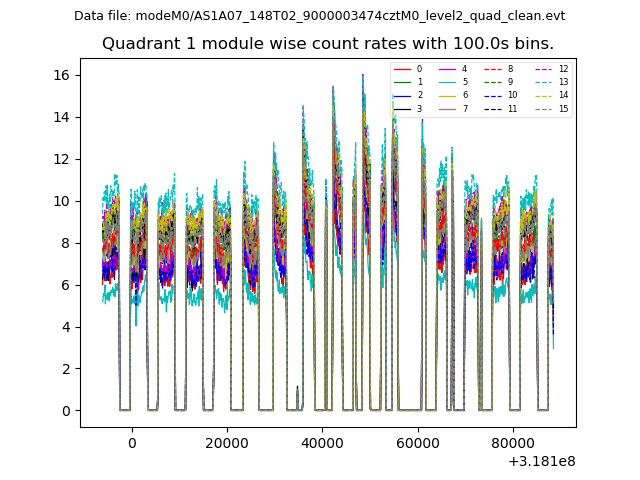
| Module-wise count rates for Quadrant A Data is divided into 100 sec bins |
 |
 |
| Module-wise count rates for Quadrant B Data is divided into 100 sec bins |
 |
 |
| Module-wise count rates for Quadrant C Data is divided into 100 sec bins |
 |
 |
| Module-wise count rates for Quadrant D Data is divided into 100 sec bins |
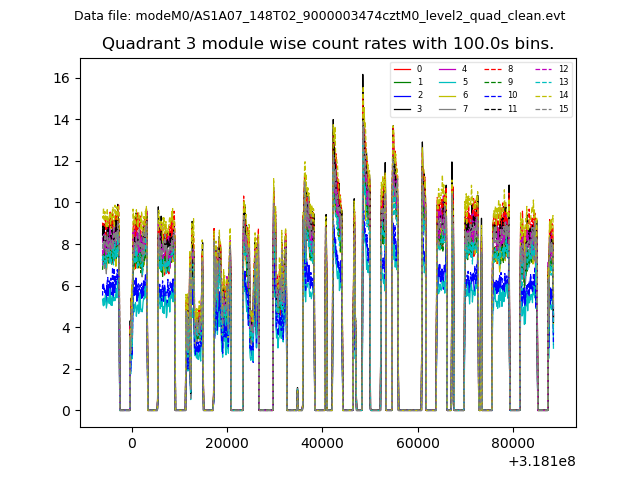 |
 |
| Parameter | Plot |
|---|---|
| CZT HV Monitor |  |
| D_VDD | 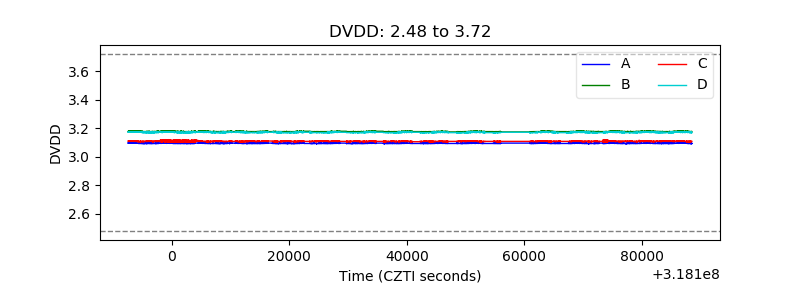 |
| Temperature 1 | 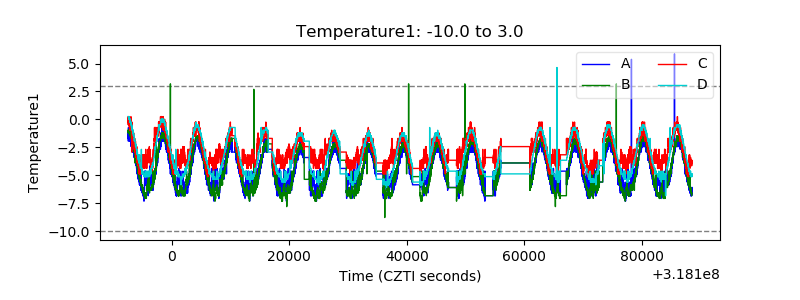 |
| Veto HV Monitor |  |
| Veto LLD | 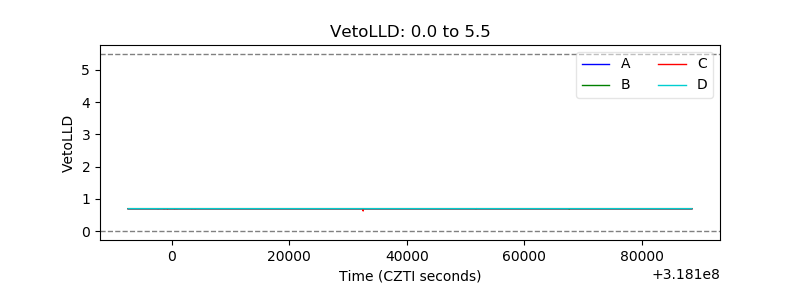 |
| Alpha Counter | 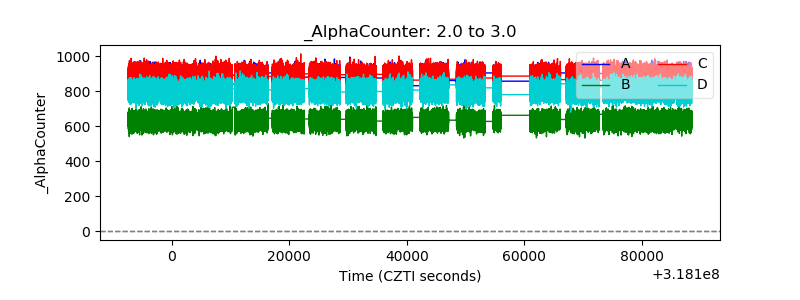 |
| _CPM_Rate | 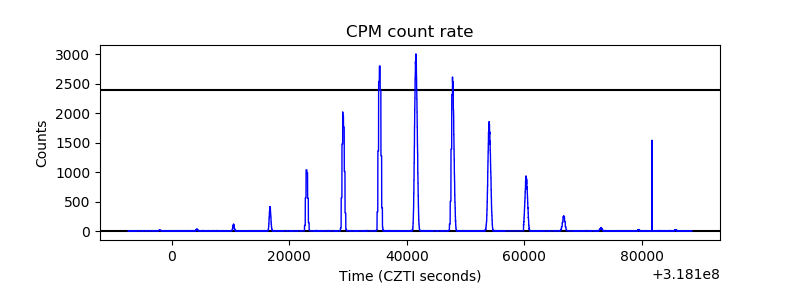 |
| CZT Counter | 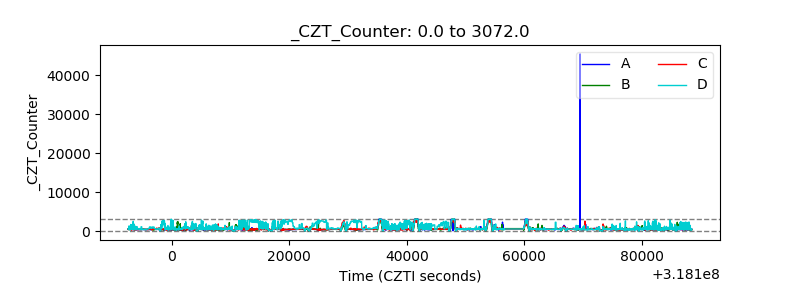 |
| +2.5 Volts monitor | 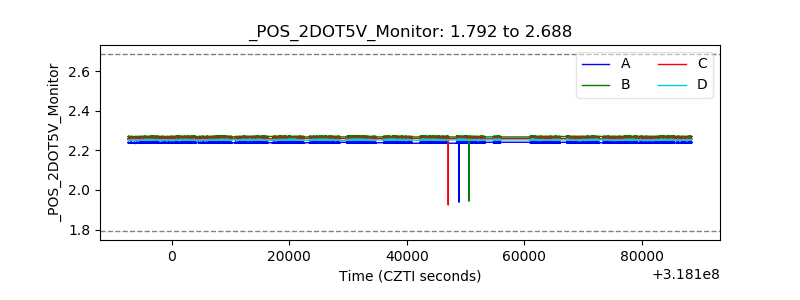 |
| +5 Volts monitor | 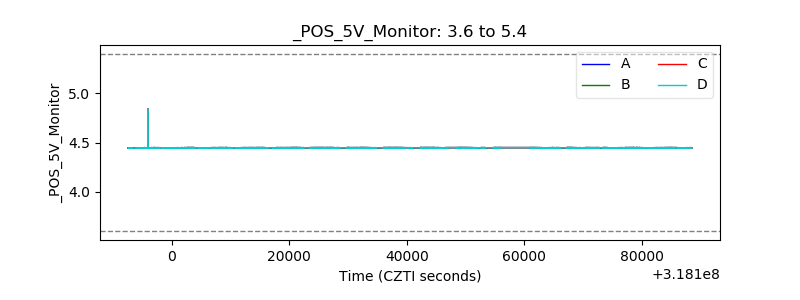 |
| _ROLL_ROT | 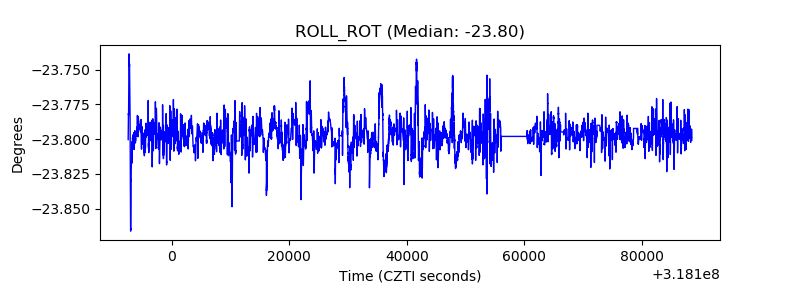 |
| _Roll_DEC | 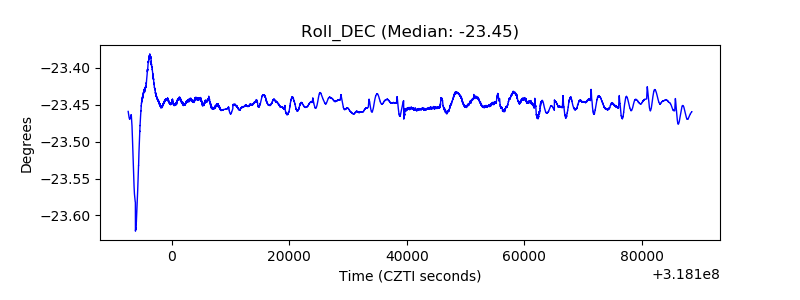 |
| _Roll_RA |  |
| Veto Counter |  |