| Param | Original file | Final file |
|---|---|---|
| Filename | modeM0/AS1A07_148T02_9000003474_23476cztM0_level2.evt | modeM0/AS1A07_148T02_9000003474_23476cztM0_level2_quad_clean.evt |
| Size (bytes) | 570,504,960 | 88,873,920 |
| Size | 544.1 MB | 84.8 MB |
| Events in quadrant A | 3,033,831 | 576,195 |
| Events in quadrant B | 3,153,760 | 592,626 |
| Events in quadrant C | 3,151,118 | 574,711 |
| Events in quadrant D | 7,534,430 | 530,263 |
| Mode M9 | |||
|---|---|---|---|
| Quadrant | BADHDUFLAG | Total packets | Discarded packets |
| A | 0 | 13 | 0 |
| B | 0 | 13 | 0 |
| C | 0 | 13 | 0 |
| D | 0 | 13 | 0 |
| Mode M0 | |||
|---|---|---|---|
| Quadrant | BADHDUFLAG | Total packets | Discarded packets |
| A | 0 | 12515 | 1 |
| B | 0 | 12931 | 1 |
| C | 0 | 12775 | 1 |
| D | 0 | 26415 | 1 |
| Mode SS | |||
|---|---|---|---|
| Quadrant | BADHDUFLAG | Total packets | Discarded packets |
| A | 0 | 120 | 0 |
| B | 0 | 120 | 0 |
| C | 0 | 120 | 0 |
| D | 0 | 120 | 0 |
| Quadrant | Total seconds | Saturated seconds | Saturation percentage |
|---|---|---|---|
| A | 5982 | 41 | 0.685390% |
| B | 5982 | 57 | 0.952859% |
| C | 5983 | 57 | 0.952699% |
| D | 5983 | 1082 | 18.084573% |
Noise dominated data is calculated using 1-second bins in cleaned event files. If a bin has >2000 counts, and if more than 50% of those come from <1% of pixels, then it is considered to be noise-dominated and hence unusable.
| Quadrant | # 1 sec bins | Bins with >0 counts | Bins with >2000 counts | High rate bins dominated by noise | Noise dominated (total time) | Noise dominated (detector-on time) | Marked lightcurve |
|---|---|---|---|---|---|---|---|
| A | 7227 | 5982 | 1 | 1 | 0.01% | 0.02% | 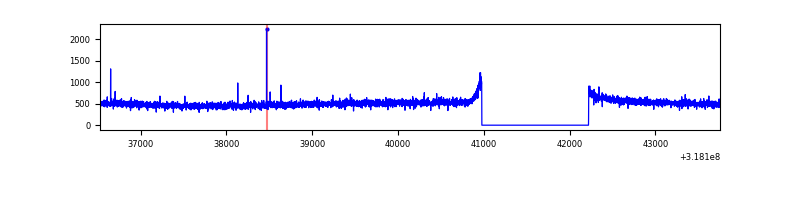 |
| B | 7227 | 5982 | 7 | 7 | 0.10% | 0.12% | 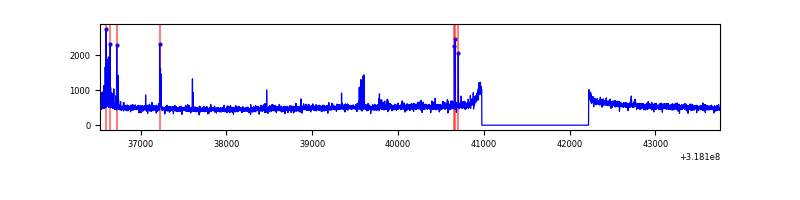 |
| C | 7228 | 5983 | 0 | 0 | 0.00% | 0.00% | 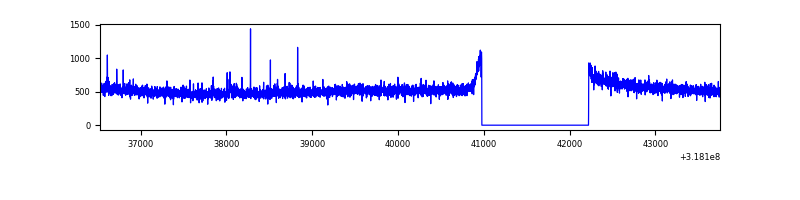 |
| D | 7228 | 5983 | 968 | 968 | 13.39% | 16.18% | 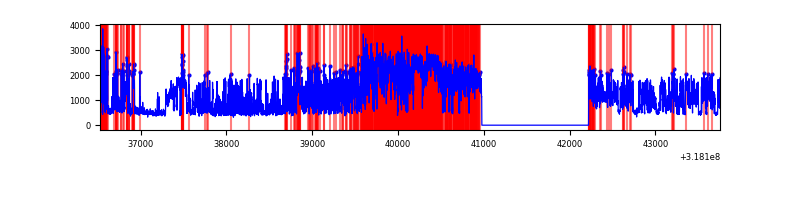 |
Top three noisy pixels from each quadrant. If the there are fewer than three noisy pixels in the level2.evt file, extra rows are filled as -1
| Pixel properties | Quadrant properties | ||||||
|---|---|---|---|---|---|---|---|
| Quadrant | DetID | PixID | Counts | Sigma | Mean | Median | Sigma |
| A | 13 | 254 | 9620 | 56.22 | 786 | 769 | 157.4 |
| A | 0 | 226 | 6768 | 38.11 | 786 | 769 | 157.4 |
| A | 3 | 137 | 6482 | 36.29 | 786 | 769 | 157.4 |
| B | 0 | 189 | 79402 | 534.73 | 780 | 763 | 147.1 |
| B | 12 | 111 | 17096 | 111.06 | 780 | 763 | 147.1 |
| B | 11 | 111 | 15083 | 97.37 | 780 | 763 | 147.1 |
| C | 14 | 238 | 121166 | 674.57 | 767 | 775 | 178.5 |
| C | 7 | 247 | 28387 | 154.71 | 767 | 775 | 178.5 |
| C | 2 | 16 | 7328 | 36.72 | 767 | 775 | 178.5 |
| D | 7 | 238 | 3268240 | 18999.93 | 709 | 692 | 172.0 |
| D | 1 | 52 | 1571961 | 9136.51 | 709 | 692 | 172.0 |
| D | 2 | 234 | 20819 | 117.03 | 709 | 692 | 172.0 |
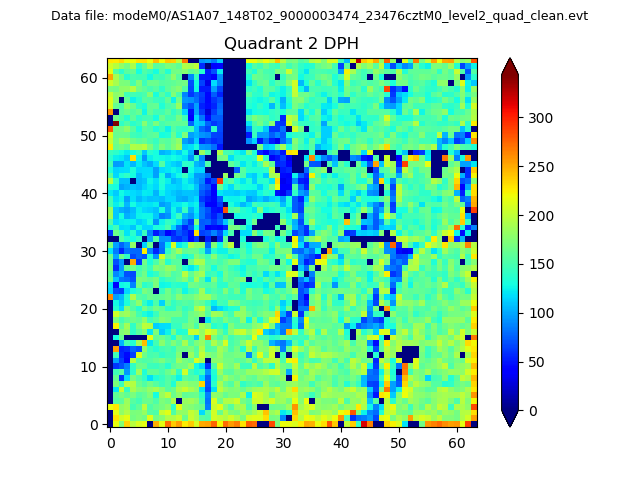
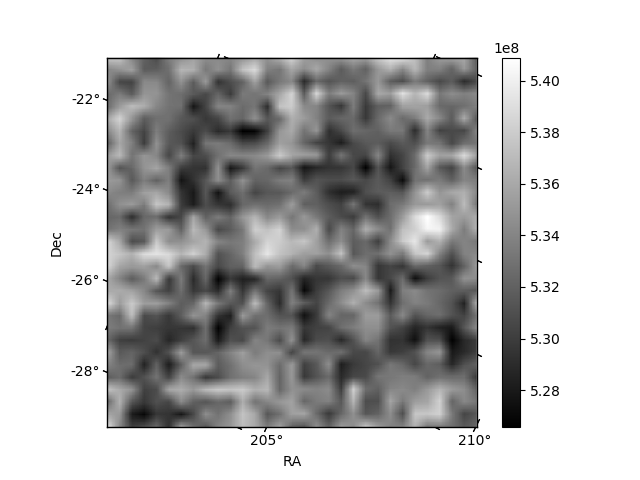
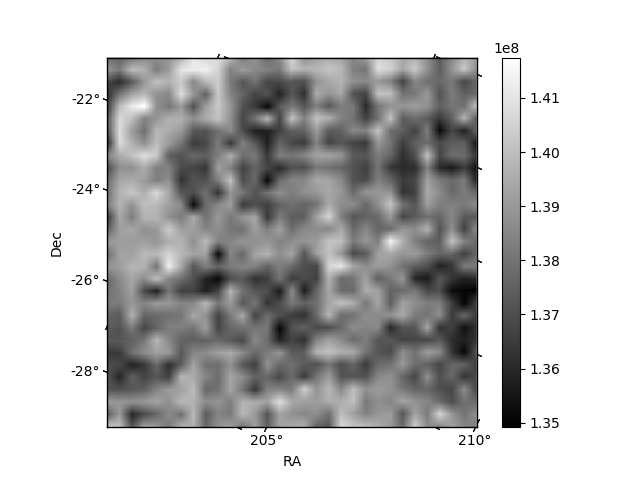
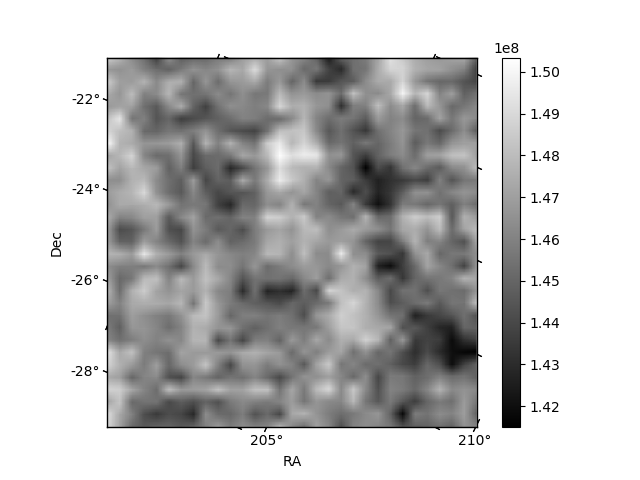
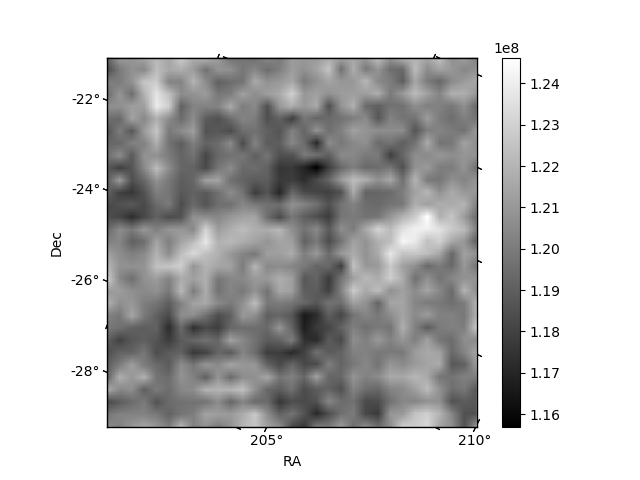
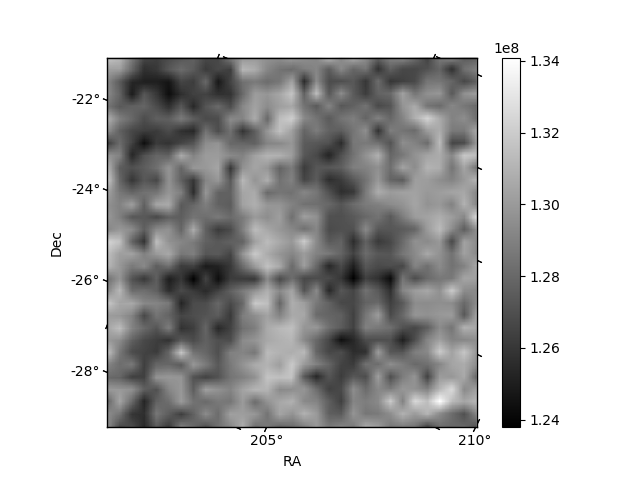
Histogram calculated using DETX and DETY for each event in the final _common_clean file
| Quadrant A | 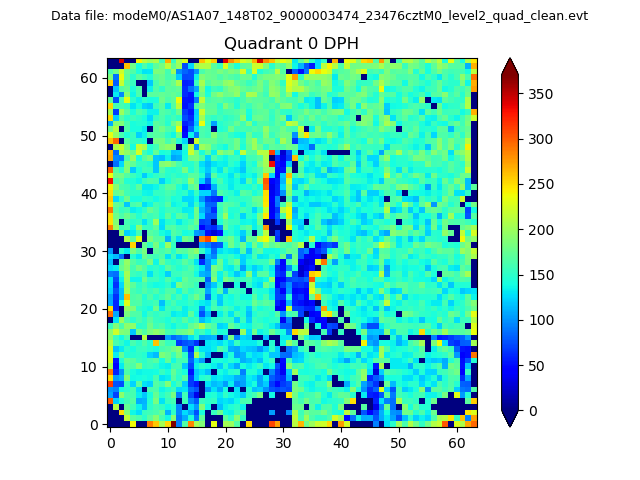 |
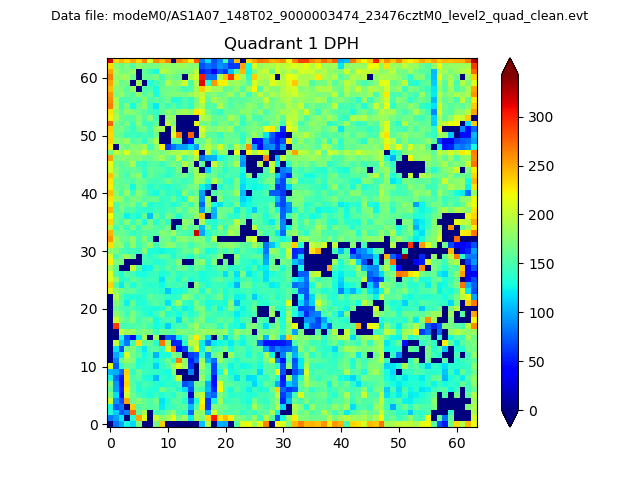 |
Quadrant B |
|---|---|---|---|
| Quadrant D | 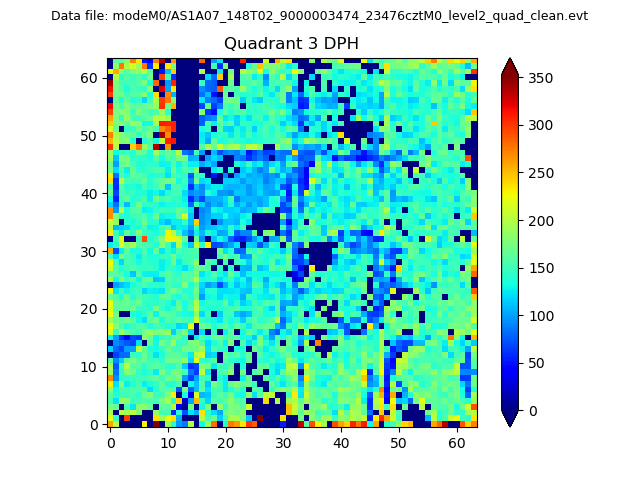 |
 |
Quadrant C |
| Plot type | Count rate plots | Images |
|---|---|---|
| Comparison with Poisson distribution Blue bars denote a histogram of data divided into 1 sec bins. Red curve is a Poisson curve with rate = median count rate of data. |
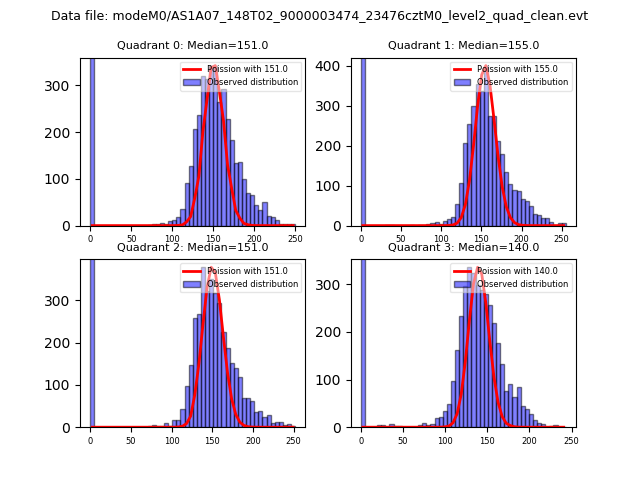 |
 |
| Quadrant-wise count rates Data is divided into 100 sec bins |
 |
|
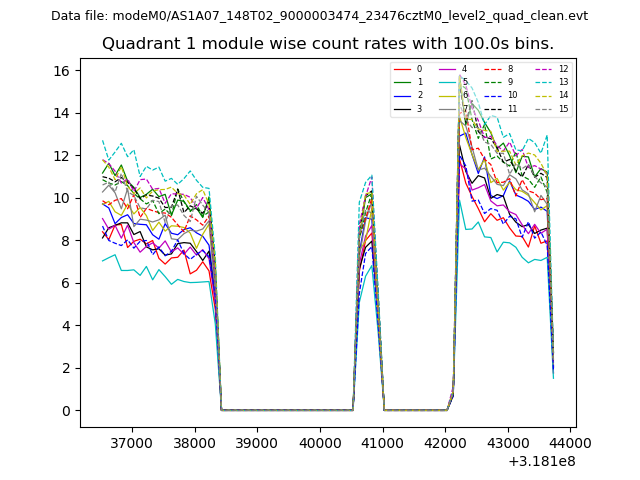
| Module-wise count rates for Quadrant A Data is divided into 100 sec bins |
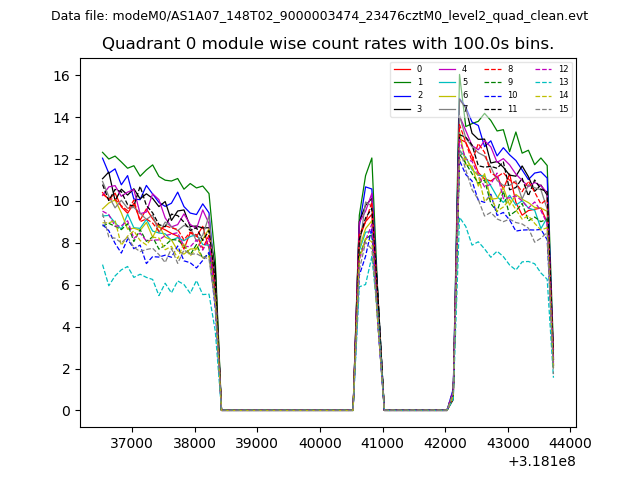 |
 |
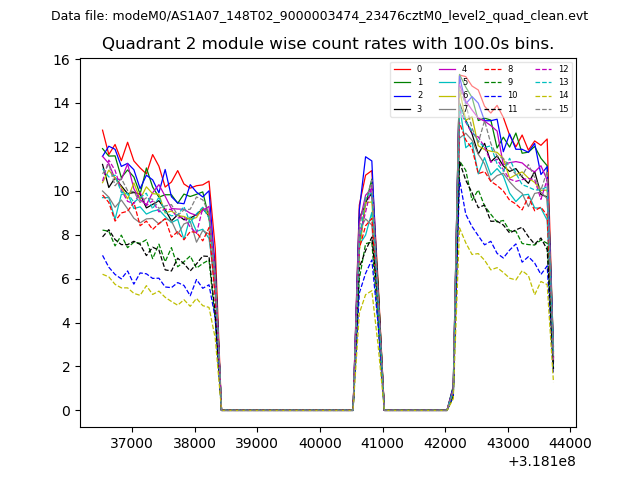
| Module-wise count rates for Quadrant B Data is divided into 100 sec bins |
 |
 |
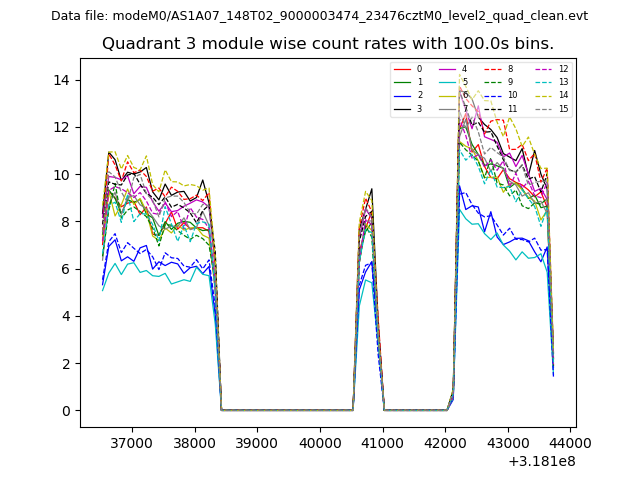
| Module-wise count rates for Quadrant C Data is divided into 100 sec bins |
 |
 |
| Module-wise count rates for Quadrant D Data is divided into 100 sec bins |
 |
 |
| Parameter | Plot |
|---|---|
| CZT HV Monitor | 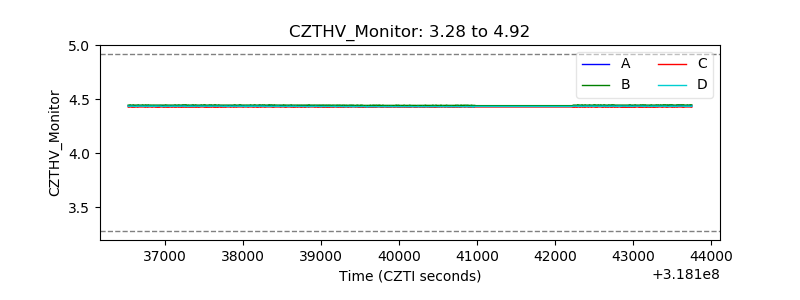 |
| D_VDD | 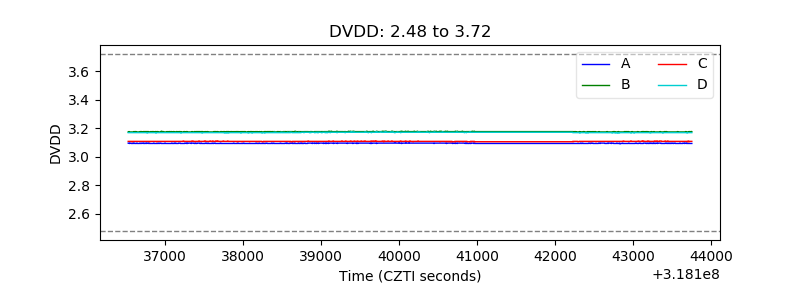 |
| Temperature 1 | 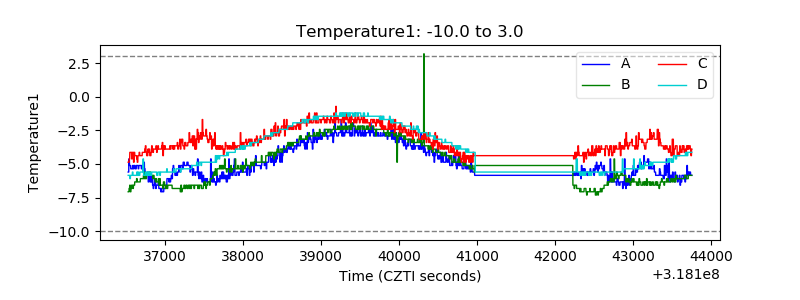 |
| Veto HV Monitor | 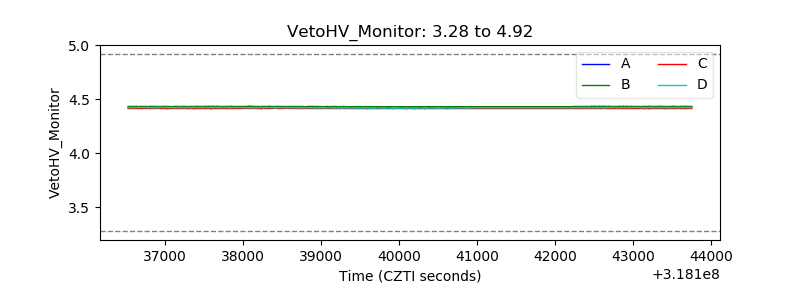 |
| Veto LLD | 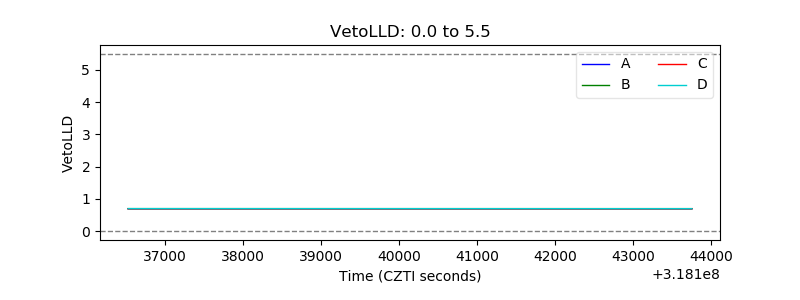 |
| Alpha Counter | 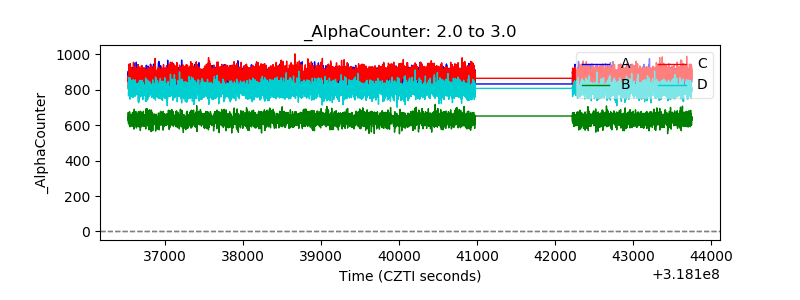 |
| _CPM_Rate | 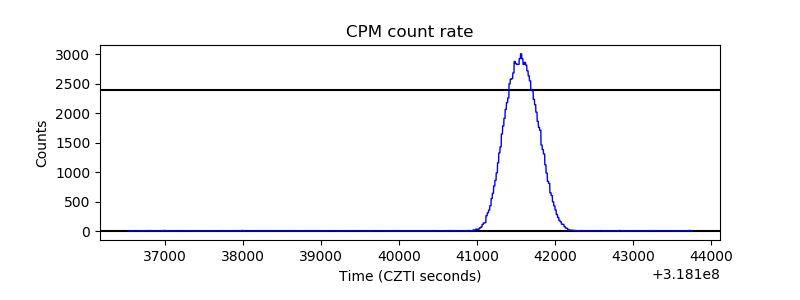 |
| CZT Counter | 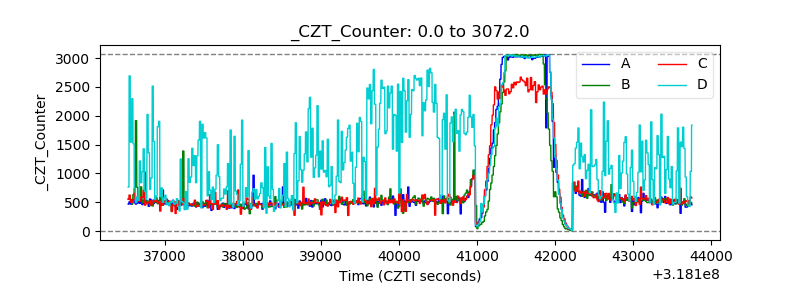 |
| +2.5 Volts monitor |  |
| +5 Volts monitor | 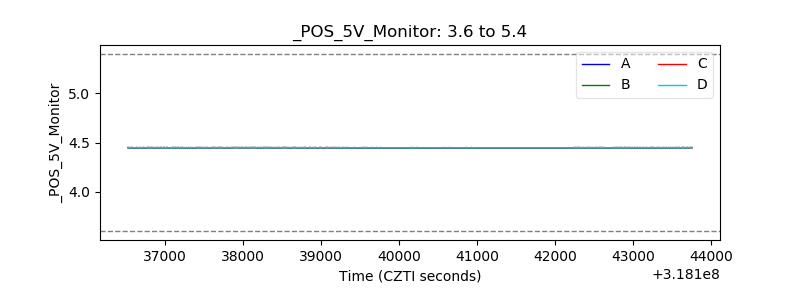 |
| _ROLL_ROT | 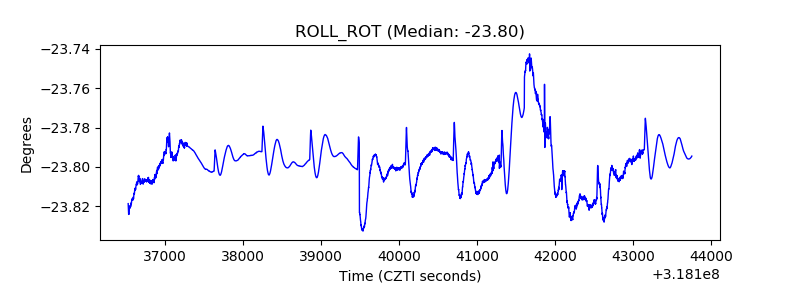 |
| _Roll_DEC | 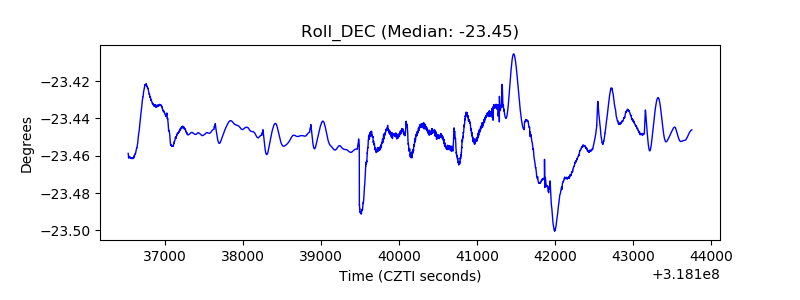 |
| _Roll_RA | 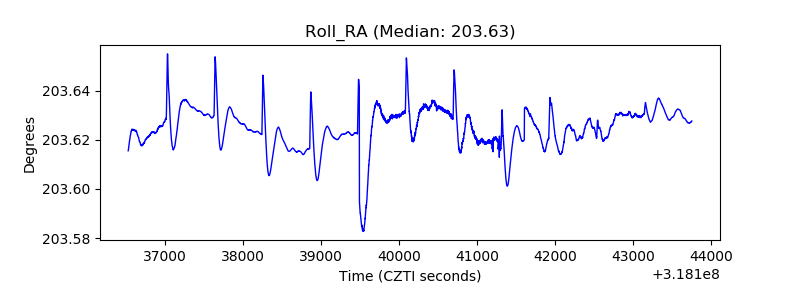 |
| Veto Counter | 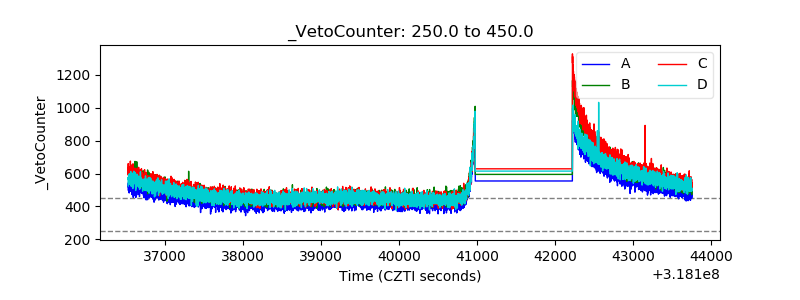 |