| Param | Original file | Final file |
|---|---|---|
| Filename | modeM0/AS1A07_148T02_9000003474_23477cztM0_level2.evt | modeM0/AS1A07_148T02_9000003474_23477cztM0_level2_quad_clean.evt |
| Size (bytes) | 605,329,920 | 100,085,760 |
| Size | 577.3 MB | 95.4 MB |
| Events in quadrant A | 3,309,594 | 667,342 |
| Events in quadrant B | 3,474,148 | 681,202 |
| Events in quadrant C | 3,528,743 | 656,647 |
| Events in quadrant D | 7,600,980 | 593,201 |
| Mode M9 | |||
|---|---|---|---|
| Quadrant | BADHDUFLAG | Total packets | Discarded packets |
| A | 0 | 16 | 0 |
| B | 0 | 17 | 0 |
| C | 0 | 17 | 0 |
| D | 0 | 17 | 0 |
| Mode M0 | |||
|---|---|---|---|
| Quadrant | BADHDUFLAG | Total packets | Discarded packets |
| A | 0 | 13397 | 2 |
| B | 0 | 14034 | 2 |
| C | 0 | 14220 | 2 |
| D | 0 | 26713 | 2 |
| Mode SS | |||
|---|---|---|---|
| Quadrant | BADHDUFLAG | Total packets | Discarded packets |
| A | 0 | 126 | 0 |
| B | 0 | 126 | 0 |
| C | 0 | 126 | 0 |
| D | 0 | 126 | 0 |
| Quadrant | Total seconds | Saturated seconds | Saturation percentage |
|---|---|---|---|
| A | 6197 | 12 | 0.193642% |
| B | 6197 | 44 | 0.710021% |
| C | 6196 | 73 | 1.178179% |
| D | 6196 | 1071 | 17.285345% |
Noise dominated data is calculated using 1-second bins in cleaned event files. If a bin has >2000 counts, and if more than 50% of those come from <1% of pixels, then it is considered to be noise-dominated and hence unusable.
| Quadrant | # 1 sec bins | Bins with >0 counts | Bins with >2000 counts | High rate bins dominated by noise | Noise dominated (total time) | Noise dominated (detector-on time) | Marked lightcurve |
|---|---|---|---|---|---|---|---|
| A | 7557 | 6198 | 0 | 0 | 0.00% | 0.00% | 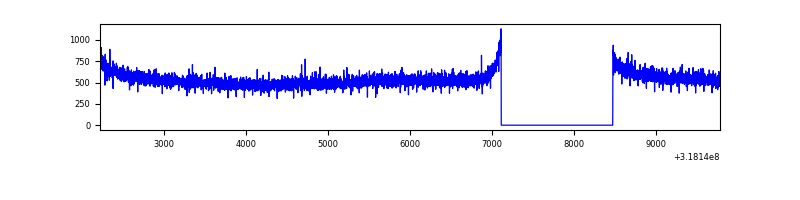 |
| B | 7557 | 6198 | 5 | 5 | 0.07% | 0.08% | 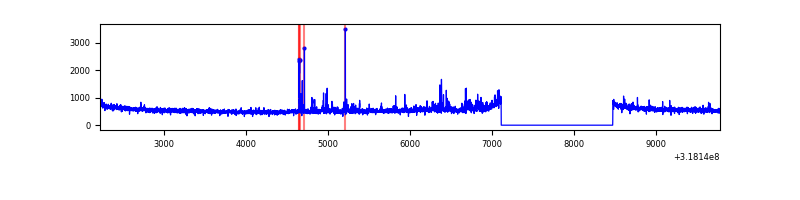 |
| C | 7556 | 6197 | 6 | 6 | 0.08% | 0.10% | 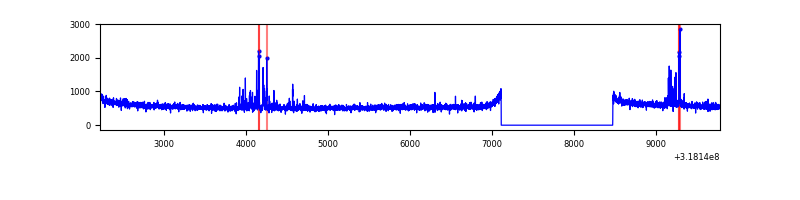 |
| D | 7556 | 6197 | 971 | 971 | 12.85% | 15.67% | 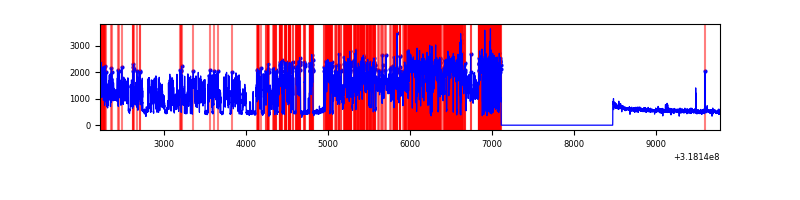 |
Top three noisy pixels from each quadrant. If the there are fewer than three noisy pixels in the level2.evt file, extra rows are filled as -1
| Pixel properties | Quadrant properties | ||||||
|---|---|---|---|---|---|---|---|
| Quadrant | DetID | PixID | Counts | Sigma | Mean | Median | Sigma |
| A | 13 | 254 | 10415 | 56.81 | 857 | 841 | 168.5 |
| A | 0 | 226 | 7613 | 40.18 | 857 | 841 | 168.5 |
| A | 3 | 137 | 6767 | 35.16 | 857 | 841 | 168.5 |
| B | 0 | 189 | 95877 | 604.09 | 850 | 831 | 157.3 |
| B | 0 | 230 | 47643 | 297.52 | 850 | 831 | 157.3 |
| B | 12 | 111 | 18103 | 109.78 | 850 | 831 | 157.3 |
| C | 14 | 238 | 134531 | 686.52 | 838 | 847 | 194.7 |
| C | 7 | 247 | 112801 | 574.92 | 838 | 847 | 194.7 |
| C | 10 | 9 | 8390 | 38.73 | 838 | 847 | 194.7 |
| D | 7 | 238 | 4577354 | 24530.97 | 777 | 758 | 186.6 |
| D | 1 | 52 | 57424 | 303.73 | 777 | 758 | 186.6 |
| D | 2 | 234 | 21979 | 113.75 | 777 | 758 | 186.6 |
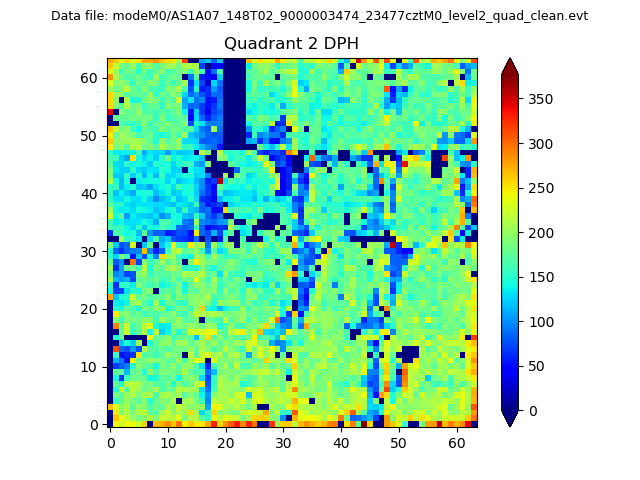
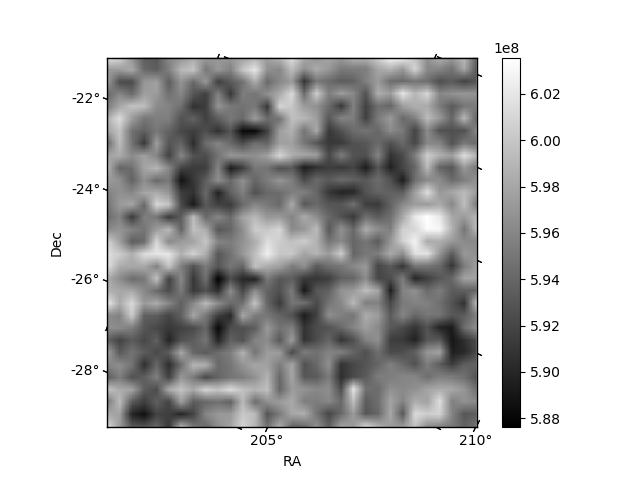
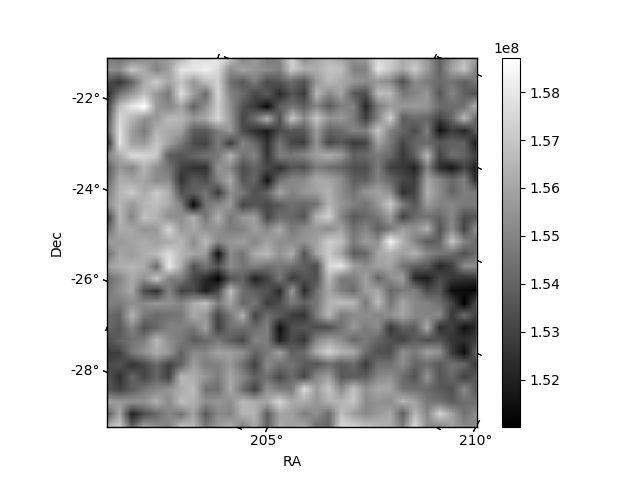
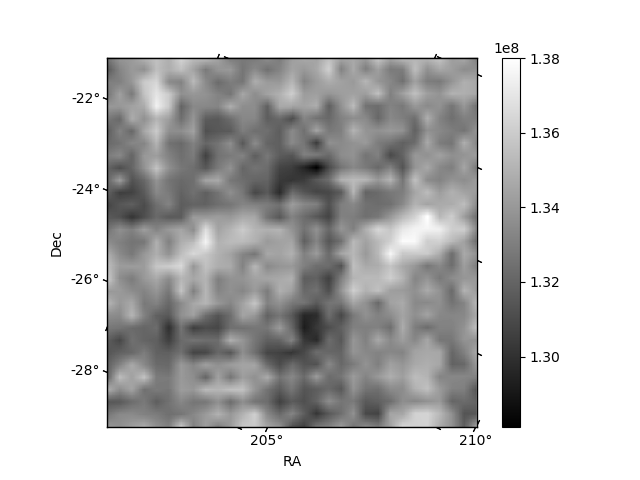
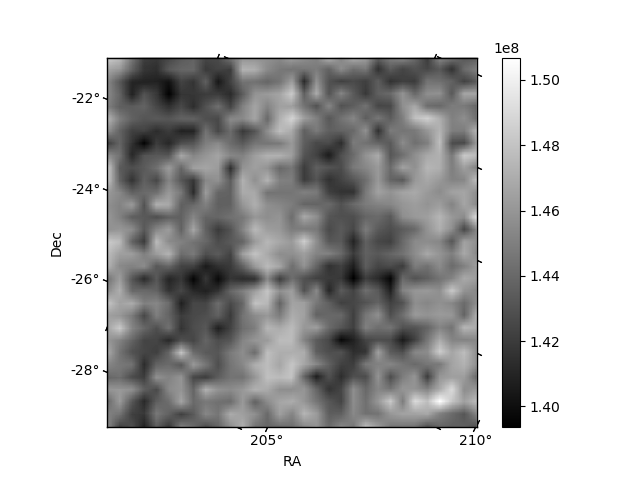
Histogram calculated using DETX and DETY for each event in the final _common_clean file
| Quadrant A | 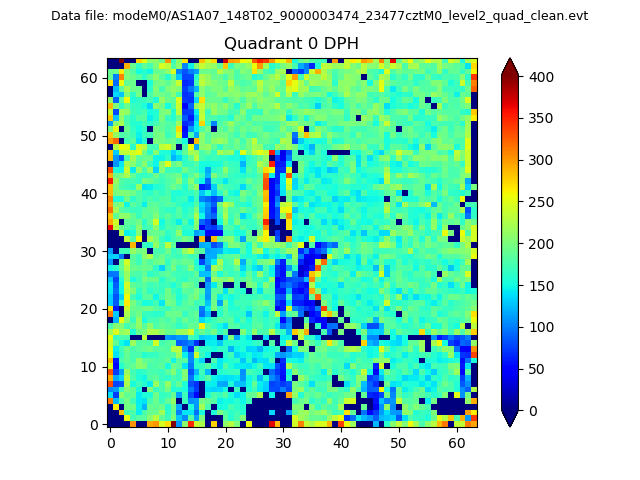 |
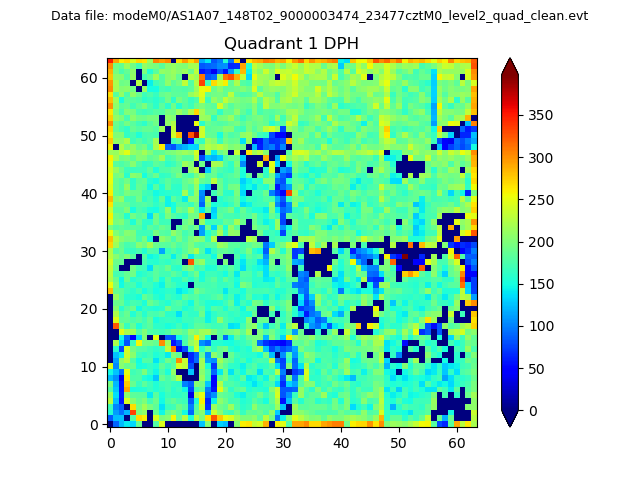 |
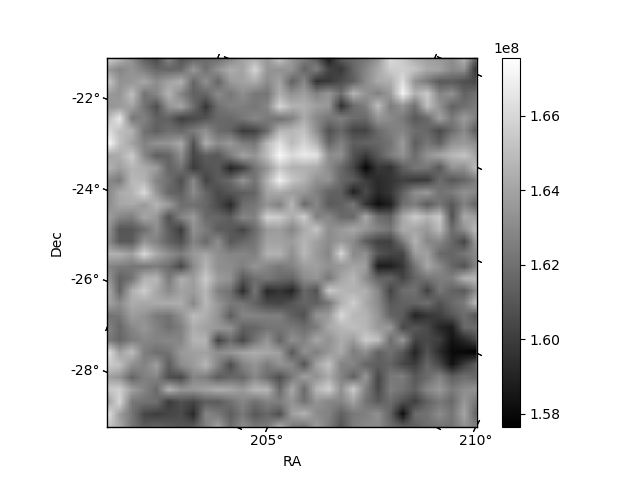
Quadrant B |
|---|---|---|---|
| Quadrant D | 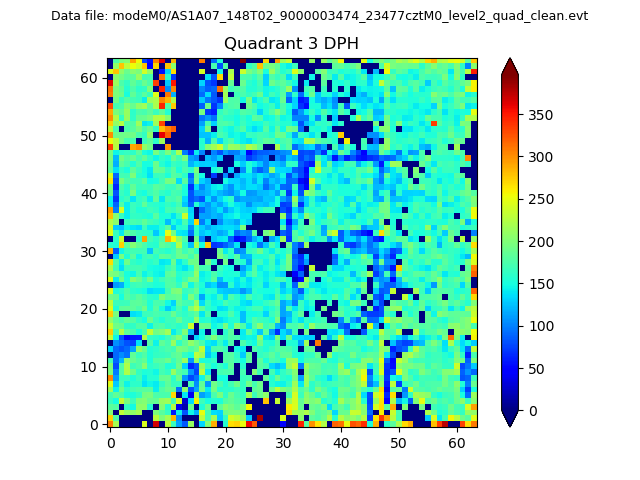 |
 |
Quadrant C |
| Plot type | Count rate plots | Images |
|---|---|---|
| Comparison with Poisson distribution Blue bars denote a histogram of data divided into 1 sec bins. Red curve is a Poisson curve with rate = median count rate of data. |
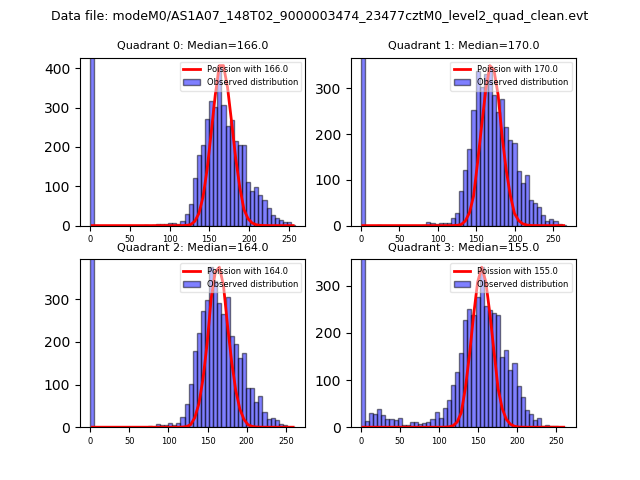 |
 |
| Quadrant-wise count rates Data is divided into 100 sec bins |
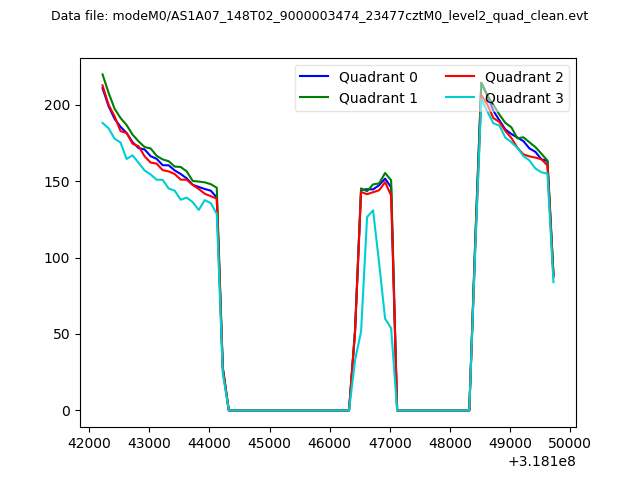 |
|
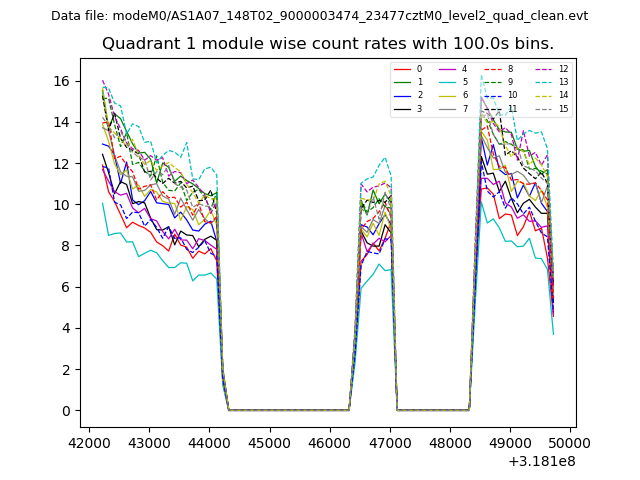
| Module-wise count rates for Quadrant A Data is divided into 100 sec bins |
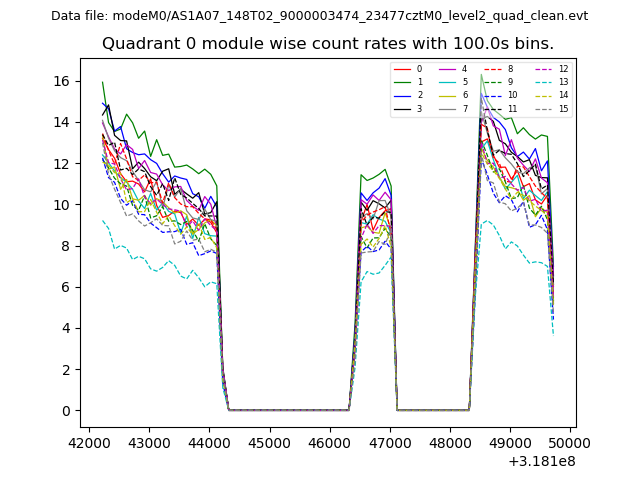 |
 |
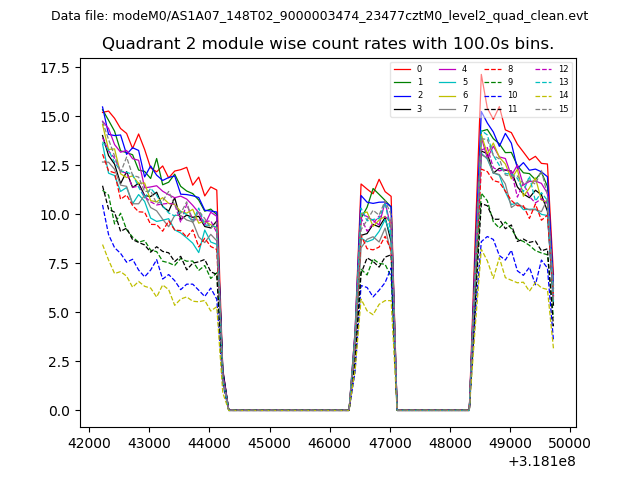
| Module-wise count rates for Quadrant B Data is divided into 100 sec bins |
 |
 |
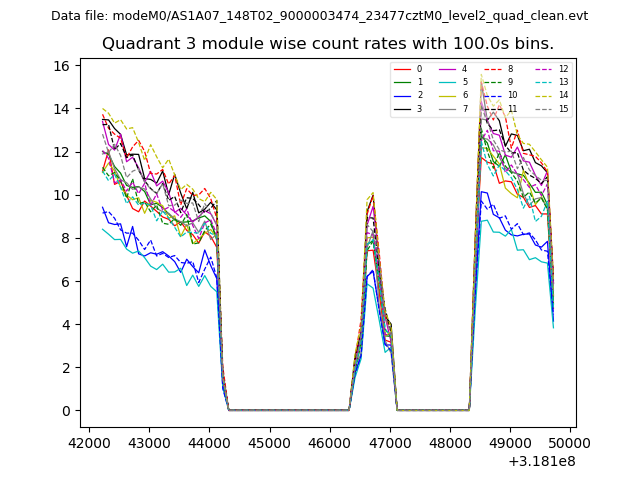
| Module-wise count rates for Quadrant C Data is divided into 100 sec bins |
 |
 |
| Module-wise count rates for Quadrant D Data is divided into 100 sec bins |
 |
 |
| Parameter | Plot |
|---|---|
| CZT HV Monitor | 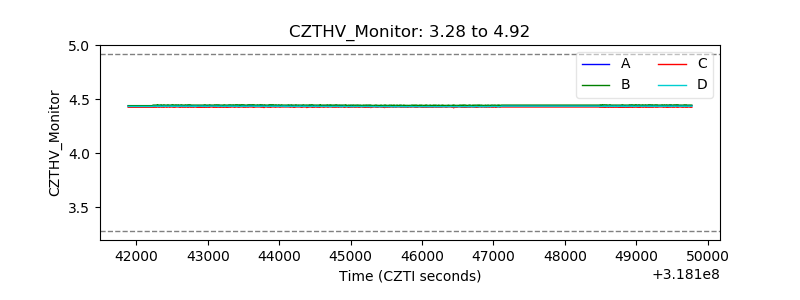 |
| D_VDD | 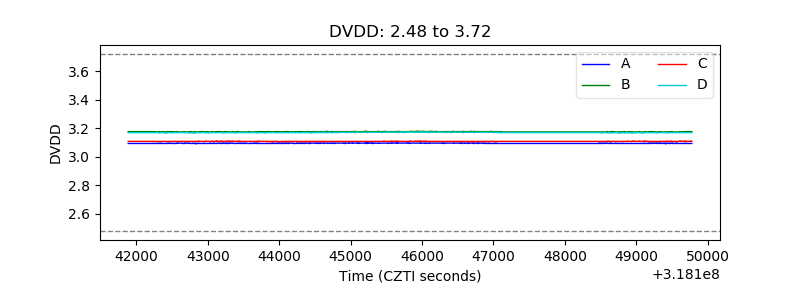 |
| Temperature 1 | 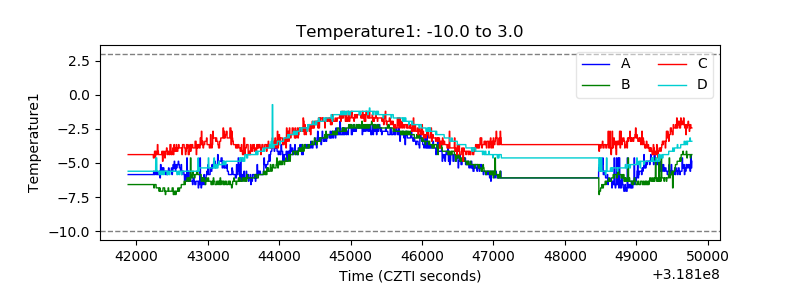 |
| Veto HV Monitor | 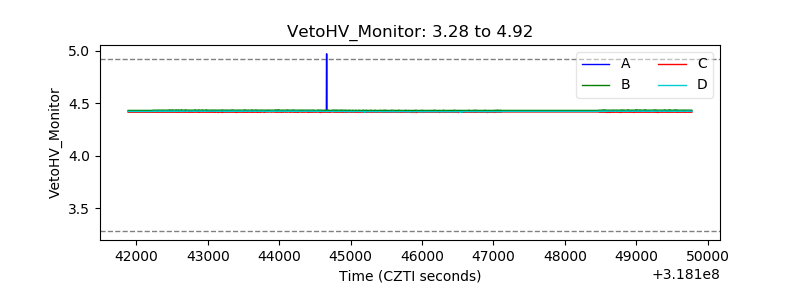 |
| Veto LLD | 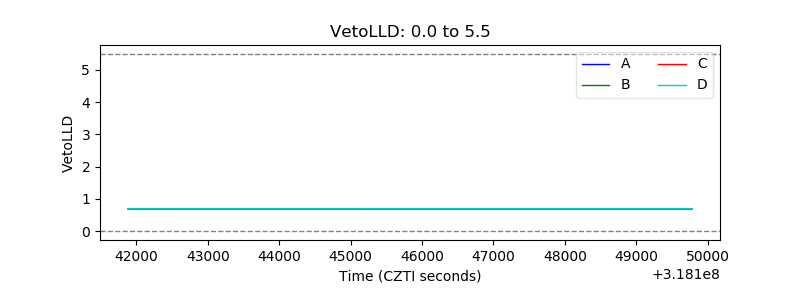 |
| Alpha Counter | 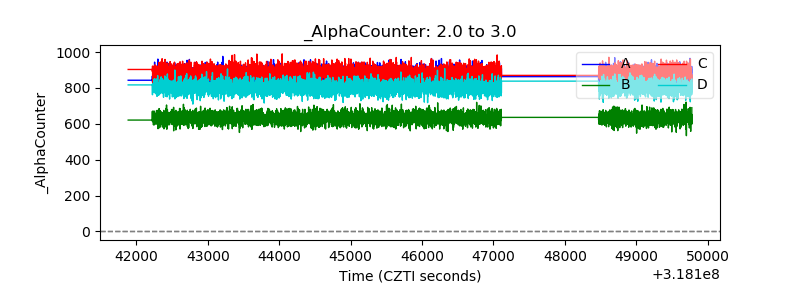 |
| _CPM_Rate | 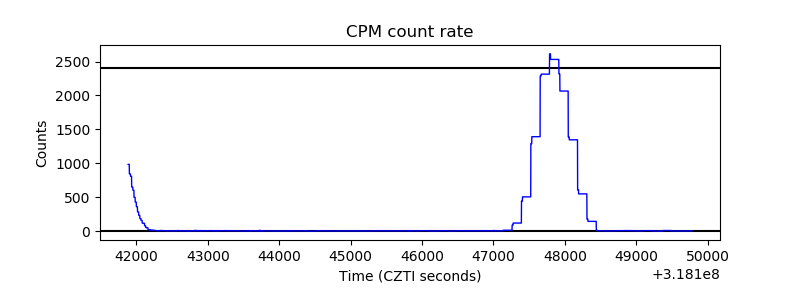 |
| CZT Counter | 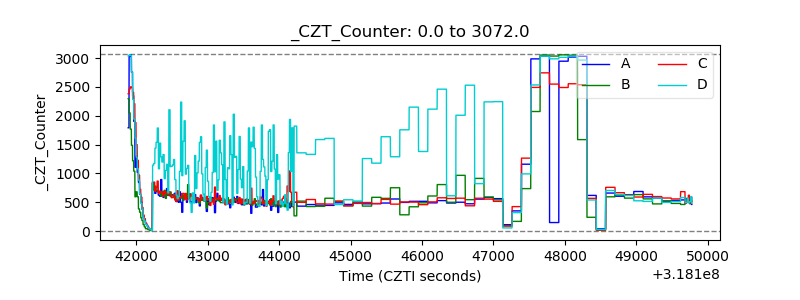 |
| +2.5 Volts monitor |  |
| +5 Volts monitor |  |
| _ROLL_ROT | 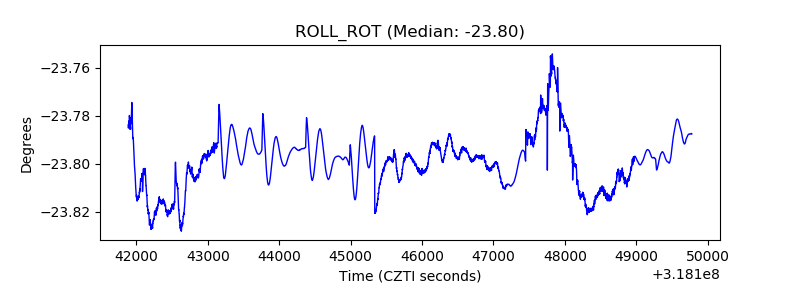 |
| _Roll_DEC | 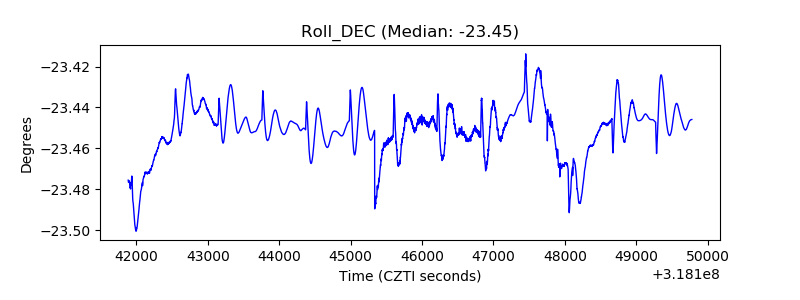 |
| _Roll_RA | 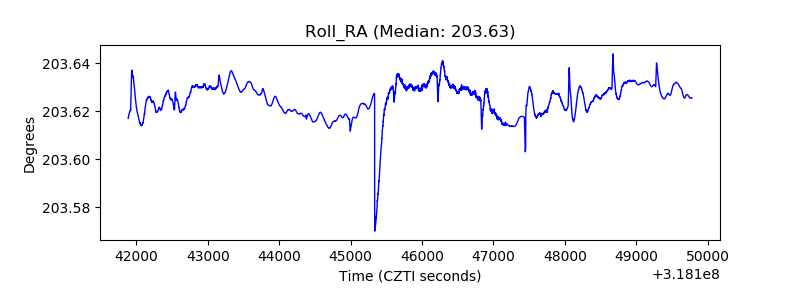 |
| Veto Counter | 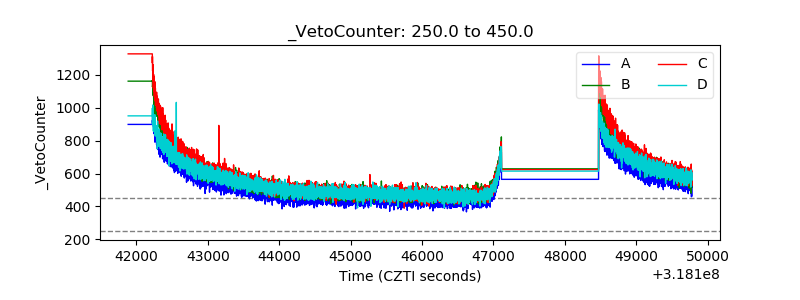 |