| Param | Original file | Final file |
|---|---|---|
| Filename | modeM0/AS1A07_148T02_9000003474_23478cztM0_level2.evt | modeM0/AS1A07_148T02_9000003474_23478cztM0_level2_quad_clean.evt |
| Size (bytes) | 469,992,960 | 97,853,760 |
| Size | 448.2 MB | 93.3 MB |
| Events in quadrant A | 3,391,352 | 642,634 |
| Events in quadrant B | 3,442,921 | 652,782 |
| Events in quadrant C | 3,515,608 | 629,146 |
| Events in quadrant D | 3,467,772 | 611,053 |
| Mode M9 | |||
|---|---|---|---|
| Quadrant | BADHDUFLAG | Total packets | Discarded packets |
| A | 0 | 14 | 0 |
| B | 0 | 14 | 0 |
| C | 0 | 14 | 0 |
| D | 0 | 14 | 0 |
| Mode M0 | |||
|---|---|---|---|
| Quadrant | BADHDUFLAG | Total packets | Discarded packets |
| A | 0 | 13535 | 1 |
| B | 0 | 13829 | 1 |
| C | 0 | 14173 | 1 |
| D | 0 | 13765 | 1 |
| Mode SS | |||
|---|---|---|---|
| Quadrant | BADHDUFLAG | Total packets | Discarded packets |
| A | 0 | 124 | 0 |
| B | 0 | 124 | 0 |
| C | 0 | 124 | 0 |
| D | 0 | 124 | 0 |
| Quadrant | Total seconds | Saturated seconds | Saturation percentage |
|---|---|---|---|
| A | 6132 | 79 | 1.288324% |
| B | 6133 | 81 | 1.320724% |
| C | 6133 | 127 | 2.070765% |
| D | 6133 | 109 | 1.777271% |
Noise dominated data is calculated using 1-second bins in cleaned event files. If a bin has >2000 counts, and if more than 50% of those come from <1% of pixels, then it is considered to be noise-dominated and hence unusable.
| Quadrant | # 1 sec bins | Bins with >0 counts | Bins with >2000 counts | High rate bins dominated by noise | Noise dominated (total time) | Noise dominated (detector-on time) | Marked lightcurve |
|---|---|---|---|---|---|---|---|
| A | 7467 | 6132 | 3 | 3 | 0.04% | 0.05% | 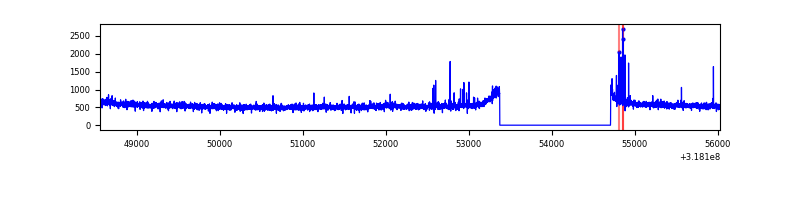 |
| B | 7468 | 6133 | 1 | 1 | 0.01% | 0.02% | 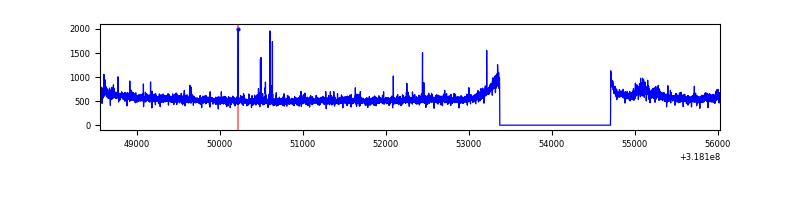 |
| C | 7468 | 6133 | 3 | 3 | 0.04% | 0.05% | 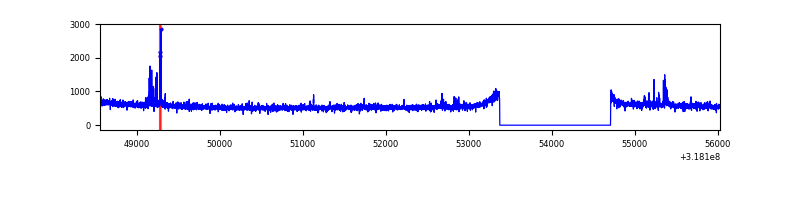 |
| D | 7468 | 6133 | 35 | 35 | 0.47% | 0.57% | 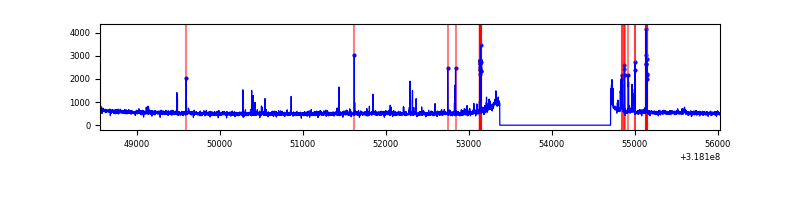 |
Top three noisy pixels from each quadrant. If the there are fewer than three noisy pixels in the level2.evt file, extra rows are filled as -1
| Pixel properties | Quadrant properties | ||||||
|---|---|---|---|---|---|---|---|
| Quadrant | DetID | PixID | Counts | Sigma | Mean | Median | Sigma |
| A | 12 | 96 | 46648 | 268.33 | 866 | 850 | 170.7 |
| A | 13 | 254 | 10283 | 55.27 | 866 | 850 | 170.7 |
| A | 0 | 226 | 7584 | 39.45 | 866 | 850 | 170.7 |
| B | 0 | 189 | 103841 | 645.97 | 851 | 833 | 159.5 |
| B | 12 | 111 | 18148 | 108.58 | 851 | 833 | 159.5 |
| B | 11 | 111 | 16291 | 96.94 | 851 | 833 | 159.5 |
| C | 14 | 238 | 134340 | 680.94 | 840 | 849 | 196.0 |
| C | 7 | 247 | 92739 | 468.74 | 840 | 849 | 196.0 |
| C | 3 | 233 | 7635 | 34.62 | 840 | 849 | 196.0 |
| D | 7 | 238 | 136889 | 662.47 | 851 | 831 | 205.4 |
| D | 13 | 104 | 62436 | 299.96 | 851 | 831 | 205.4 |
| D | 2 | 234 | 24365 | 114.59 | 851 | 831 | 205.4 |
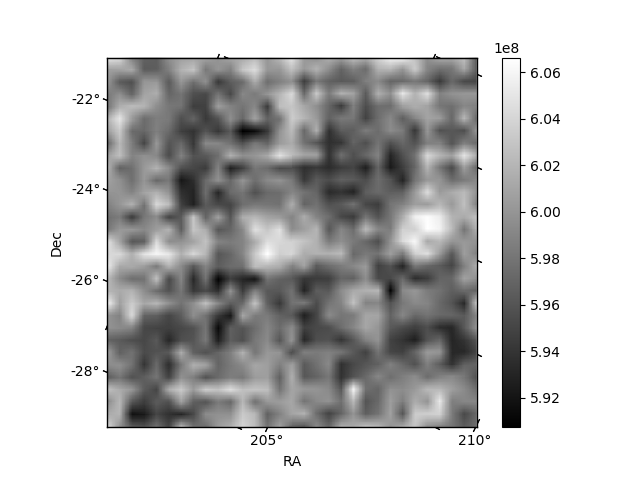
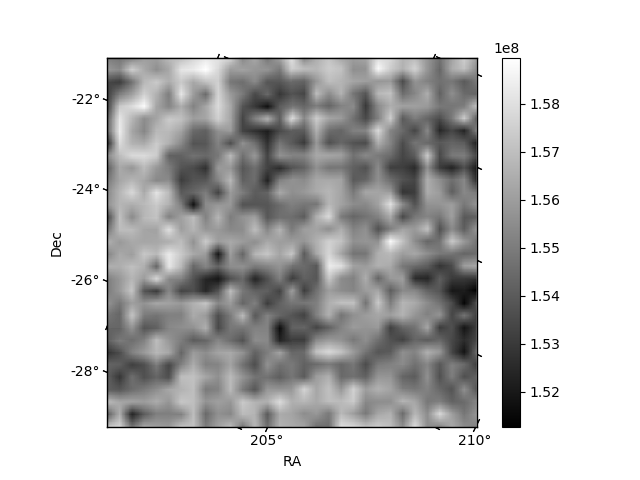
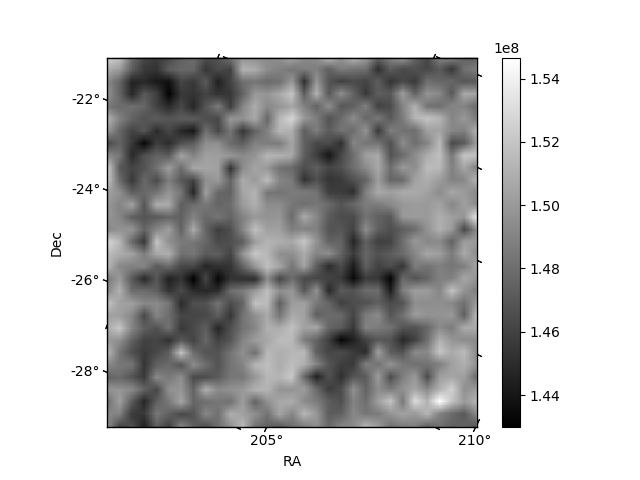
Histogram calculated using DETX and DETY for each event in the final _common_clean file
| Quadrant A | 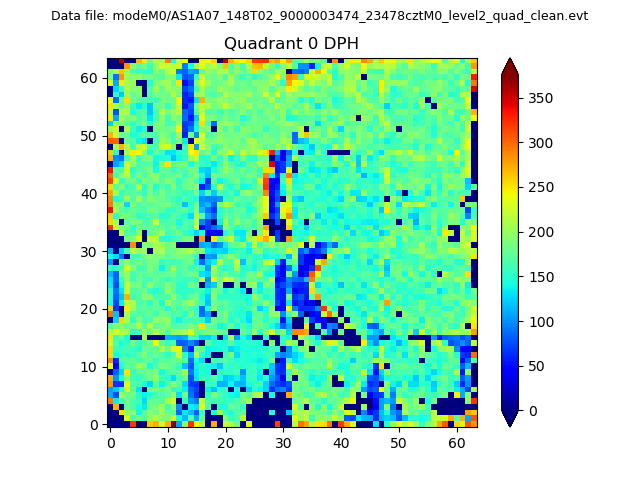 |
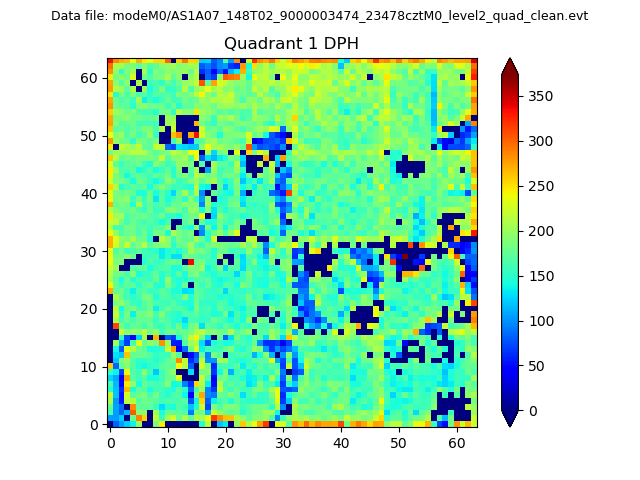 |
Quadrant B |
|---|---|---|---|
| Quadrant D |  |
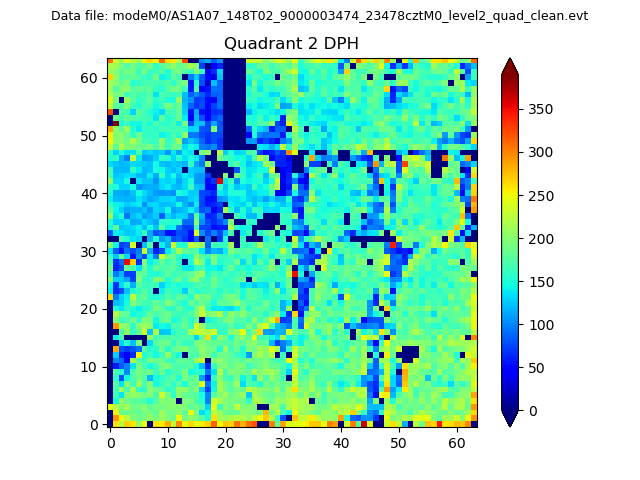 |
Quadrant C |
| Plot type | Count rate plots | Images |
|---|---|---|
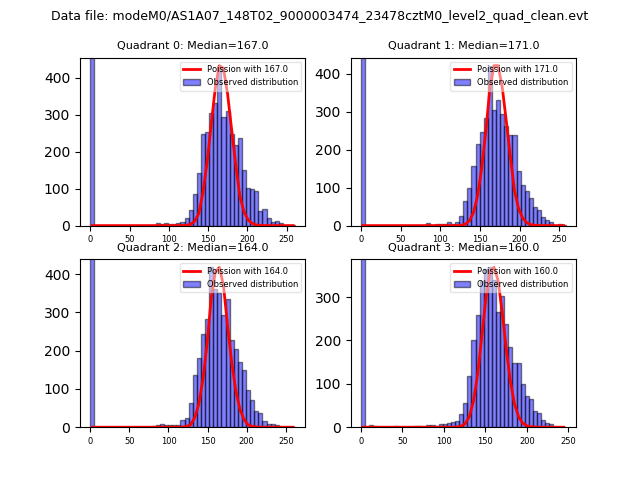
| Comparison with Poisson distribution Blue bars denote a histogram of data divided into 1 sec bins. Red curve is a Poisson curve with rate = median count rate of data. |
 |
 |
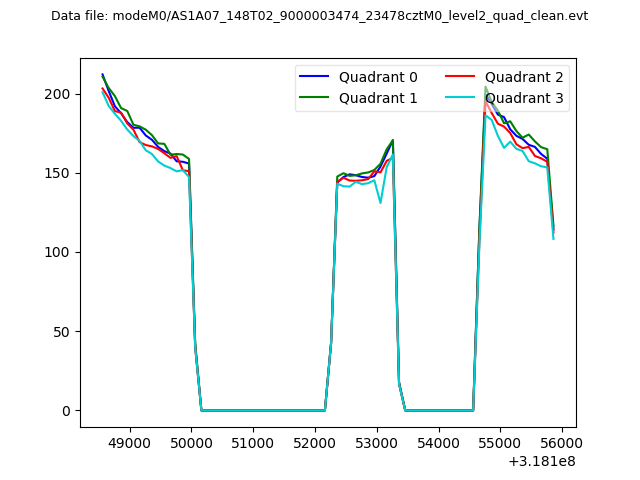
| Quadrant-wise count rates Data is divided into 100 sec bins |
 |
|
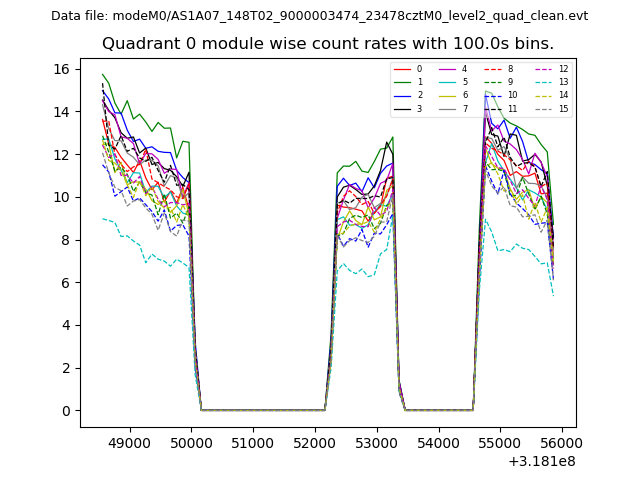
| Module-wise count rates for Quadrant A Data is divided into 100 sec bins |
 |
 |
| Module-wise count rates for Quadrant B Data is divided into 100 sec bins |
 |
 |
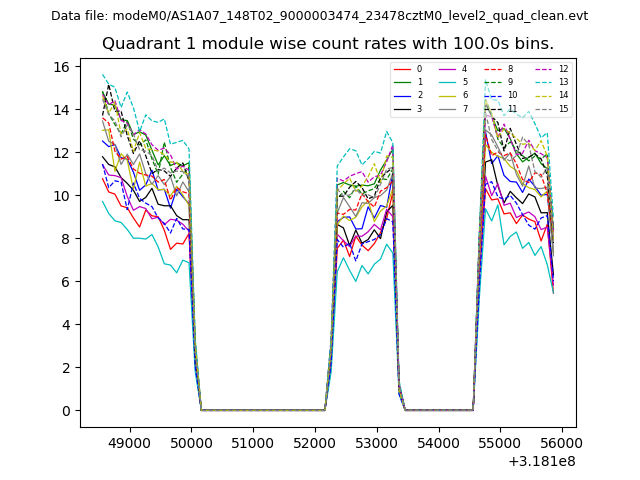
| Module-wise count rates for Quadrant C Data is divided into 100 sec bins |
 |
 |
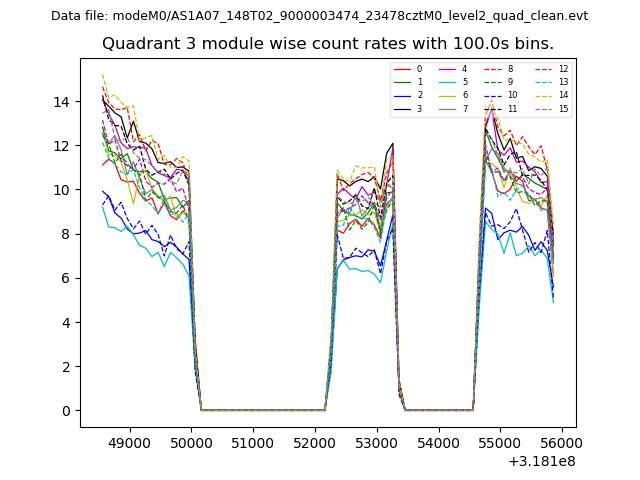
| Module-wise count rates for Quadrant D Data is divided into 100 sec bins |
 |
 |
| Parameter | Plot |
|---|---|
| CZT HV Monitor | 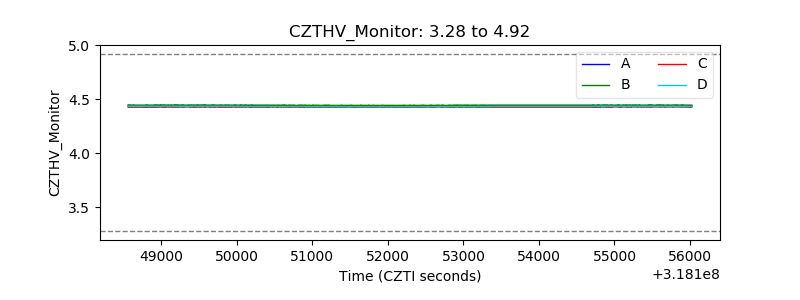 |
| D_VDD | 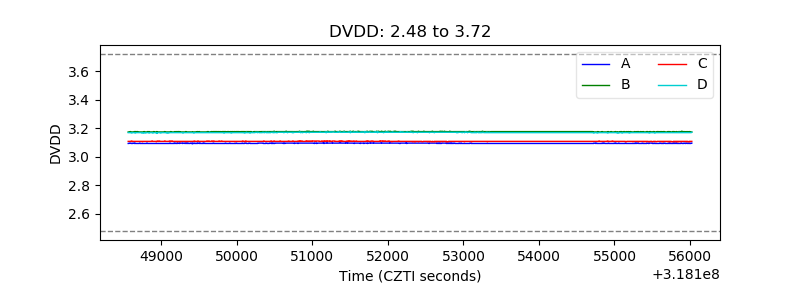 |
| Temperature 1 | 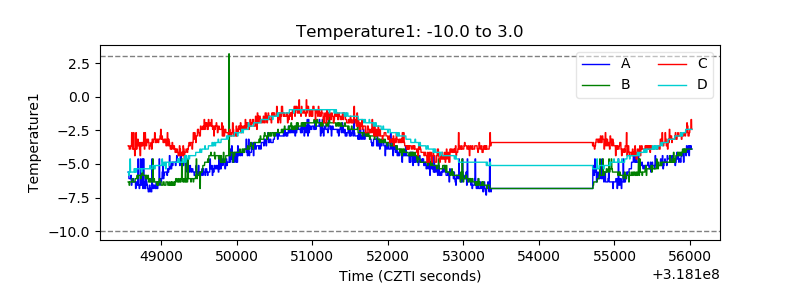 |
| Veto HV Monitor | 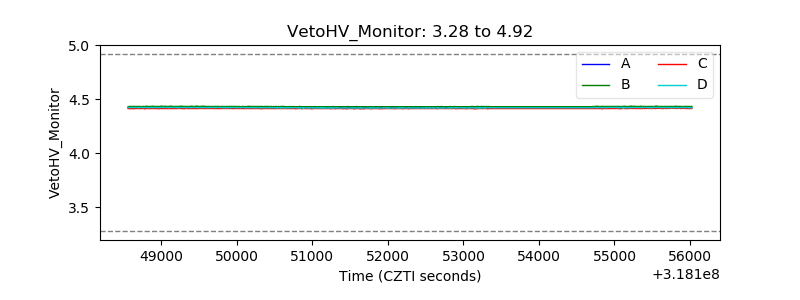 |
| Veto LLD | 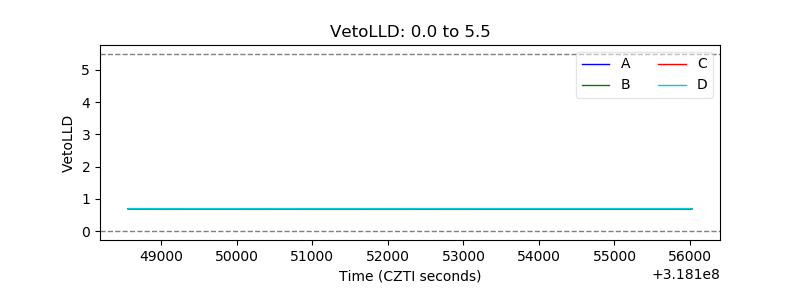 |
| Alpha Counter | 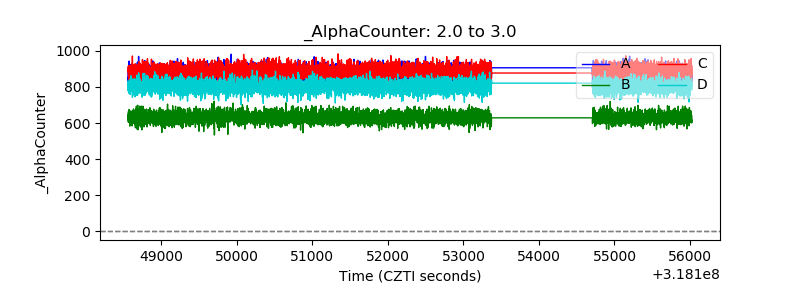 |
| _CPM_Rate |  |
| CZT Counter | 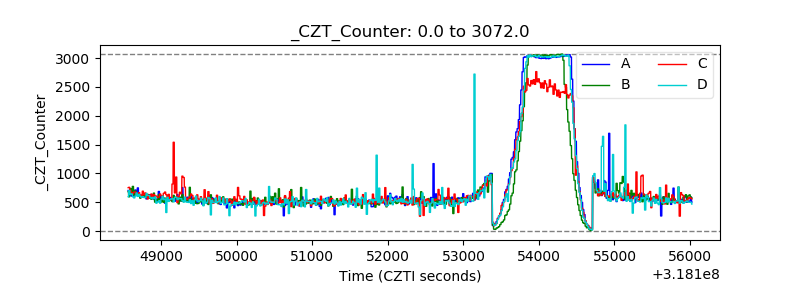 |
| +2.5 Volts monitor |  |
| +5 Volts monitor | 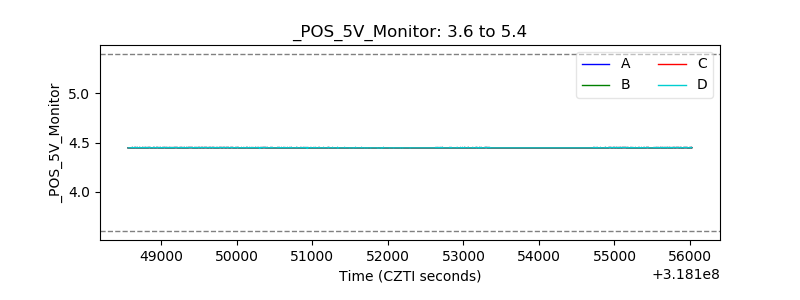 |
| _ROLL_ROT | 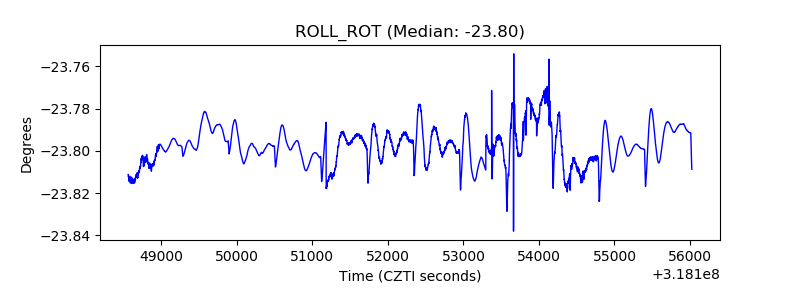 |
| _Roll_DEC | 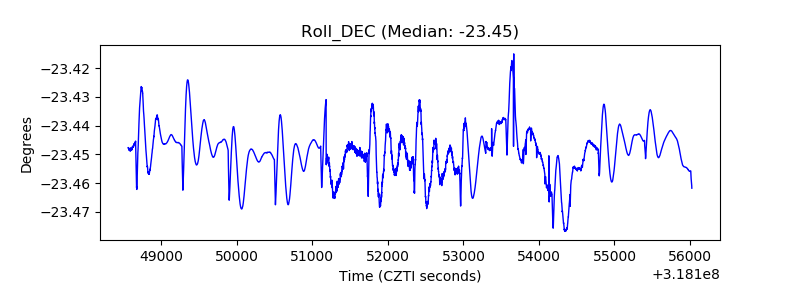 |
| _Roll_RA | 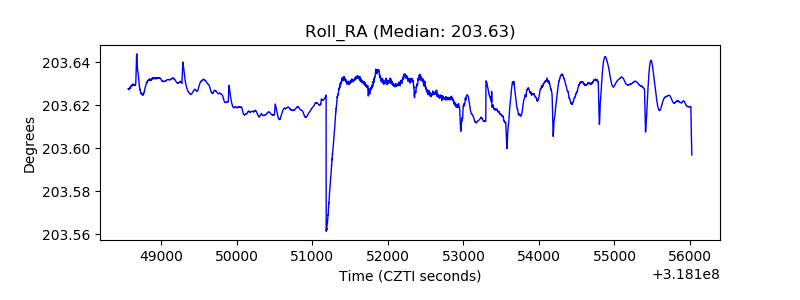 |
| Veto Counter | 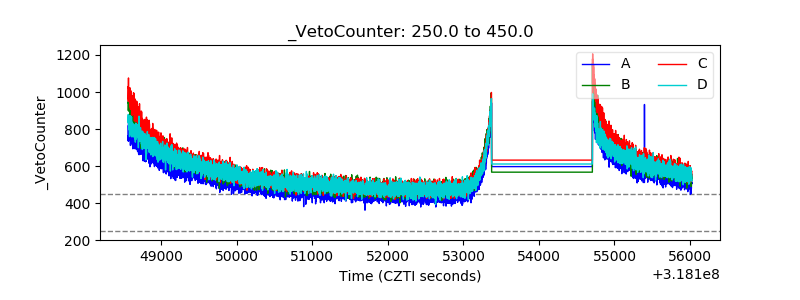 |