| Param | Original file | Final file |
|---|---|---|
| Filename | modeM0/AS1A07_148T02_9000003474_23482cztM0_level2.evt | modeM0/AS1A07_148T02_9000003474_23482cztM0_level2_quad_clean.evt |
| Size (bytes) | 579,421,440 | 81,253,440 |
| Size | 552.6 MB | 77.5 MB |
| Events in quadrant A | 3,911,916 | 485,138 |
| Events in quadrant B | 4,213,558 | 488,319 |
| Events in quadrant C | 4,234,599 | 472,580 |
| Events in quadrant D | 4,655,286 | 468,783 |
| Mode M9 | |||
|---|---|---|---|
| Quadrant | BADHDUFLAG | Total packets | Discarded packets |
| A | 0 | 6 | 0 |
| B | 0 | 7 | 0 |
| C | 0 | 7 | 0 |
| D | 0 | 7 | 0 |
| Mode M0 | |||
|---|---|---|---|
| Quadrant | BADHDUFLAG | Total packets | Discarded packets |
| A | 0 | 16533 | 3 |
| B | 0 | 17509 | 2 |
| C | 0 | 17428 | 2 |
| D | 0 | 18973 | 2 |
| Mode SS | |||
|---|---|---|---|
| Quadrant | BADHDUFLAG | Total packets | Discarded packets |
| A | 0 | 164 | 0 |
| B | 0 | 164 | 0 |
| C | 0 | 164 | 0 |
| D | 0 | 164 | 0 |
| Quadrant | Total seconds | Saturated seconds | Saturation percentage |
|---|---|---|---|
| A | 7843 | 227 | 2.894301% |
| B | 7843 | 275 | 3.506311% |
| C | 7843 | 331 | 4.220324% |
| D | 7843 | 319 | 4.067321% |
Noise dominated data is calculated using 1-second bins in cleaned event files. If a bin has >2000 counts, and if more than 50% of those come from <1% of pixels, then it is considered to be noise-dominated and hence unusable.
| Quadrant | # 1 sec bins | Bins with >0 counts | Bins with >2000 counts | High rate bins dominated by noise | Noise dominated (total time) | Noise dominated (detector-on time) | Marked lightcurve |
|---|---|---|---|---|---|---|---|
| A | 8033 | 7843 | 0 | 0 | 0.00% | 0.00% | 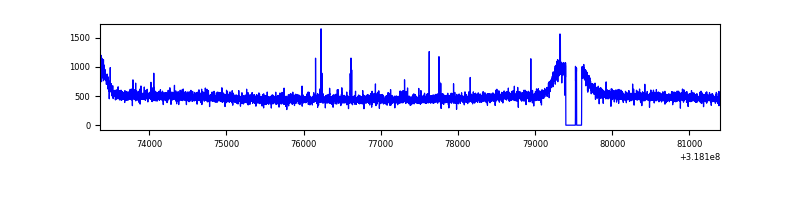 |
| B | 8033 | 7843 | 9 | 9 | 0.11% | 0.11% | 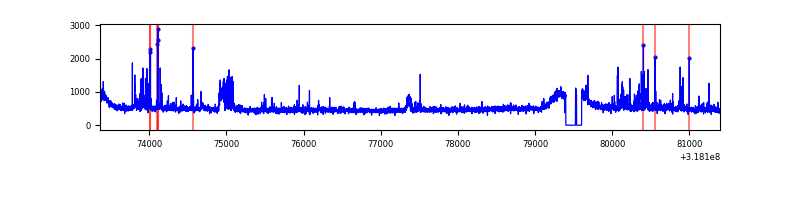 |
| C | 8033 | 7843 | 27 | 27 | 0.34% | 0.34% | 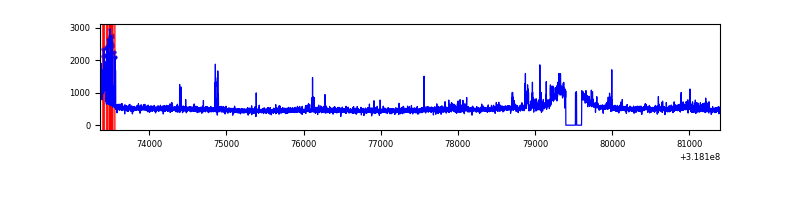 |
| D | 8033 | 7843 | 154 | 154 | 1.92% | 1.96% | 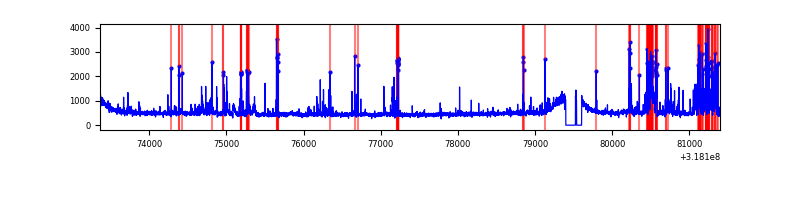 |
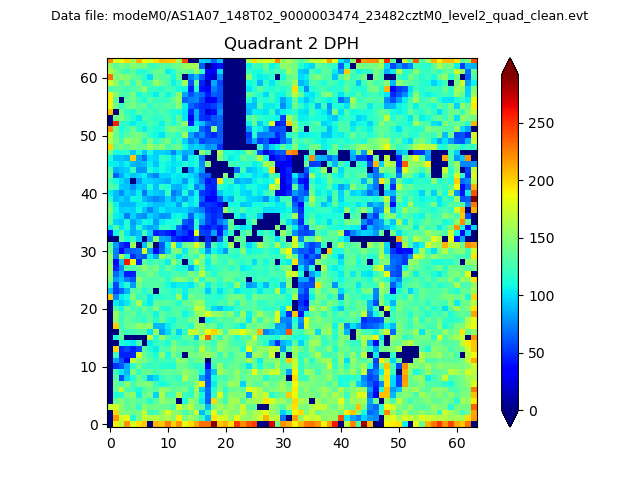
Top three noisy pixels from each quadrant. If the there are fewer than three noisy pixels in the level2.evt file, extra rows are filled as -1
| Pixel properties | Quadrant properties | ||||||
|---|---|---|---|---|---|---|---|
| Quadrant | DetID | PixID | Counts | Sigma | Mean | Median | Sigma |
| A | 4 | 2 | 20039 | 93.2 | 1004 | 980 | 204.5 |
| A | 12 | 96 | 18174 | 84.08 | 1004 | 980 | 204.5 |
| A | 13 | 254 | 13342 | 60.45 | 1004 | 980 | 204.5 |
| B | 0 | 189 | 253438 | 1320.33 | 988 | 962 | 191.2 |
| B | 15 | 32 | 35398 | 180.08 | 988 | 962 | 191.2 |
| B | 0 | 230 | 32438 | 164.6 | 988 | 962 | 191.2 |
| C | 2 | 16 | 182123 | 789.43 | 960 | 966 | 229.5 |
| C | 14 | 238 | 150540 | 651.8 | 960 | 966 | 229.5 |
| C | 7 | 247 | 125554 | 542.92 | 960 | 966 | 229.5 |
| D | 1 | 52 | 597403 | 2486.33 | 980 | 955 | 239.9 |
| D | 12 | 233 | 218606 | 907.29 | 980 | 955 | 239.9 |
| D | 13 | 104 | 47421 | 193.7 | 980 | 955 | 239.9 |
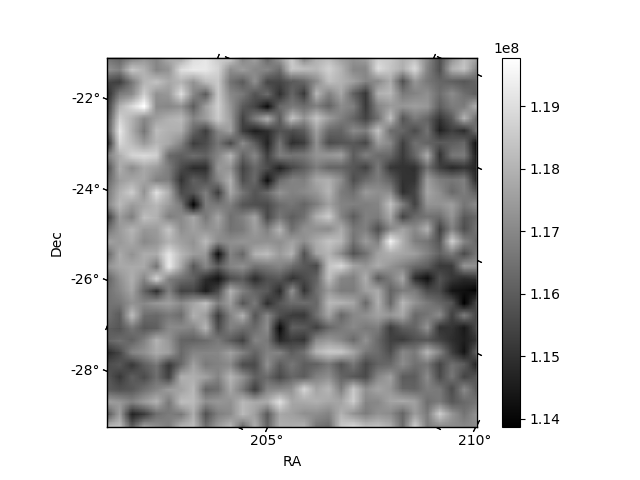
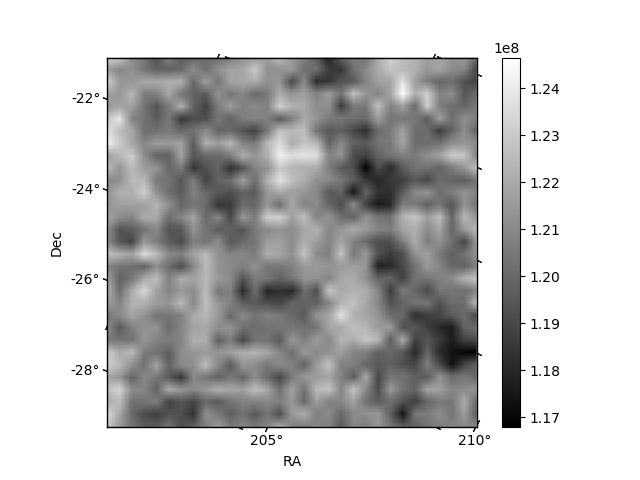
Histogram calculated using DETX and DETY for each event in the final _common_clean file
| Quadrant A | 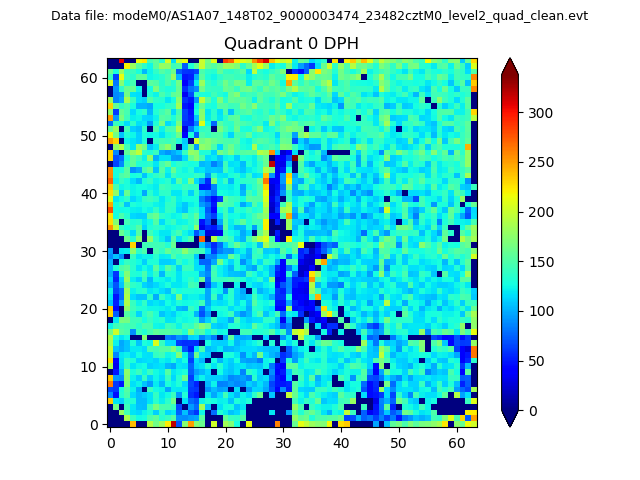 |
 |
Quadrant B |
|---|---|---|---|
| Quadrant D | 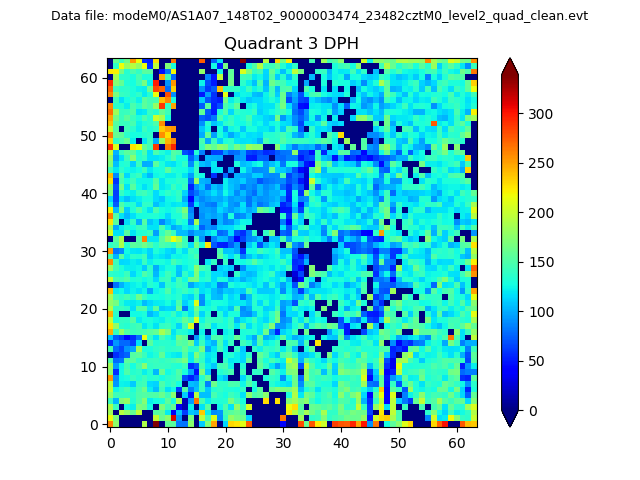 |
 |
Quadrant C |
| Plot type | Count rate plots | Images |
|---|---|---|
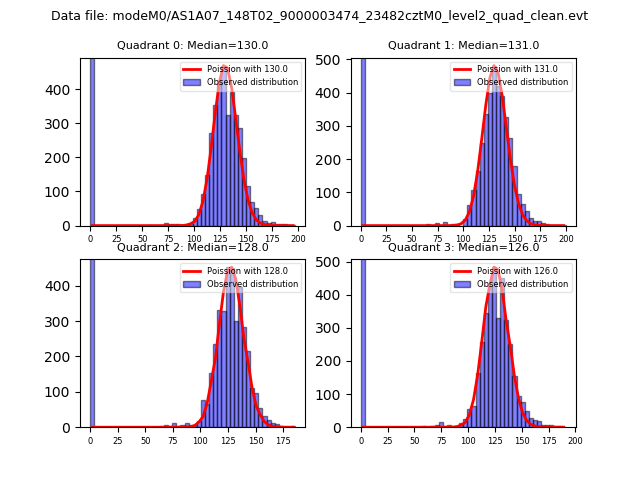
| Comparison with Poisson distribution Blue bars denote a histogram of data divided into 1 sec bins. Red curve is a Poisson curve with rate = median count rate of data. |
 |
 |
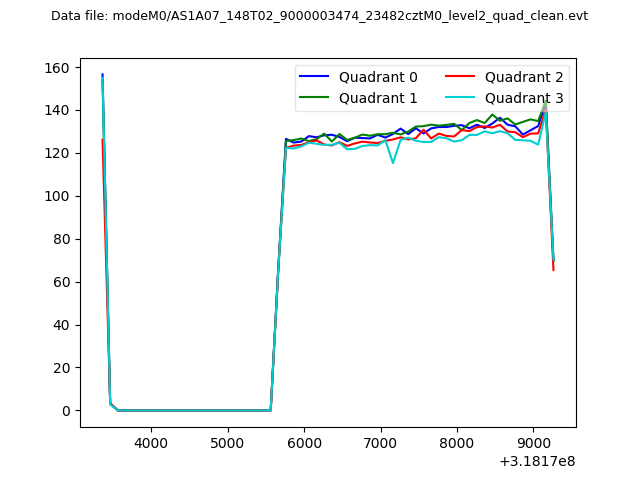
| Quadrant-wise count rates Data is divided into 100 sec bins |
 |
|
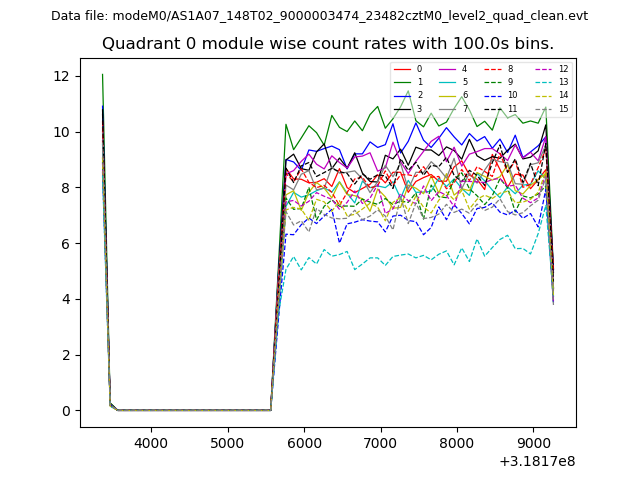
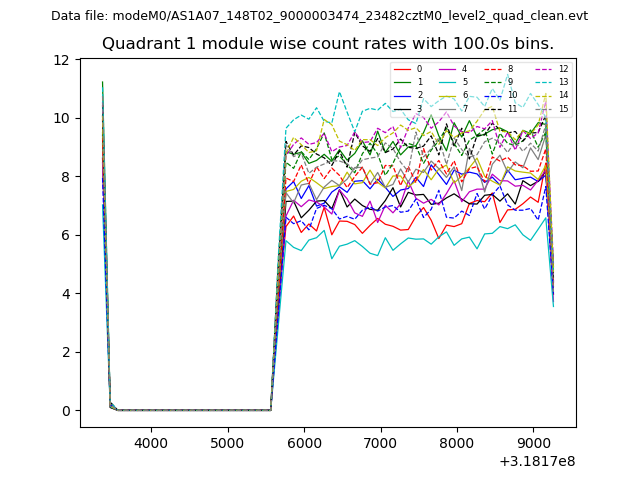
| Module-wise count rates for Quadrant A Data is divided into 100 sec bins |
 |
 |
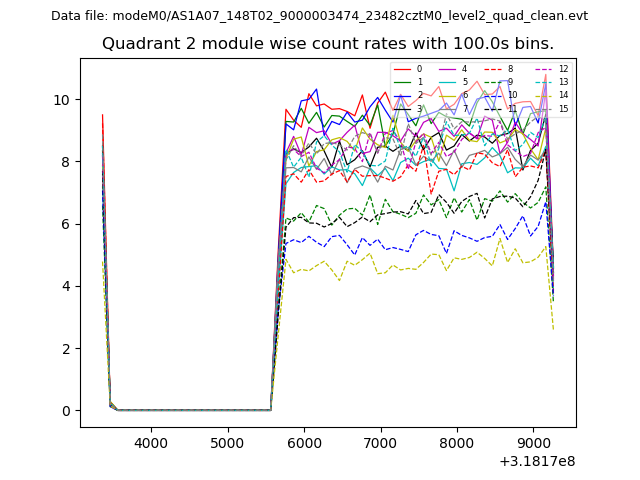
| Module-wise count rates for Quadrant B Data is divided into 100 sec bins |
 |
 |
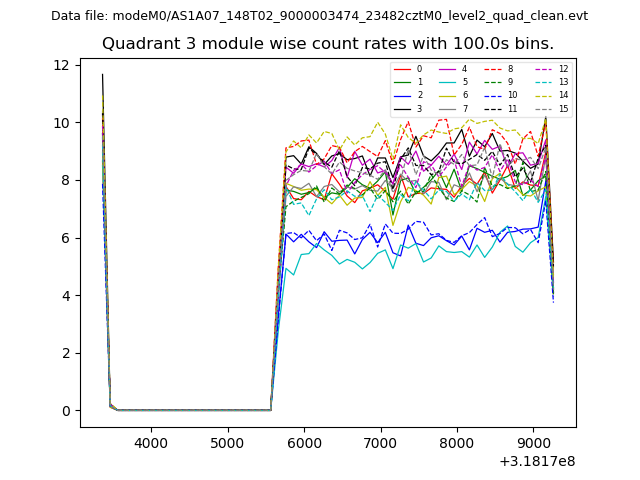
| Module-wise count rates for Quadrant C Data is divided into 100 sec bins |
 |
 |
| Module-wise count rates for Quadrant D Data is divided into 100 sec bins |
 |
 |
| Parameter | Plot |
|---|---|
| CZT HV Monitor | 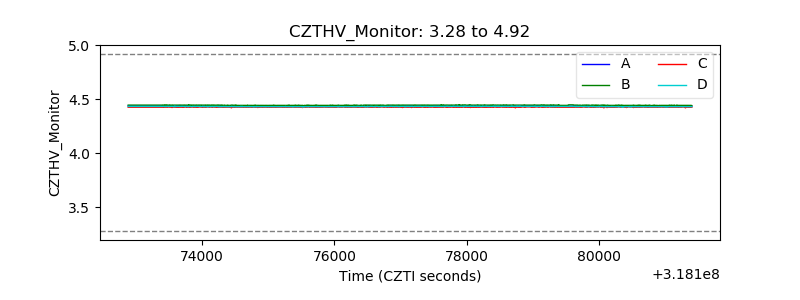 |
| D_VDD | 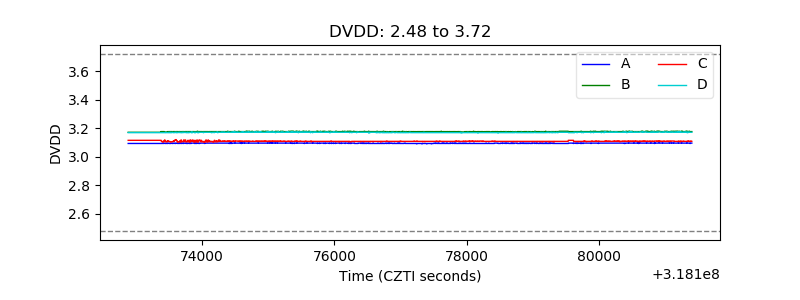 |
| Temperature 1 | 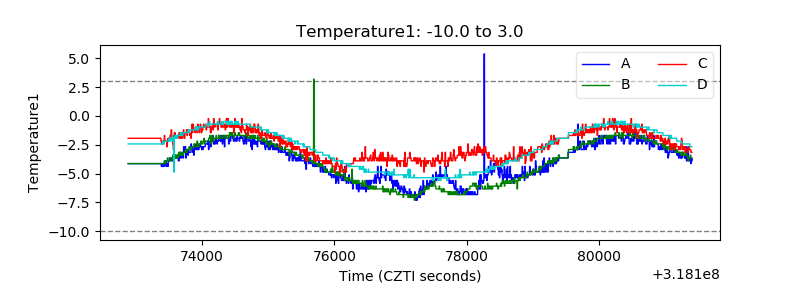 |
| Veto HV Monitor | 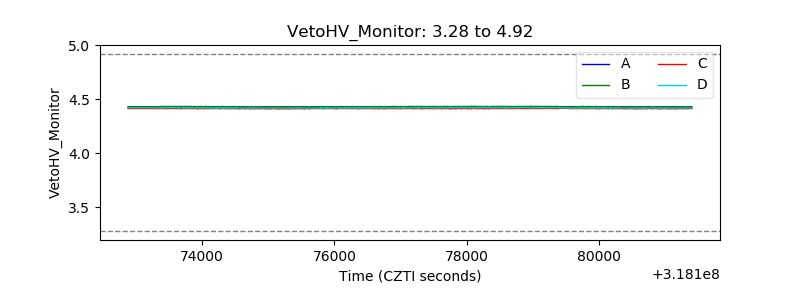 |
| Veto LLD | 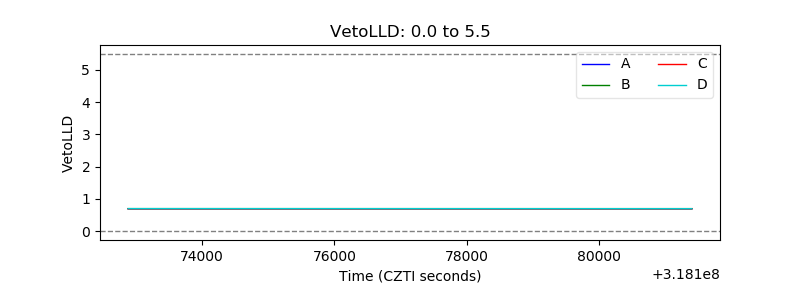 |
| Alpha Counter | 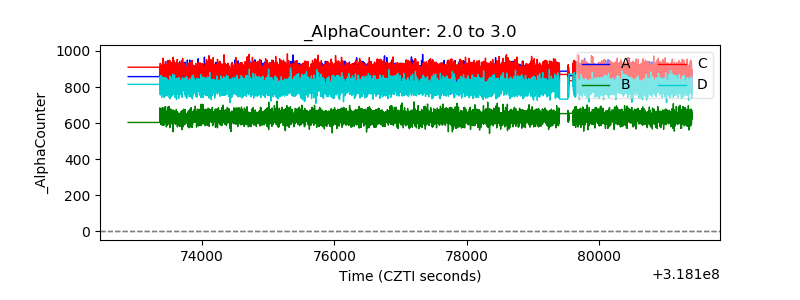 |
| _CPM_Rate | 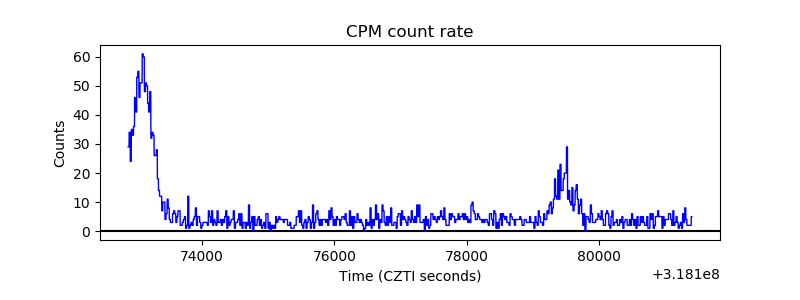 |
| CZT Counter | 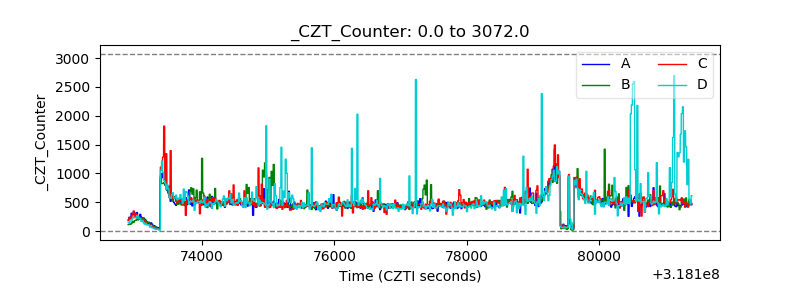 |
| +2.5 Volts monitor |  |
| +5 Volts monitor |  |
| _ROLL_ROT | 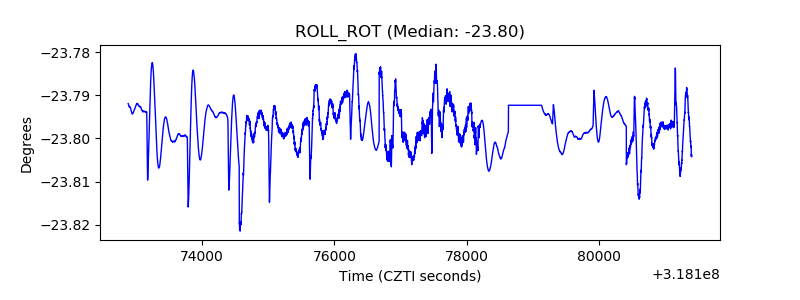 |
| _Roll_DEC | 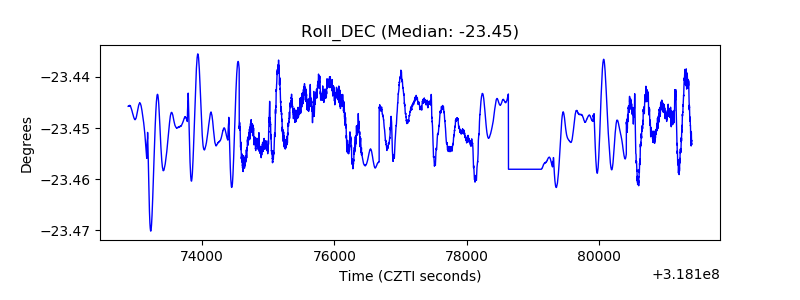 |
| _Roll_RA | 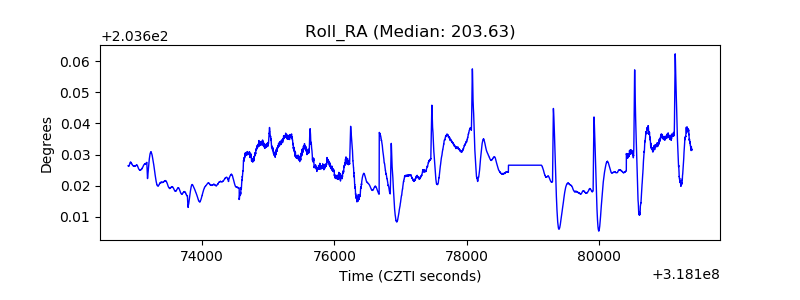 |
| Veto Counter | 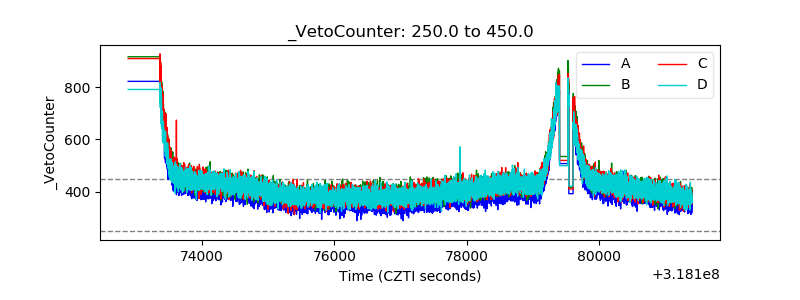 |