| Param | Original file | Final file |
|---|---|---|
| Filename | modeM0/AS1A07_148T02_9000003474_23483cztM0_level2.evt | modeM0/AS1A07_148T02_9000003474_23483cztM0_level2_quad_clean.evt |
| Size (bytes) | 655,727,040 | 85,489,920 |
| Size | 625.4 MB | 81.5 MB |
| Events in quadrant A | 4,056,597 | 515,739 |
| Events in quadrant B | 4,432,670 | 522,878 |
| Events in quadrant C | 4,356,535 | 505,565 |
| Events in quadrant D | 6,460,794 | 478,419 |
| Mode M9 | |||
|---|---|---|---|
| Quadrant | BADHDUFLAG | Total packets | Discarded packets |
| A | 0 | 4 | 0 |
| B | 0 | 4 | 0 |
| C | 0 | 4 | 0 |
| D | 0 | 4 | 0 |
| Mode M0 | |||
|---|---|---|---|
| Quadrant | BADHDUFLAG | Total packets | Discarded packets |
| A | 0 | 17272 | 2 |
| B | 0 | 18401 | 2 |
| C | 0 | 18032 | 2 |
| D | 0 | 24581 | 6 |
| Mode SS | |||
|---|---|---|---|
| Quadrant | BADHDUFLAG | Total packets | Discarded packets |
| A | 0 | 168 | 0 |
| B | 0 | 168 | 0 |
| C | 0 | 168 | 0 |
| D | 0 | 168 | 0 |
| Quadrant | Total seconds | Saturated seconds | Saturation percentage |
|---|---|---|---|
| A | 8146 | 297 | 3.645961% |
| B | 8146 | 372 | 4.566658% |
| C | 8147 | 353 | 4.332883% |
| D | 8146 | 866 | 10.630985% |
Noise dominated data is calculated using 1-second bins in cleaned event files. If a bin has >2000 counts, and if more than 50% of those come from <1% of pixels, then it is considered to be noise-dominated and hence unusable.
| Quadrant | # 1 sec bins | Bins with >0 counts | Bins with >2000 counts | High rate bins dominated by noise | Noise dominated (total time) | Noise dominated (detector-on time) | Marked lightcurve |
|---|---|---|---|---|---|---|---|
| A | 8546 | 8146 | 0 | 0 | 0.00% | 0.00% | 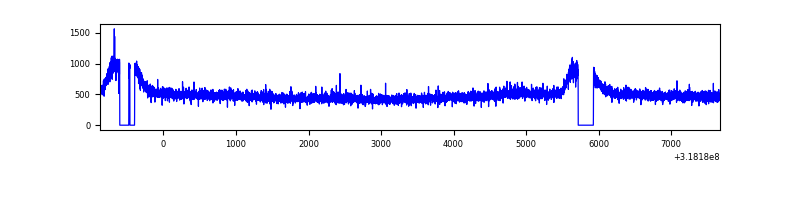 |
| B | 8546 | 8146 | 14 | 14 | 0.16% | 0.17% | 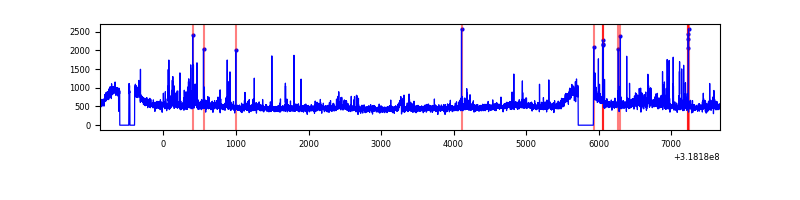 |
| C | 8547 | 8147 | 6 | 6 | 0.07% | 0.07% | 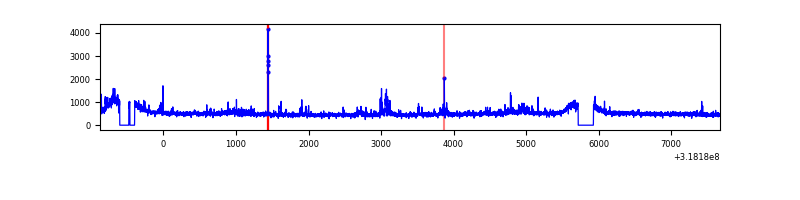 |
| D | 8545 | 8145 | 541 | 541 | 6.33% | 6.64% | 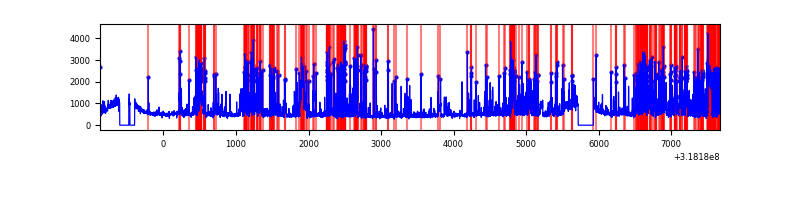 |
Top three noisy pixels from each quadrant. If the there are fewer than three noisy pixels in the level2.evt file, extra rows are filled as -1
| Pixel properties | Quadrant properties | ||||||
|---|---|---|---|---|---|---|---|
| Quadrant | DetID | PixID | Counts | Sigma | Mean | Median | Sigma |
| A | 13 | 254 | 13207 | 56.95 | 1049 | 1024 | 213.9 |
| A | 3 | 137 | 9712 | 40.62 | 1049 | 1024 | 213.9 |
| A | 0 | 226 | 9271 | 38.55 | 1049 | 1024 | 213.9 |
| B | 0 | 189 | 238959 | 1174.15 | 1033 | 1007 | 202.7 |
| B | 15 | 32 | 75560 | 367.87 | 1033 | 1007 | 202.7 |
| B | 0 | 230 | 47202 | 227.94 | 1033 | 1007 | 202.7 |
| C | 7 | 247 | 183020 | 759.11 | 1005 | 1011 | 239.8 |
| C | 14 | 238 | 155607 | 644.78 | 1005 | 1011 | 239.8 |
| C | 2 | 16 | 66167 | 271.75 | 1005 | 1011 | 239.8 |
| D | 1 | 52 | 2272611 | 9176.48 | 998 | 968 | 247.6 |
| D | 12 | 233 | 216977 | 872.58 | 998 | 968 | 247.6 |
| D | 13 | 249 | 119516 | 478.88 | 998 | 968 | 247.6 |
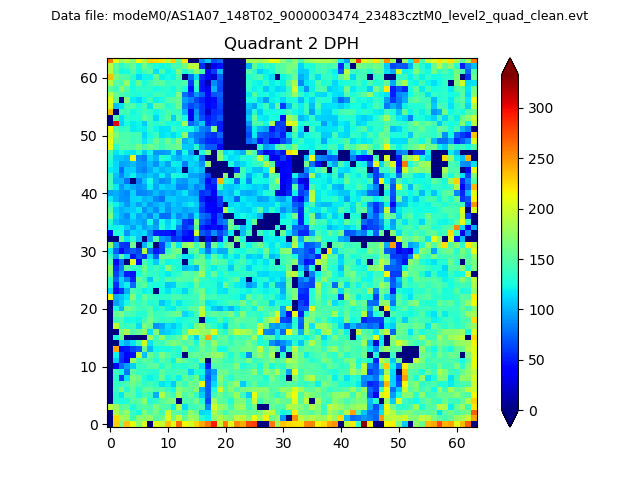
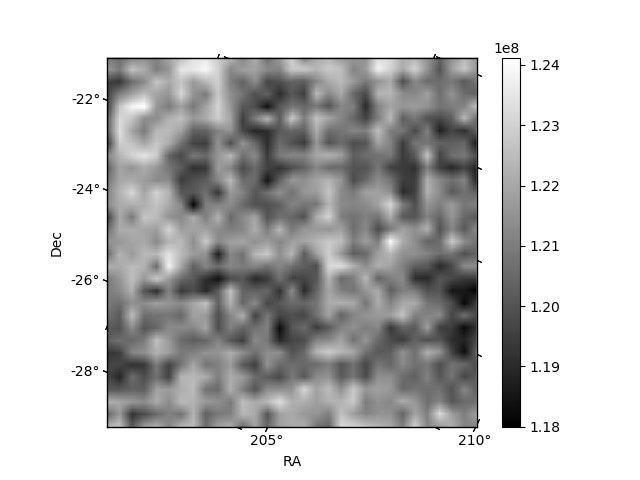
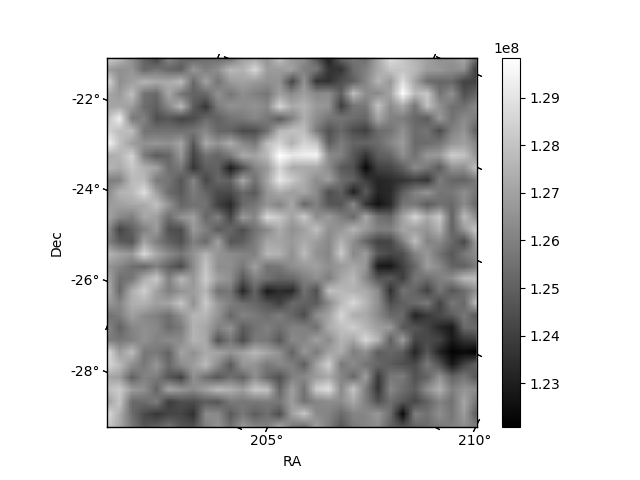
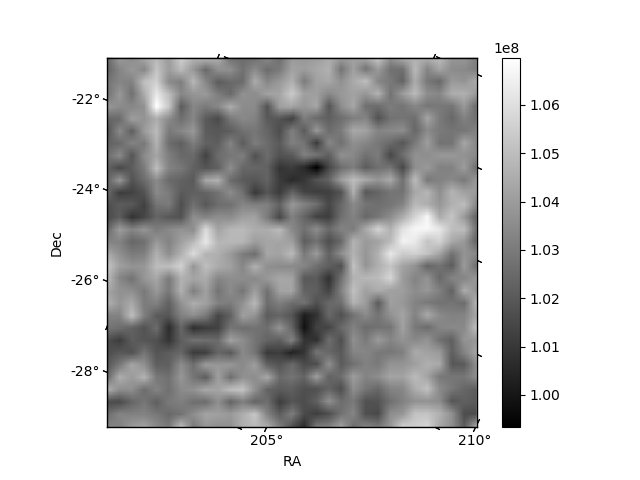
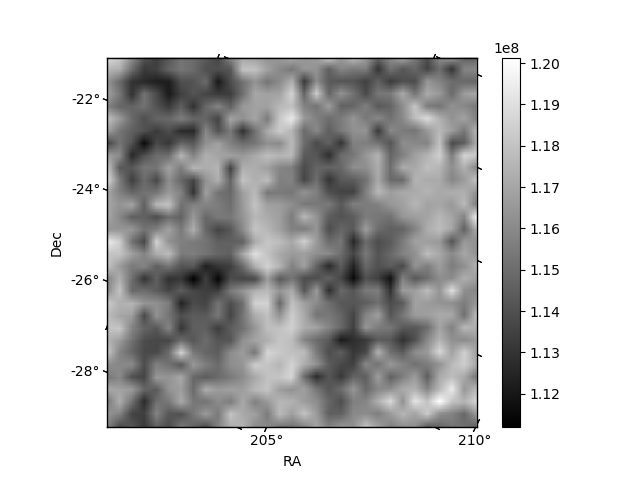
Histogram calculated using DETX and DETY for each event in the final _common_clean file
| Quadrant A | 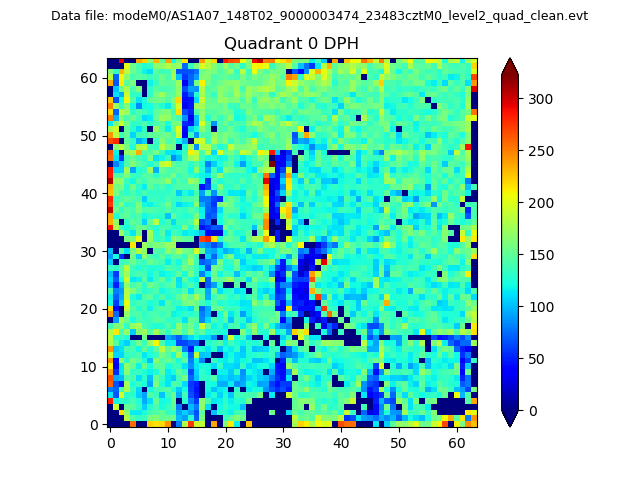 |
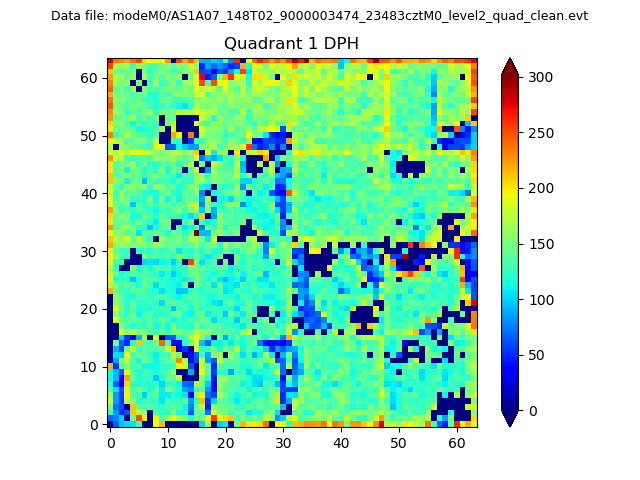 |
Quadrant B |
|---|---|---|---|
| Quadrant D | 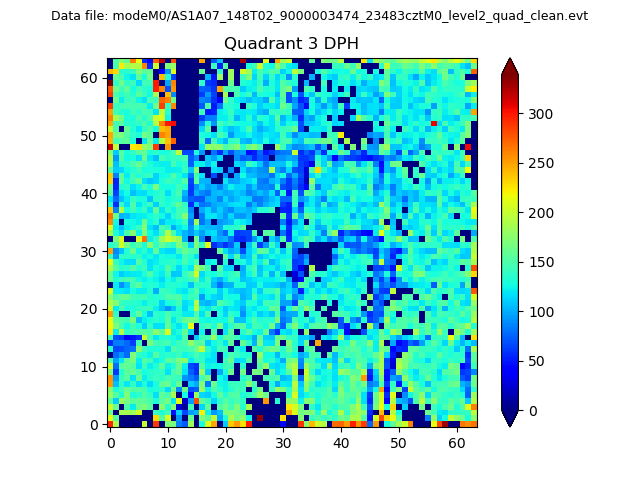 |
 |
Quadrant C |
| Plot type | Count rate plots | Images |
|---|---|---|
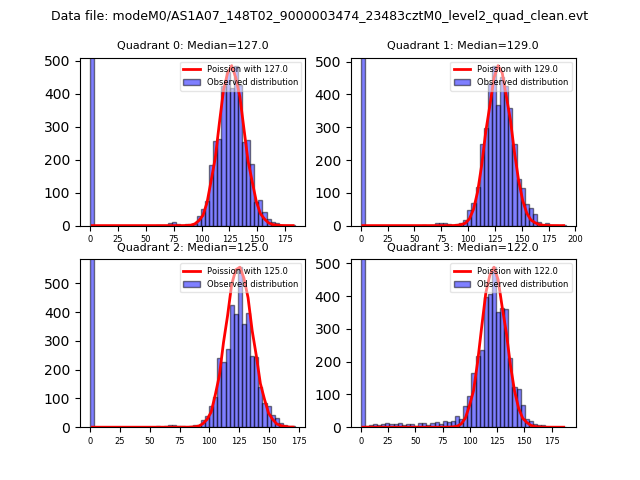
| Comparison with Poisson distribution Blue bars denote a histogram of data divided into 1 sec bins. Red curve is a Poisson curve with rate = median count rate of data. |
 |
 |
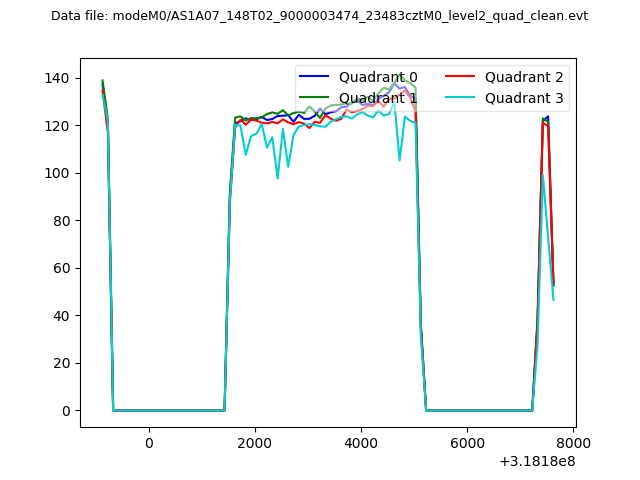
| Quadrant-wise count rates Data is divided into 100 sec bins |
 |
|
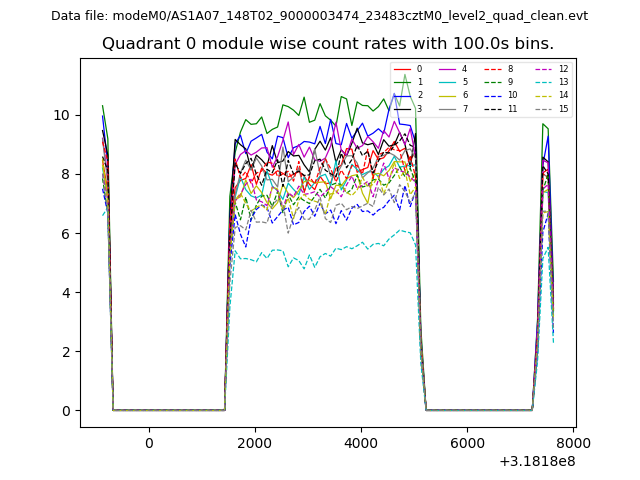
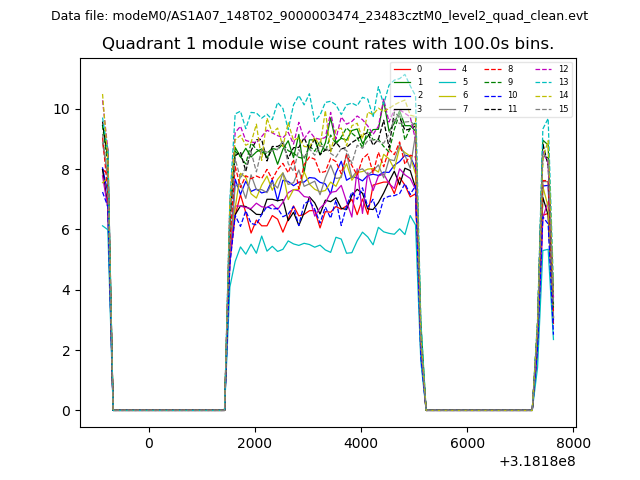
| Module-wise count rates for Quadrant A Data is divided into 100 sec bins |
 |
 |
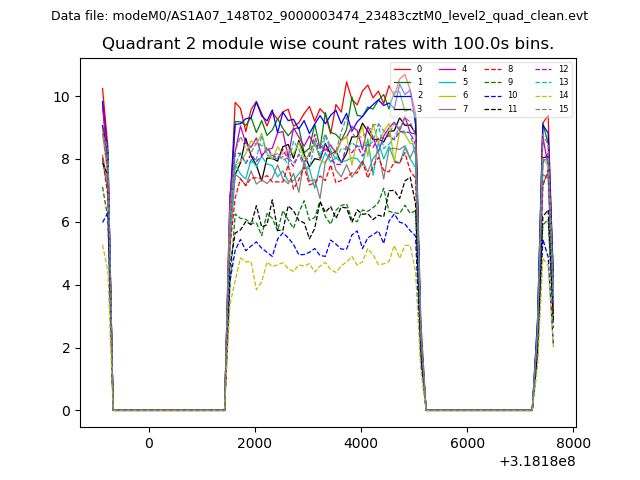
| Module-wise count rates for Quadrant B Data is divided into 100 sec bins |
 |
 |
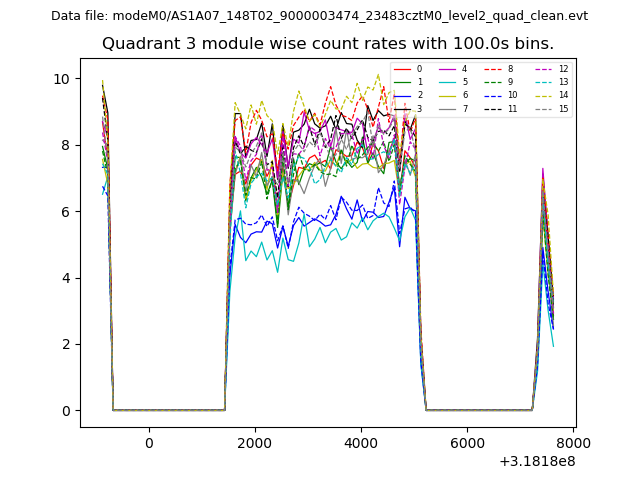
| Module-wise count rates for Quadrant C Data is divided into 100 sec bins |
 |
 |
| Module-wise count rates for Quadrant D Data is divided into 100 sec bins |
 |
 |
| Parameter | Plot |
|---|---|
| CZT HV Monitor | 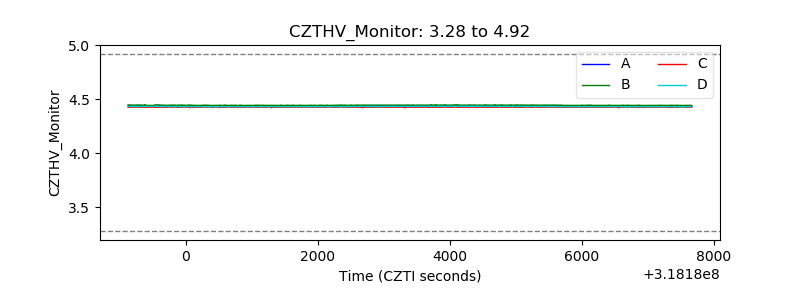 |
| D_VDD | 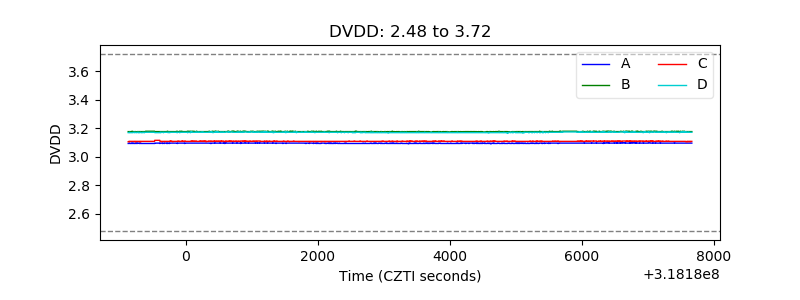 |
| Temperature 1 | 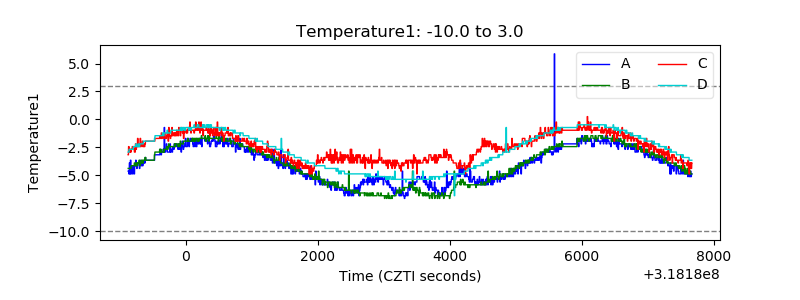 |
| Veto HV Monitor | 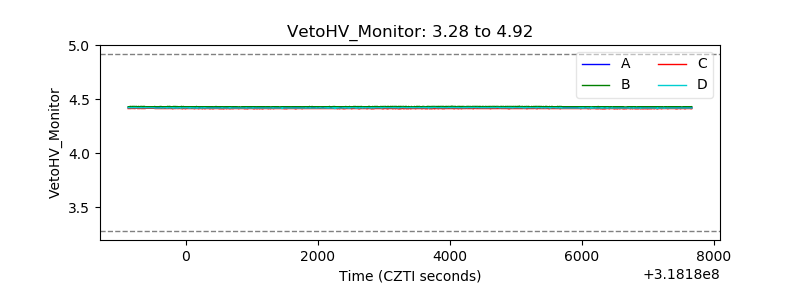 |
| Veto LLD | 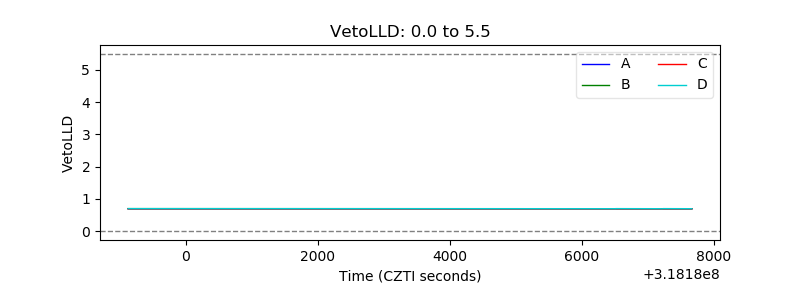 |
| Alpha Counter | 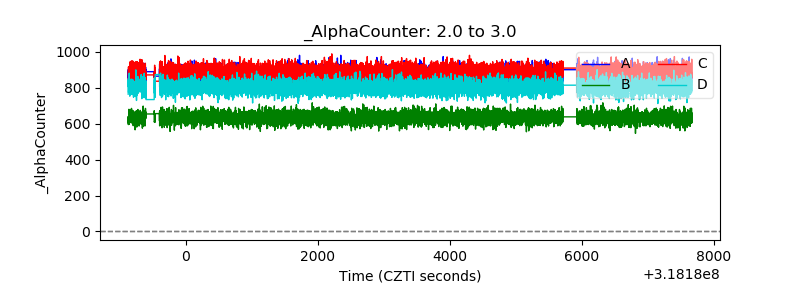 |
| _CPM_Rate | 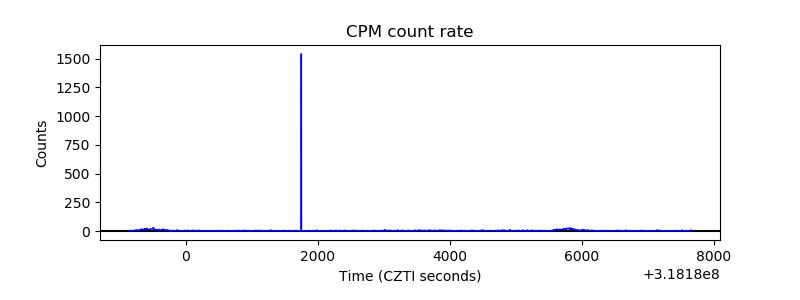 |
| CZT Counter | 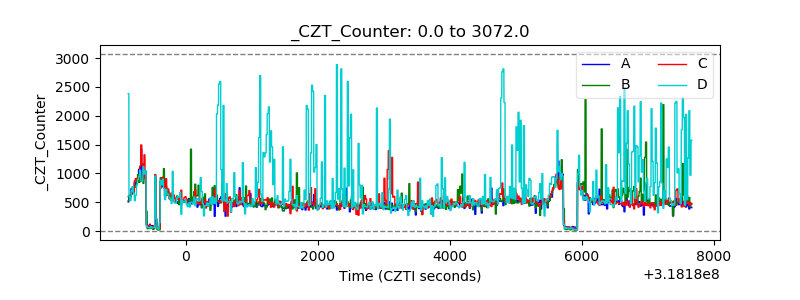 |
| +2.5 Volts monitor |  |
| +5 Volts monitor |  |
| _ROLL_ROT | 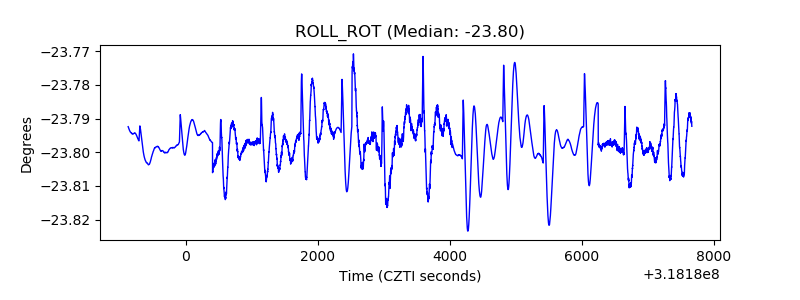 |
| _Roll_DEC | 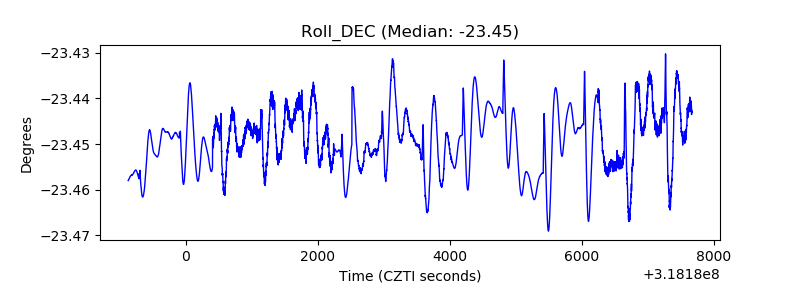 |
| _Roll_RA | 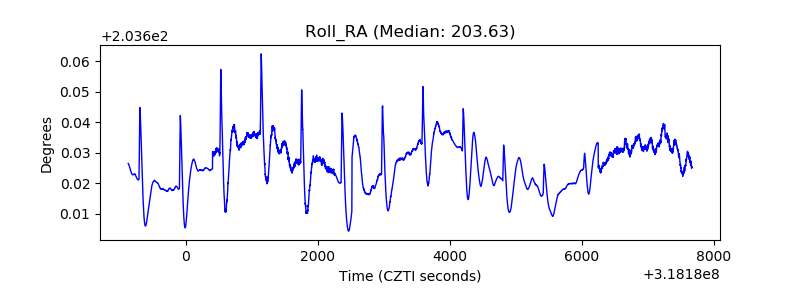 |
| Veto Counter | 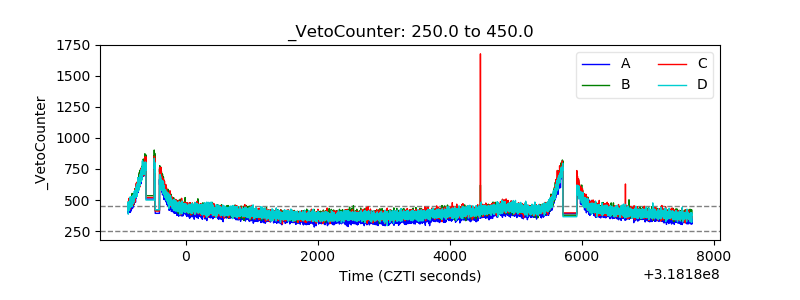 |