| Param | Original file | Final file |
|---|---|---|
| Filename | modeM0/AS1A07_148T02_9000003474_23486cztM0_level2.evt | modeM0/AS1A07_148T02_9000003474_23486cztM0_level2_quad_clean.evt |
| Size (bytes) | 264,401,280 | 26,058,240 |
| Size | 252.2 MB | 24.9 MB |
| Events in quadrant A | 1,608,549 | 144,127 |
| Events in quadrant B | 1,815,892 | 144,473 |
| Events in quadrant C | 1,661,642 | 141,007 |
| Events in quadrant D | 2,701,109 | 130,256 |
| Mode M9 | |||
|---|---|---|---|
| Quadrant | BADHDUFLAG | Total packets | Discarded packets |
| A | 0 | 2 | 0 |
| B | 0 | 2 | 0 |
| C | 0 | 2 | 0 |
| D | 0 | 2 | 0 |
| Mode M0 | |||
|---|---|---|---|
| Quadrant | BADHDUFLAG | Total packets | Discarded packets |
| A | 0 | 6831 | 1 |
| B | 0 | 7486 | 1 |
| C | 0 | 6958 | 1 |
| D | 0 | 10219 | 1 |
| Mode SS | |||
|---|---|---|---|
| Quadrant | BADHDUFLAG | Total packets | Discarded packets |
| A | 0 | 66 | 0 |
| B | 0 | 66 | 0 |
| C | 0 | 66 | 0 |
| D | 0 | 66 | 0 |
| Quadrant | Total seconds | Saturated seconds | Saturation percentage |
|---|---|---|---|
| A | 3215 | 121 | 3.763608% |
| B | 3215 | 164 | 5.101089% |
| C | 3215 | 147 | 4.572317% |
| D | 3215 | 416 | 12.939347% |
Noise dominated data is calculated using 1-second bins in cleaned event files. If a bin has >2000 counts, and if more than 50% of those come from <1% of pixels, then it is considered to be noise-dominated and hence unusable.
| Quadrant | # 1 sec bins | Bins with >0 counts | Bins with >2000 counts | High rate bins dominated by noise | Noise dominated (total time) | Noise dominated (detector-on time) | Marked lightcurve |
|---|---|---|---|---|---|---|---|
| A | 3425 | 3215 | 0 | 0 | 0.00% | 0.00% | 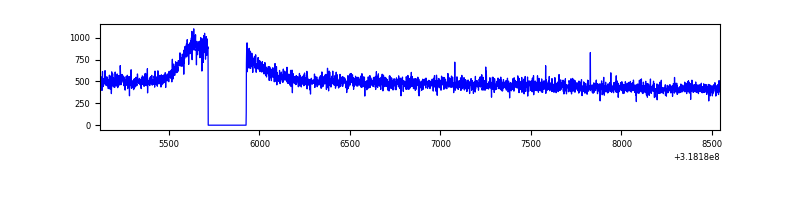 |
| B | 3425 | 3215 | 11 | 11 | 0.32% | 0.34% | 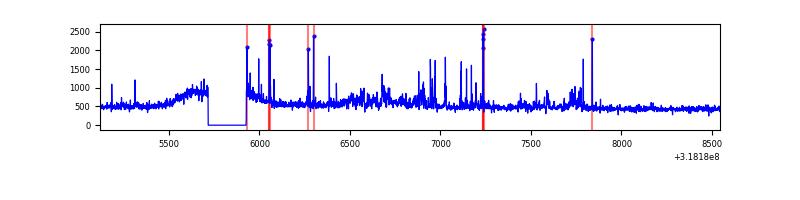 |
| C | 3425 | 3215 | 2 | 2 | 0.06% | 0.06% | 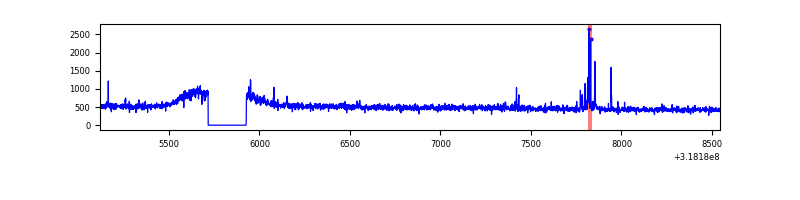 |
| D | 3425 | 3215 | 250 | 250 | 7.30% | 7.78% | 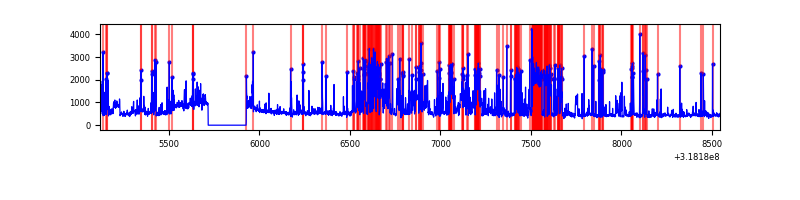 |
Top three noisy pixels from each quadrant. If the there are fewer than three noisy pixels in the level2.evt file, extra rows are filled as -1
| Pixel properties | Quadrant properties | ||||||
|---|---|---|---|---|---|---|---|
| Quadrant | DetID | PixID | Counts | Sigma | Mean | Median | Sigma |
| A | 13 | 254 | 5525 | 59.63 | 416 | 407 | 85.8 |
| A | 3 | 137 | 3834 | 39.93 | 416 | 407 | 85.8 |
| A | 0 | 226 | 3758 | 39.05 | 416 | 407 | 85.8 |
| B | 0 | 189 | 144809 | 1761.19 | 407 | 395 | 82.0 |
| B | 15 | 32 | 36247 | 437.23 | 407 | 395 | 82.0 |
| B | 0 | 245 | 23989 | 287.74 | 407 | 395 | 82.0 |
| C | 14 | 238 | 61273 | 636.17 | 395 | 398 | 95.7 |
| C | 7 | 247 | 47556 | 492.82 | 395 | 398 | 95.7 |
| C | 0 | 239 | 5100 | 49.14 | 395 | 398 | 95.7 |
| D | 1 | 52 | 1199051 | 12411.46 | 387 | 375 | 96.6 |
| D | 2 | 234 | 12706 | 127.68 | 387 | 375 | 96.6 |
| D | 2 | 153 | 10390 | 103.7 | 387 | 375 | 96.6 |
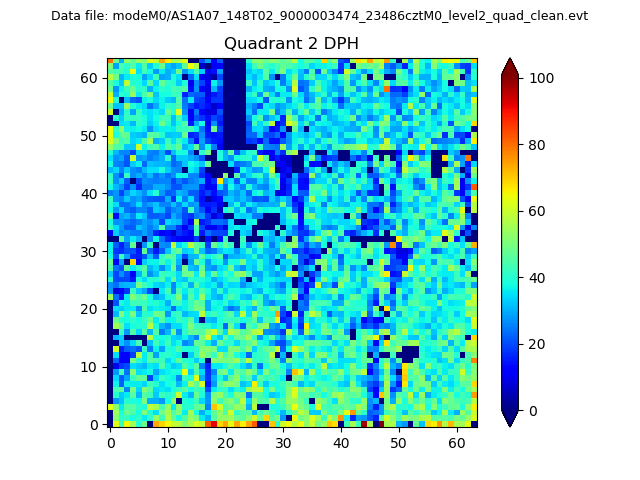
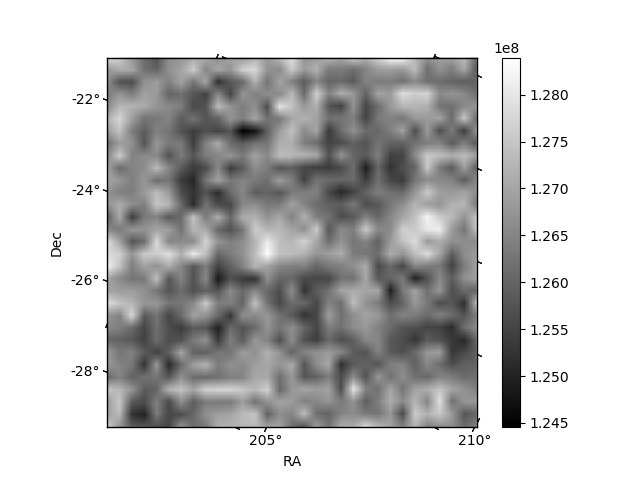
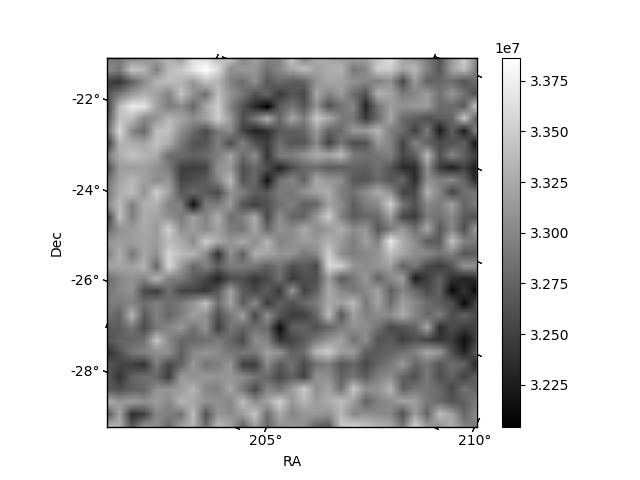
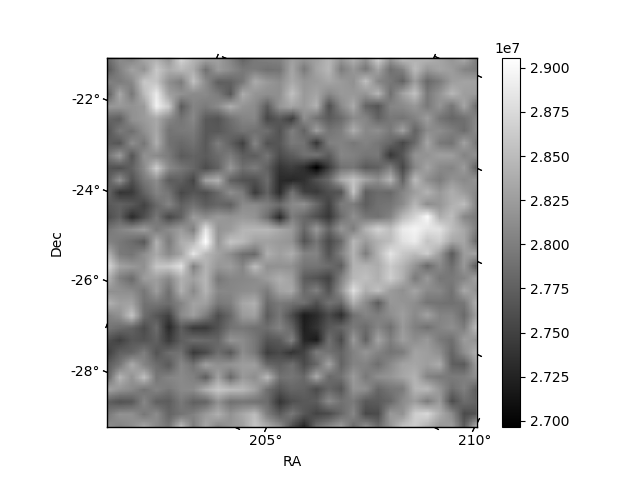
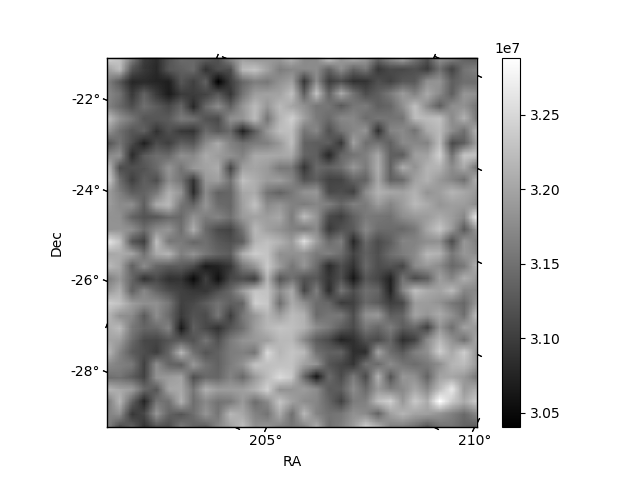
Histogram calculated using DETX and DETY for each event in the final _common_clean file
| Quadrant A | 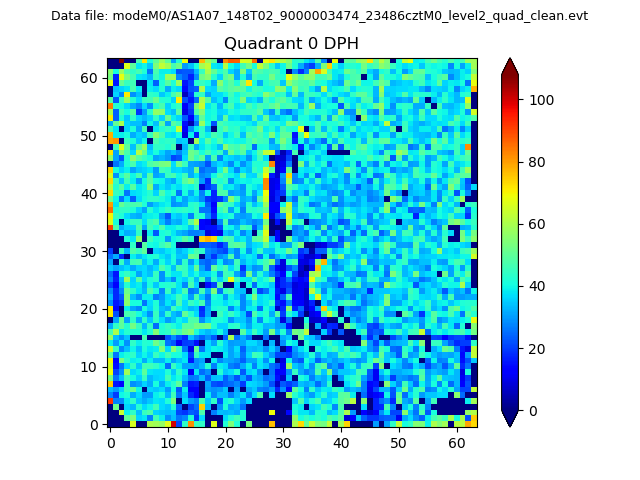 |
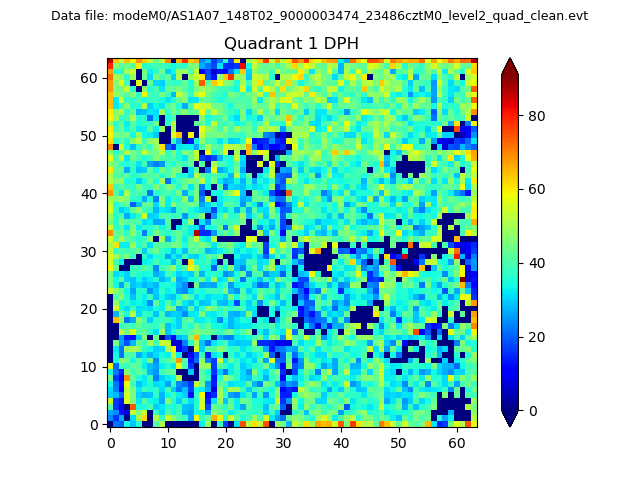 |
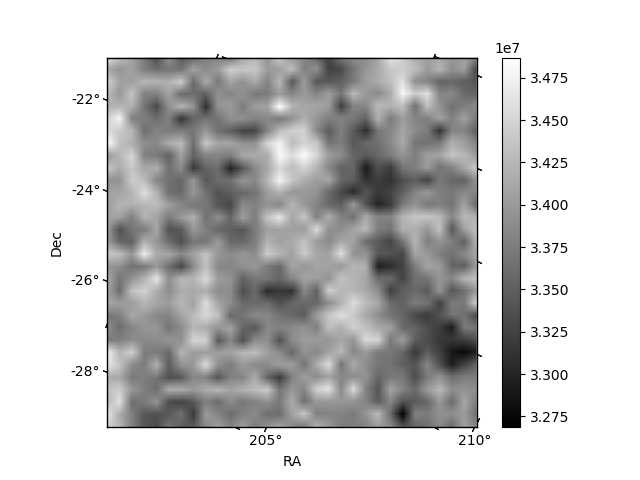
Quadrant B |
|---|---|---|---|
| Quadrant D | 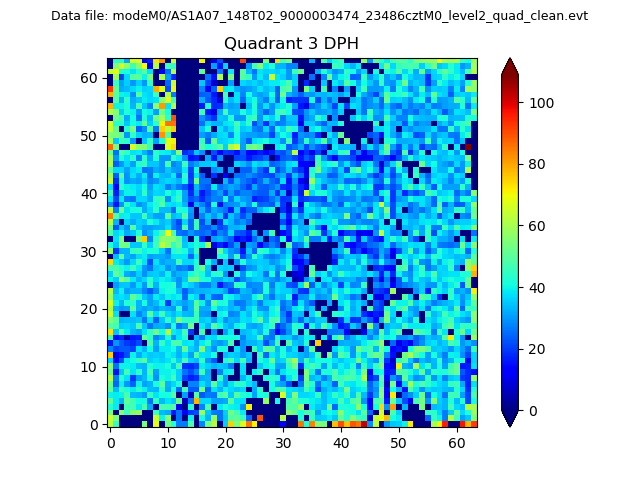 |
 |
Quadrant C |
| Plot type | Count rate plots | Images |
|---|---|---|
| Comparison with Poisson distribution Blue bars denote a histogram of data divided into 1 sec bins. Red curve is a Poisson curve with rate = median count rate of data. |
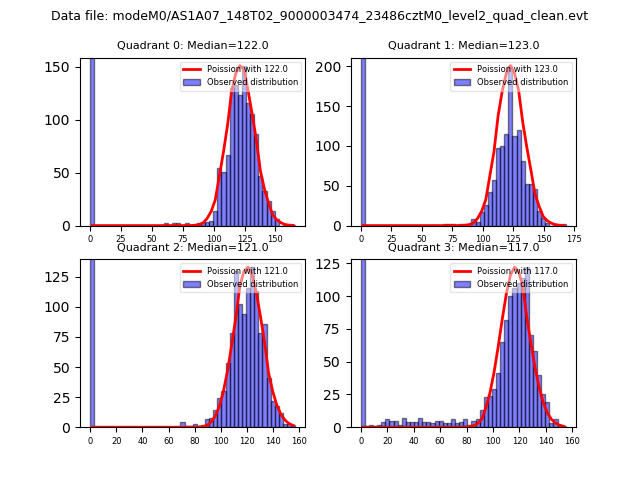 |
 |
| Quadrant-wise count rates Data is divided into 100 sec bins |
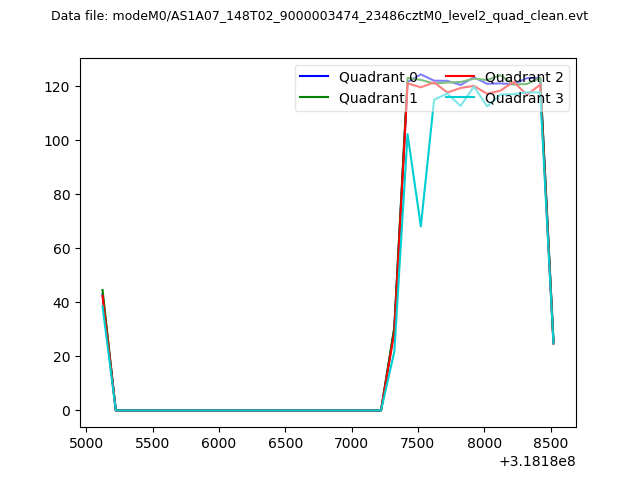 |
|
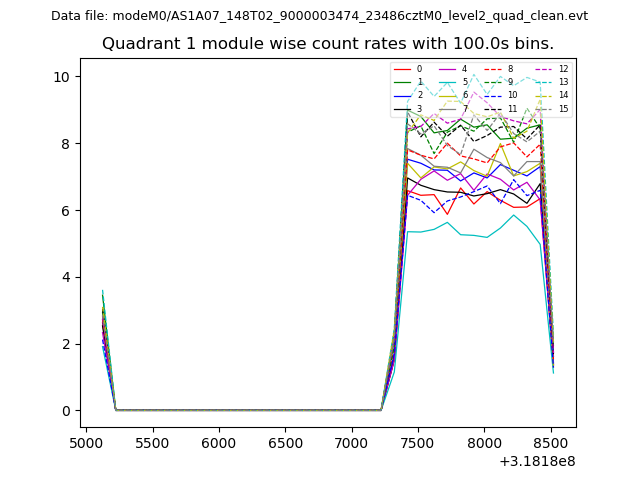
| Module-wise count rates for Quadrant A Data is divided into 100 sec bins |
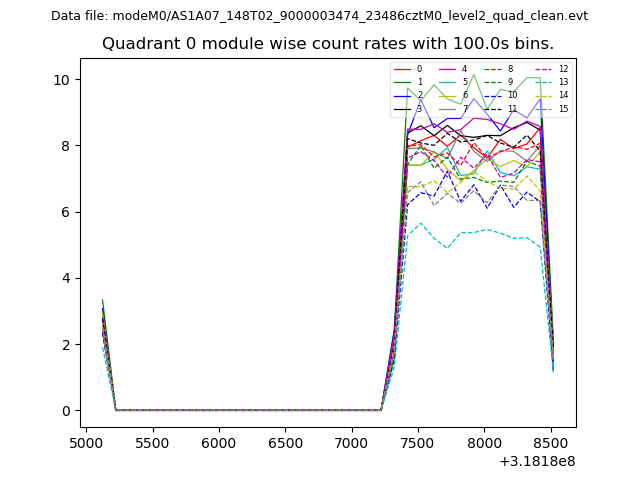 |
 |
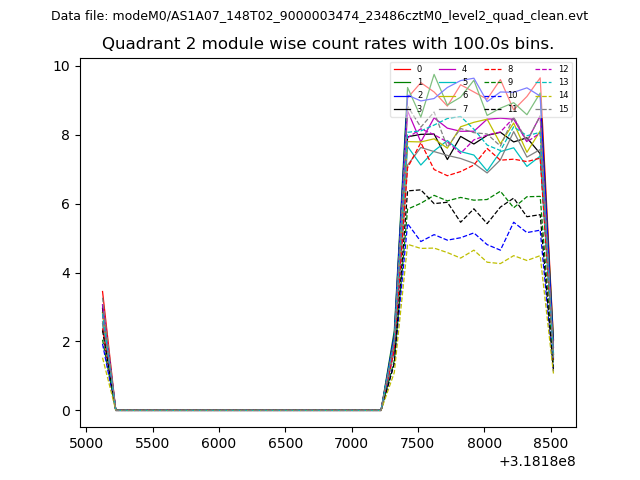
| Module-wise count rates for Quadrant B Data is divided into 100 sec bins |
 |
 |
| Module-wise count rates for Quadrant C Data is divided into 100 sec bins |
 |
 |
| Module-wise count rates for Quadrant D Data is divided into 100 sec bins |
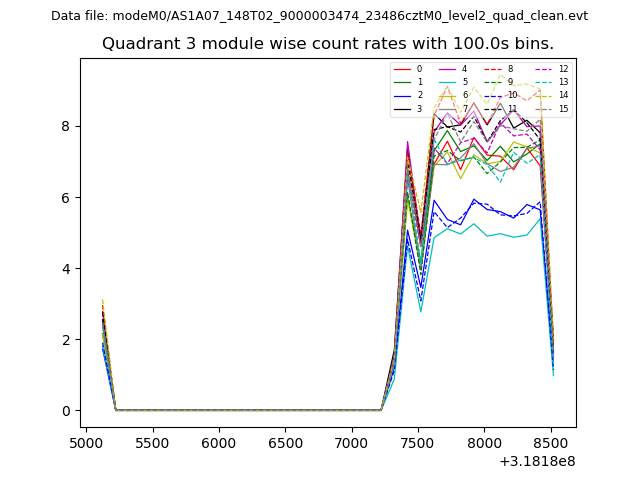 |
 |
| Parameter | Plot |
|---|---|
| CZT HV Monitor | 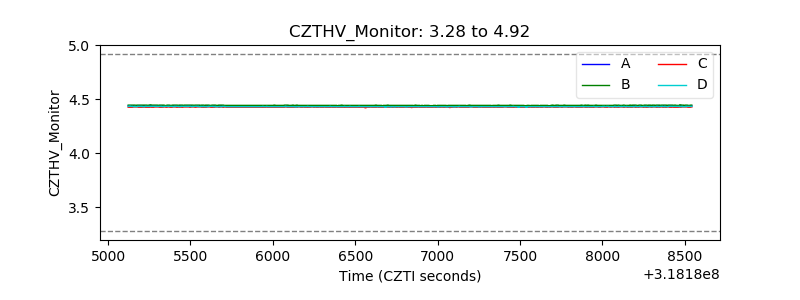 |
| D_VDD | 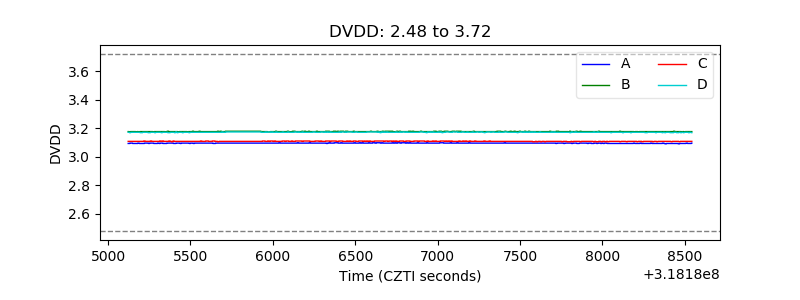 |
| Temperature 1 | 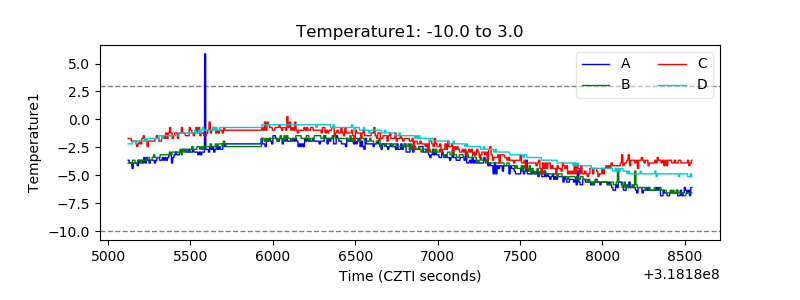 |
| Veto HV Monitor | 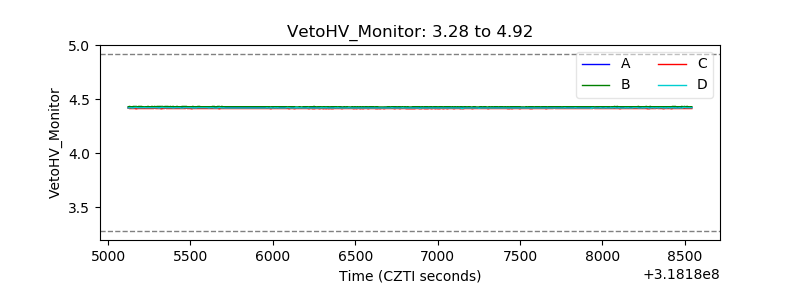 |
| Veto LLD | 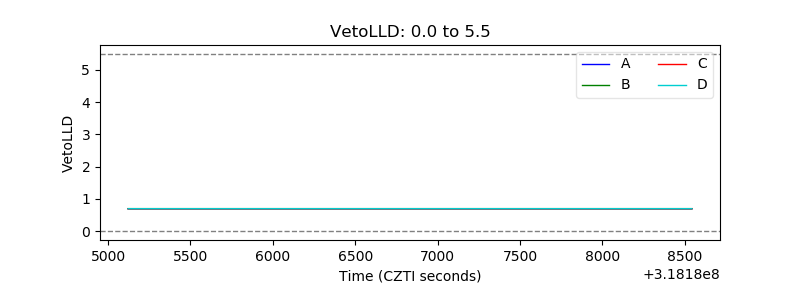 |
| Alpha Counter |  |
| _CPM_Rate | 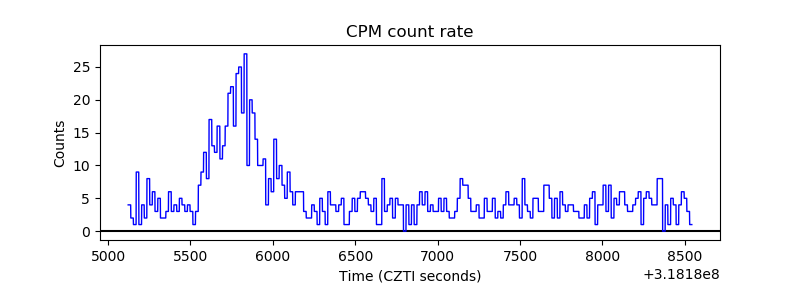 |
| CZT Counter | 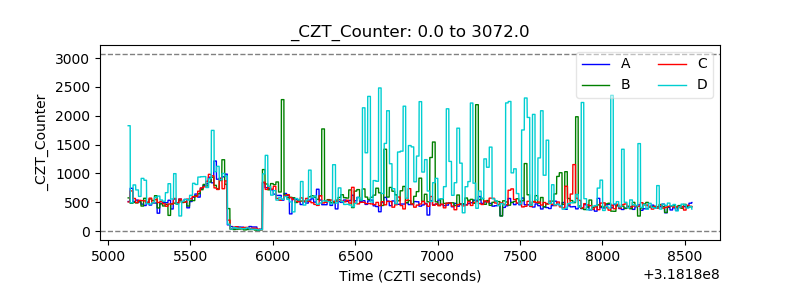 |
| +2.5 Volts monitor |  |
| +5 Volts monitor |  |
| _ROLL_ROT | 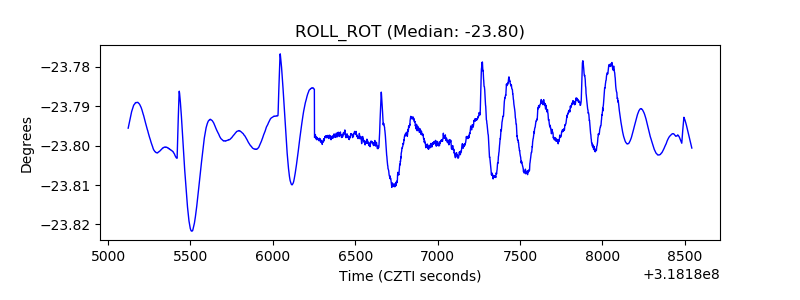 |
| _Roll_DEC | 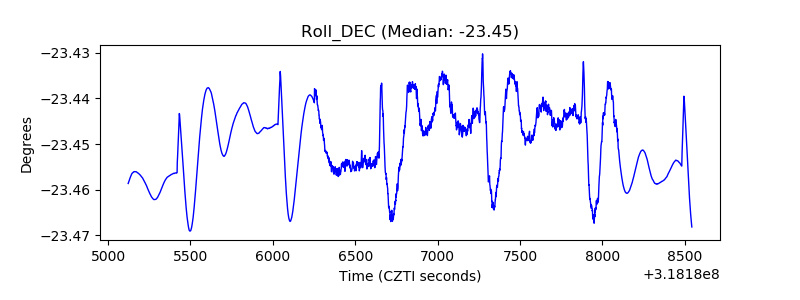 |
| _Roll_RA | 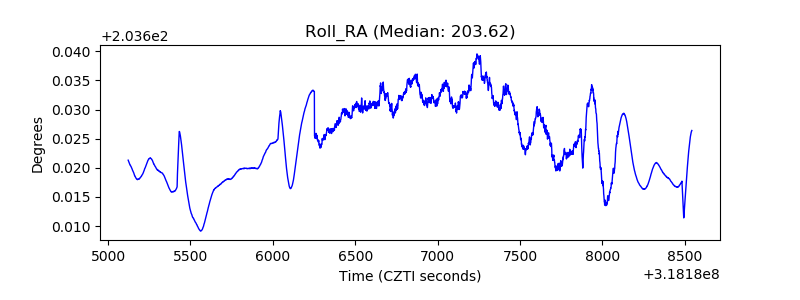 |
| Veto Counter | 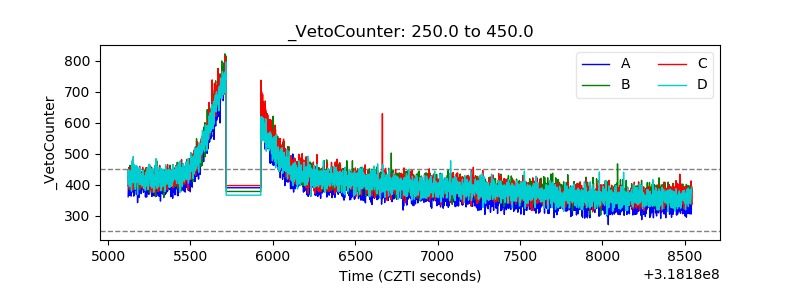 |