| Param | Original file | Final file |
|---|---|---|
| Filename | modeM0/AS1C05_002T05_9000003472cztM0_level2.fits | modeM0/AS1C05_002T05_9000003472cztM0_level2_quad_clean.evt |
| Size (bytes) | 47,321,280 | 13,965,120 |
| Size | 45.1 MB | 13.3 MB |
| Events in quadrant A | 287,654 | 20,343 |
| Events in quadrant B | 275,300 | 20,599 |
| Events in quadrant C | 279,832 | 19,528 |
| Events in quadrant D | 247,316 | 17,729 |
| Mode SS | |||
|---|---|---|---|
| Quadrant | BADHDUFLAG | Total packets | Discarded packets |
| A | 0 | 100 | 0 |
| B | 0 | 100 | 0 |
| C | 0 | 100 | 0 |
| D | 0 | 100 | 0 |
| Mode M9 | |||
|---|---|---|---|
| Quadrant | BADHDUFLAG | Total packets | Discarded packets |
| A | 0 | 4 | 0 |
| B | 0 | 4 | 0 |
| C | 0 | 4 | 0 |
| D | 0 | 4 | 0 |
| Mode M0 | |||
|---|---|---|---|
| Quadrant | BADHDUFLAG | Total packets | Discarded packets |
| A | 0 | 10016 | 0 |
| B | 0 | 10085 | 0 |
| C | 0 | 10028 | 0 |
| D | 0 | 12710 | 0 |
| Quadrant | Total seconds | Saturated seconds | Saturation percentage |
|---|---|---|---|
| A | 4890 | 89 | 1.820041% |
| B | 4890 | 107 | 2.188139% |
| C | 4890 | 103 | 2.106339% |
| D | 4890 | 136 | 2.781186% |
Noise dominated data is calculated using 1-second bins in cleaned event files. If a bin has >2000 counts, and if more than 50% of those come from <1% of pixels, then it is considered to be noise-dominated and hence unusable.
| Quadrant | # 1 sec bins | Bins with >0 counts | Bins with >2000 counts | High rate bins dominated by noise | Noise dominated (total time) | Noise dominated (detector-on time) | Marked lightcurve |
|---|---|---|---|---|---|---|---|
| A | 4889 | 4889 | 0 | 0 | 0.00% | 0.00% |  |
| B | 4889 | 4889 | 0 | 0 | 0.00% | 0.00% |  |
| C | 4889 | 4889 | 0 | 0 | 0.00% | 0.00% |  |
| D | 4889 | 4889 | 0 | 0 | 0.00% | 0.00% |  |
Top three noisy pixels from each quadrant. If the there are fewer than three noisy pixels in the level2.evt file, extra rows are filled as -1
| Pixel properties | Quadrant properties | ||||||
|---|---|---|---|---|---|---|---|
| Quadrant | DetID | PixID | Counts | Sigma | Mean | Median | Sigma |
| A | 0 | 29 | 271 | 9.79 | 74 | 70 | 20.5 |
| A | 7 | 110 | 260 | 9.26 | 74 | 70 | 20.5 |
| A | 14 | 95 | 213 | 6.97 | 74 | 70 | 20.5 |
| B | 2 | 9 | 205 | 8.12 | 72 | 69 | 16.7 |
| B | 2 | 8 | 191 | 7.28 | 72 | 69 | 16.7 |
| B | 3 | 17 | 188 | 7.11 | 72 | 69 | 16.7 |
| C | 3 | 235 | 207 | 6.7 | 74 | 70 | 20.5 |
| C | 3 | 126 | 201 | 6.4 | 74 | 70 | 20.5 |
| C | 2 | 191 | 200 | 6.36 | 74 | 70 | 20.5 |
| D | 4 | 246 | 195 | 6.58 | 70 | 64 | 19.9 |
| D | 3 | 31 | 190 | 6.32 | 70 | 64 | 19.9 |
| D | 13 | 238 | 189 | 6.27 | 70 | 64 | 19.9 |
Histogram calculated using DETX and DETY for each event in the final _common_clean file
| Quadrant A |  |
 |
Quadrant B |
|---|---|---|---|
| Quadrant D |  |
 |
Quadrant C |
| Plot type | Count rate plots | Images |
|---|---|---|
| Comparison with Poisson distribution Blue bars denote a histogram of data divided into 1 sec bins. Red curve is a Poisson curve with rate = median count rate of data. |
 |
 |
| Quadrant-wise count rates Data is divided into 100 sec bins |
 |
|
| Module-wise count rates for Quadrant A Data is divided into 100 sec bins |
 |
 |
| Module-wise count rates for Quadrant B Data is divided into 100 sec bins |
 |
 |
| Module-wise count rates for Quadrant C Data is divided into 100 sec bins |
 |
 |
| Module-wise count rates for Quadrant D Data is divided into 100 sec bins |
 |
 |
| Parameter | Plot |
|---|---|
| CZT HV Monitor |  |
| D_VDD | 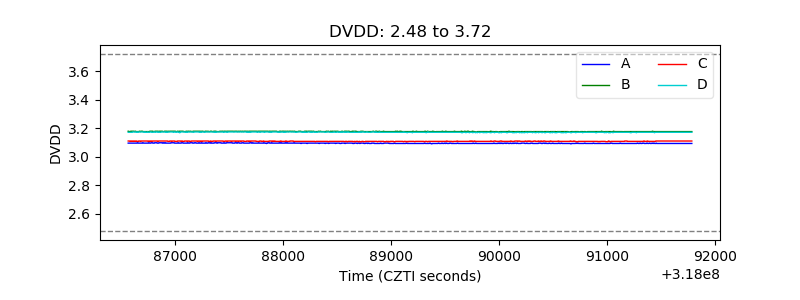 |
| Temperature 1 |  |
| Veto HV Monitor |  |
| Veto LLD |  |
| Alpha Counter |  |
| _CPM_Rate |  |
| CZT Counter |  |
| +2.5 Volts monitor |  |
| +5 Volts monitor |  |
| _ROLL_ROT |  |
| _Roll_DEC |  |
| _Roll_RA |  |
| Veto Counter |  |