| Param | Original file | Final file |
|---|---|---|
| Filename | modeM0/AS1C05_002T05_9000003472_23467cztM0_level2.evt | modeM0/AS1C05_002T05_9000003472_23467cztM0_level2_quad_clean.evt |
| Size (bytes) | 346,078,080 | 69,989,760 |
| Size | 330.0 MB | 66.7 MB |
| Events in quadrant A | 2,293,699 | 450,272 |
| Events in quadrant B | 2,371,441 | 453,332 |
| Events in quadrant C | 2,349,801 | 438,250 |
| Events in quadrant D | 3,132,842 | 434,281 |
| Mode SS | |||
|---|---|---|---|
| Quadrant | BADHDUFLAG | Total packets | Discarded packets |
| A | 0 | 100 | 0 |
| B | 0 | 100 | 0 |
| C | 0 | 100 | 0 |
| D | 0 | 100 | 0 |
| Mode M9 | |||
|---|---|---|---|
| Quadrant | BADHDUFLAG | Total packets | Discarded packets |
| A | 0 | 4 | 0 |
| B | 0 | 4 | 0 |
| C | 0 | 4 | 0 |
| D | 0 | 4 | 0 |
| Mode M0 | |||
|---|---|---|---|
| Quadrant | BADHDUFLAG | Total packets | Discarded packets |
| A | 0 | 10016 | 0 |
| B | 0 | 10085 | 0 |
| C | 0 | 10028 | 0 |
| D | 0 | 12710 | 0 |
| Quadrant | Total seconds | Saturated seconds | Saturation percentage |
|---|---|---|---|
| A | 4890 | 89 | 1.820041% |
| B | 4890 | 107 | 2.188139% |
| C | 4890 | 103 | 2.106339% |
| D | 4890 | 136 | 2.781186% |
Noise dominated data is calculated using 1-second bins in cleaned event files. If a bin has >2000 counts, and if more than 50% of those come from <1% of pixels, then it is considered to be noise-dominated and hence unusable.
| Quadrant | # 1 sec bins | Bins with >0 counts | Bins with >2000 counts | High rate bins dominated by noise | Noise dominated (total time) | Noise dominated (detector-on time) | Marked lightcurve |
|---|---|---|---|---|---|---|---|
| A | 4889 | 4889 | 0 | 0 | 0.00% | 0.00% | 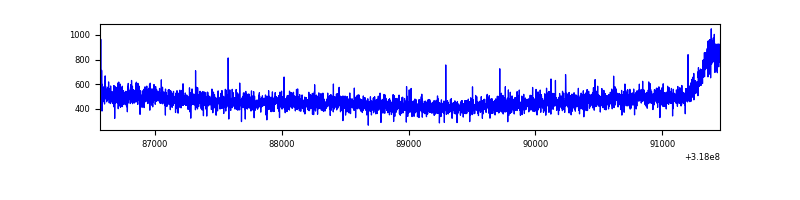 |
| B | 4889 | 4889 | 0 | 0 | 0.00% | 0.00% | 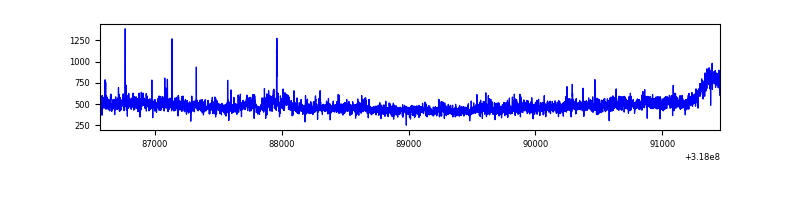 |
| C | 4889 | 4889 | 0 | 0 | 0.00% | 0.00% | 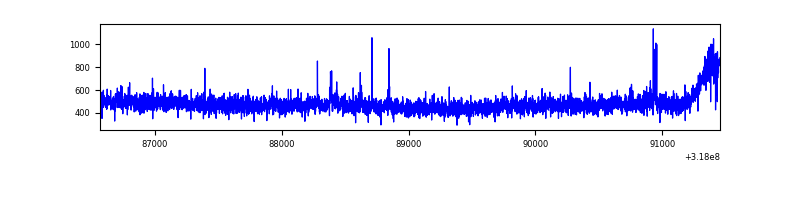 |
| D | 4889 | 4889 | 50 | 50 | 1.02% | 1.02% | 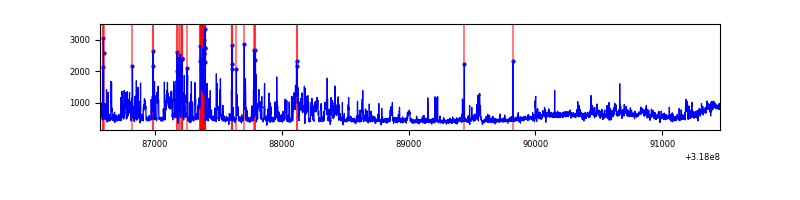 |
Top three noisy pixels from each quadrant. If the there are fewer than three noisy pixels in the level2.evt file, extra rows are filled as -1
| Pixel properties | Quadrant properties | ||||||
|---|---|---|---|---|---|---|---|
| Quadrant | DetID | PixID | Counts | Sigma | Mean | Median | Sigma |
| A | 13 | 254 | 9398 | 73.09 | 592 | 579 | 120.7 |
| A | 0 | 226 | 5172 | 38.06 | 592 | 579 | 120.7 |
| A | 3 | 137 | 5105 | 37.51 | 592 | 579 | 120.7 |
| B | 0 | 219 | 20897 | 178.84 | 587 | 573 | 113.6 |
| B | 0 | 229 | 19675 | 168.09 | 587 | 573 | 113.6 |
| B | 0 | 190 | 16997 | 144.52 | 587 | 573 | 113.6 |
| C | 14 | 238 | 90173 | 672.62 | 567 | 570 | 133.2 |
| C | 1 | 16 | 15019 | 108.46 | 567 | 570 | 133.2 |
| C | 7 | 247 | 14095 | 101.53 | 567 | 570 | 133.2 |
| D | 7 | 238 | 599143 | 4270.65 | 575 | 558 | 140.2 |
| D | 1 | 52 | 175430 | 1247.64 | 575 | 558 | 140.2 |
| D | 14 | 50 | 68941 | 487.88 | 575 | 558 | 140.2 |
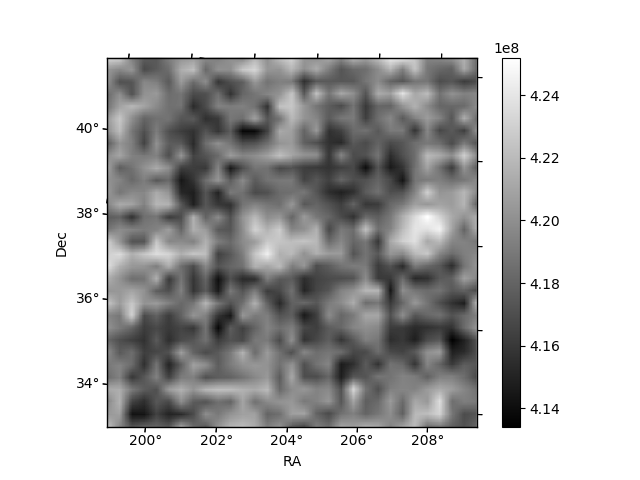
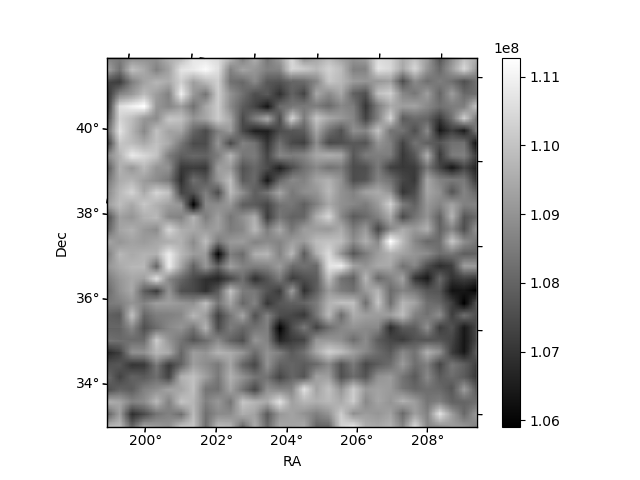
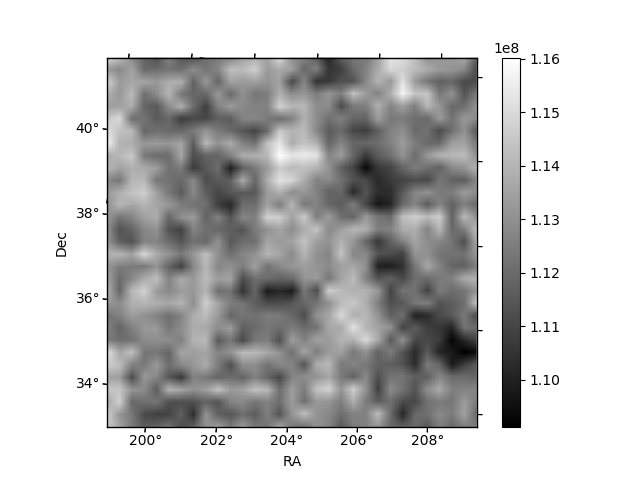
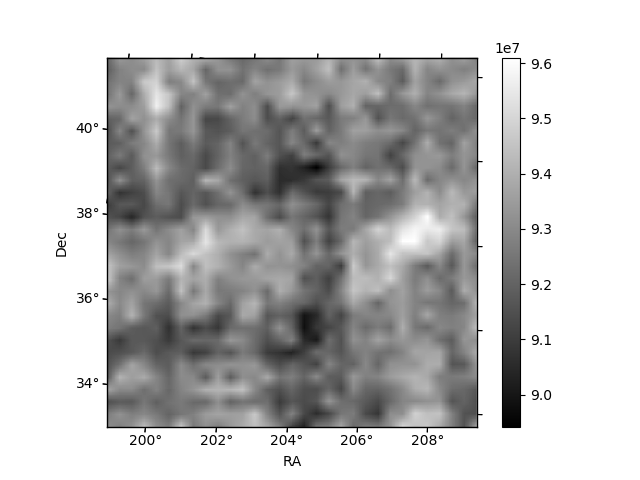
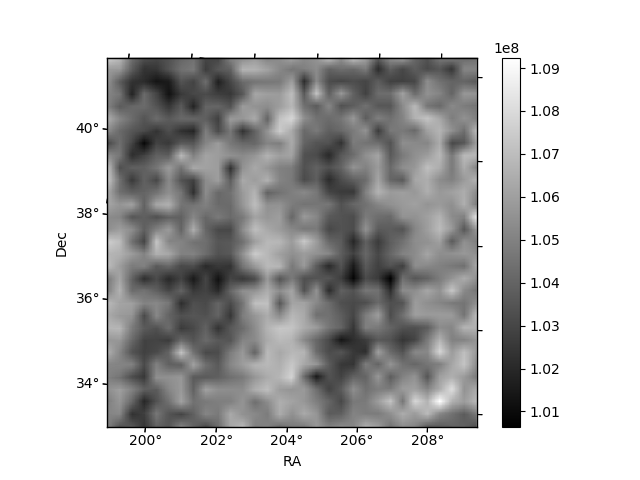
Histogram calculated using DETX and DETY for each event in the final _common_clean file
| Quadrant A | 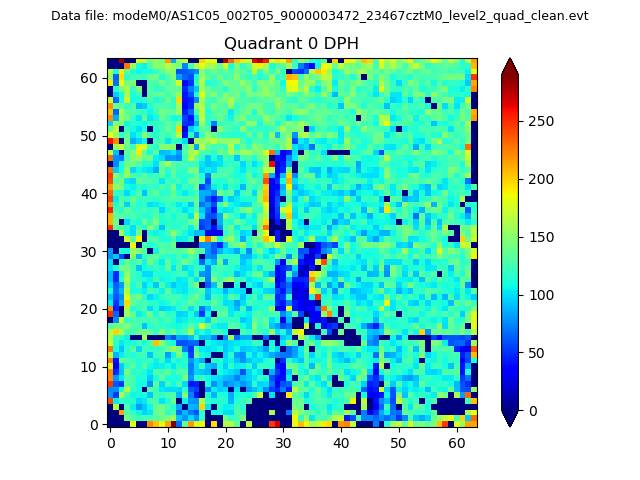 |
 |
Quadrant B |
|---|---|---|---|
| Quadrant D | 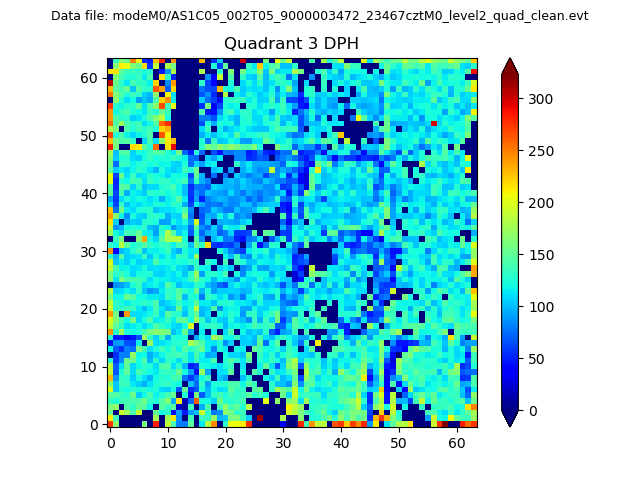 |
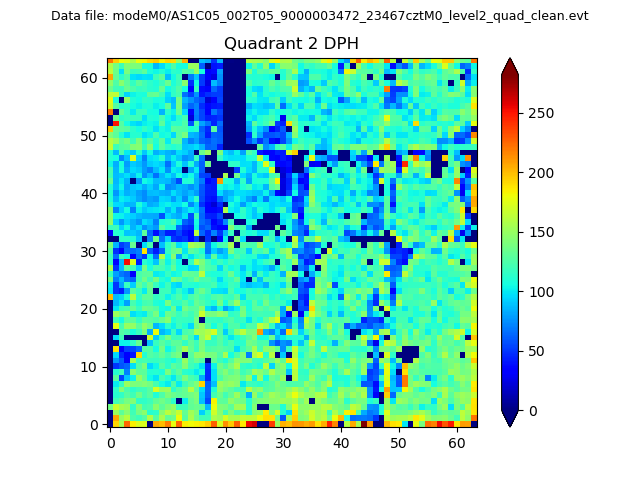 |
Quadrant C |
| Plot type | Count rate plots | Images |
|---|---|---|
| Comparison with Poisson distribution Blue bars denote a histogram of data divided into 1 sec bins. Red curve is a Poisson curve with rate = median count rate of data. |
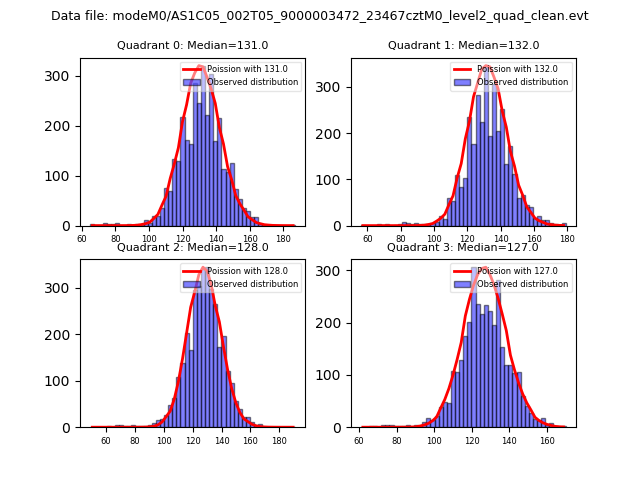 |
 |
| Quadrant-wise count rates Data is divided into 100 sec bins |
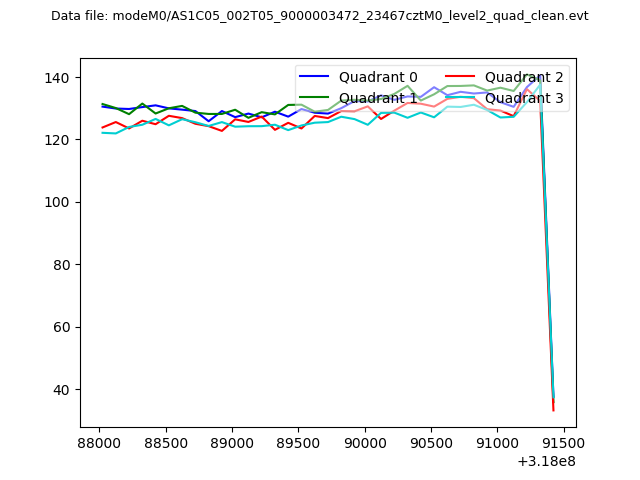 |
|
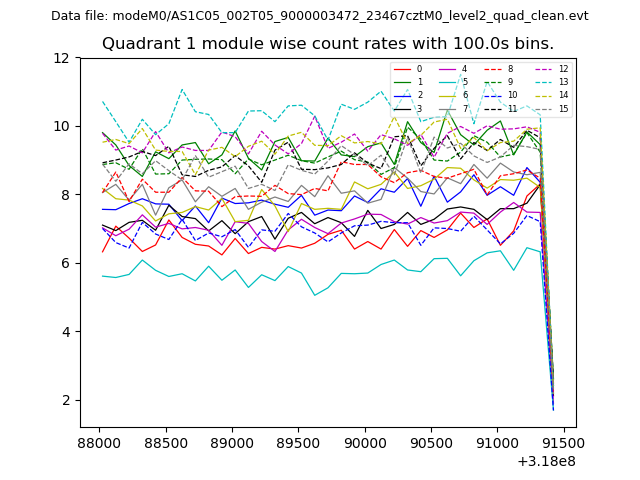
| Module-wise count rates for Quadrant A Data is divided into 100 sec bins |
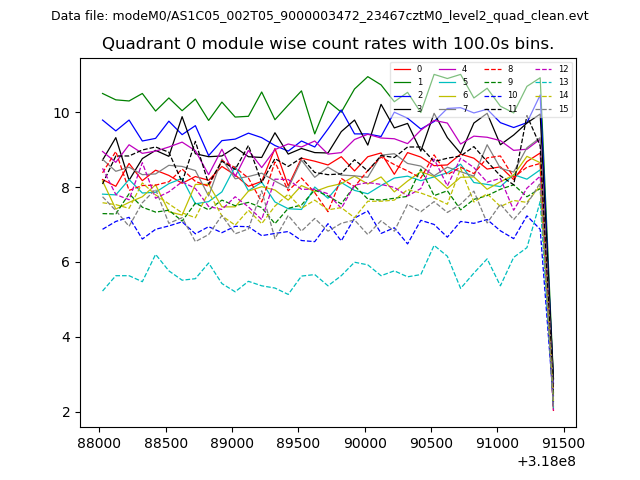 |
 |
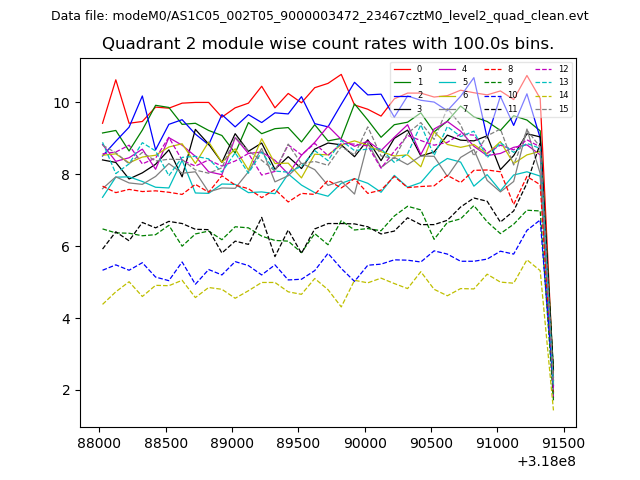
| Module-wise count rates for Quadrant B Data is divided into 100 sec bins |
 |
 |
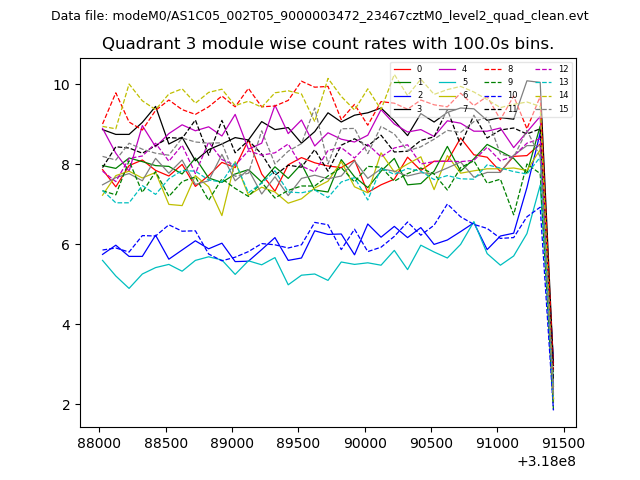
| Module-wise count rates for Quadrant C Data is divided into 100 sec bins |
 |
 |
| Module-wise count rates for Quadrant D Data is divided into 100 sec bins |
 |
 |
| Parameter | Plot |
|---|---|
| CZT HV Monitor | 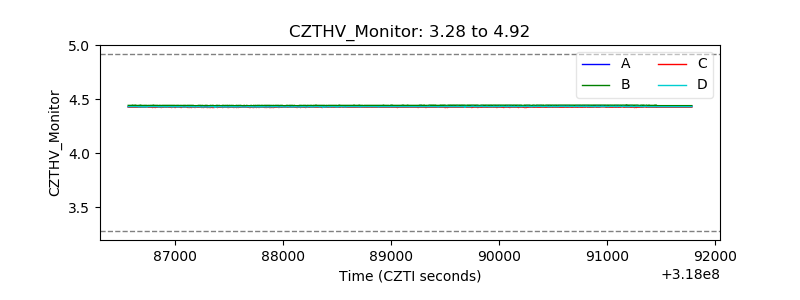 |
| D_VDD | 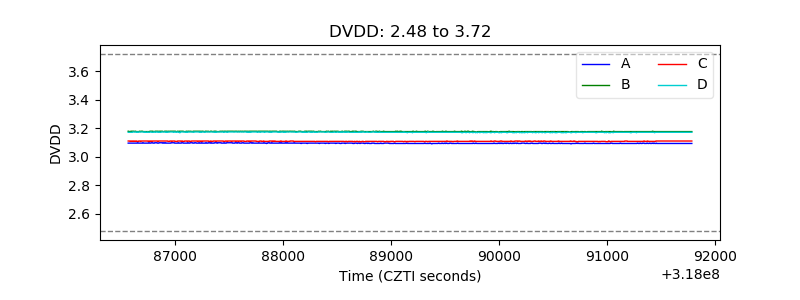 |
| Temperature 1 | 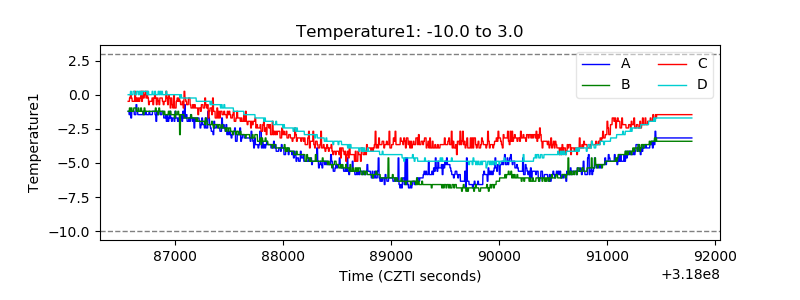 |
| Veto HV Monitor | 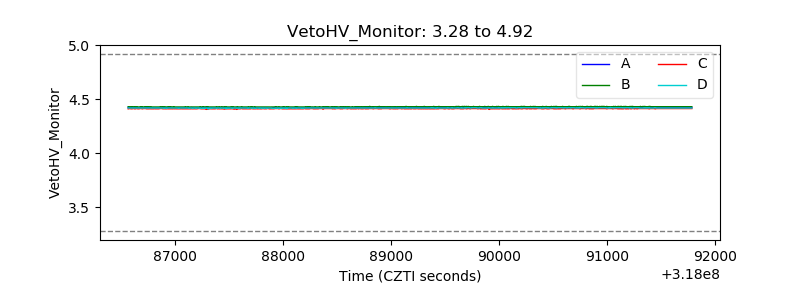 |
| Veto LLD | 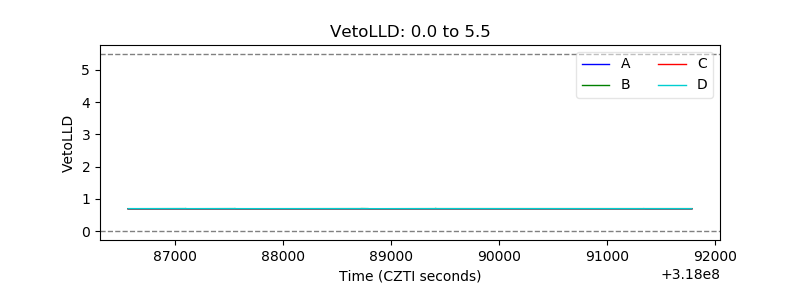 |
| Alpha Counter | 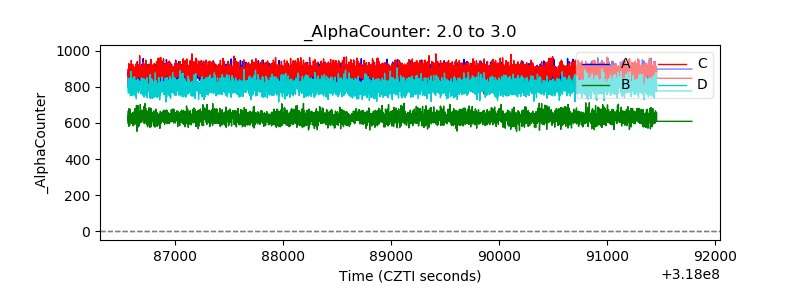 |
| _CPM_Rate | 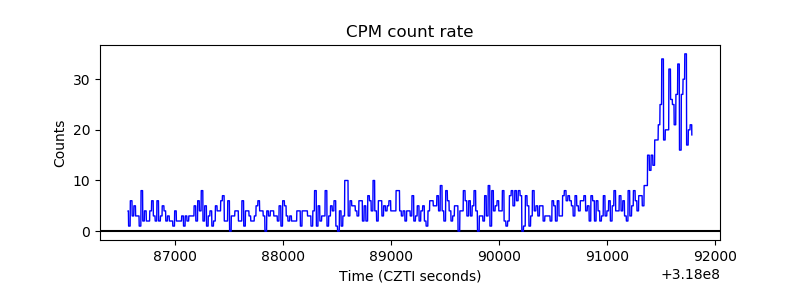 |
| CZT Counter | 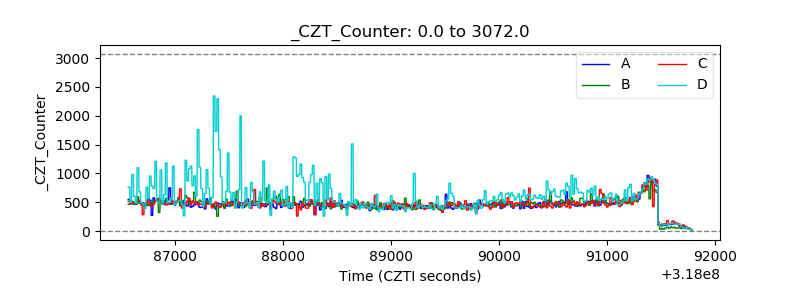 |
| +2.5 Volts monitor | 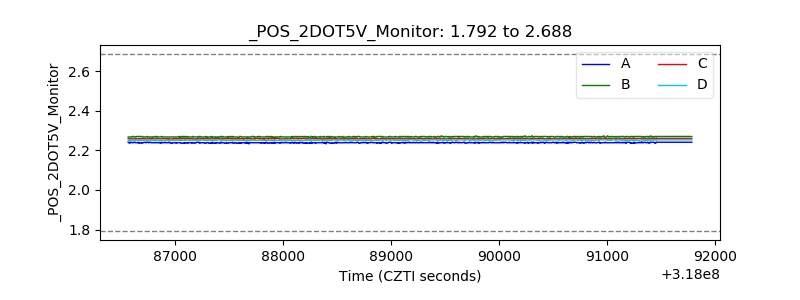 |
| +5 Volts monitor | 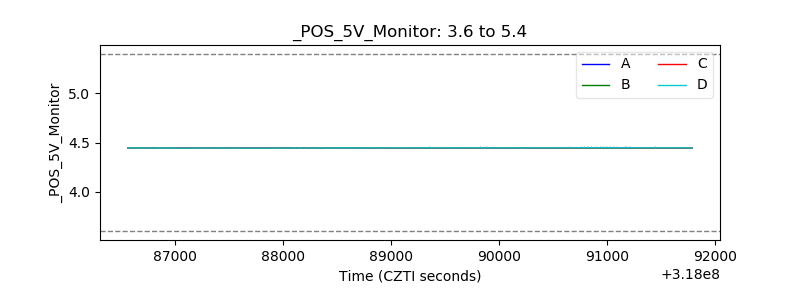 |
| _ROLL_ROT | 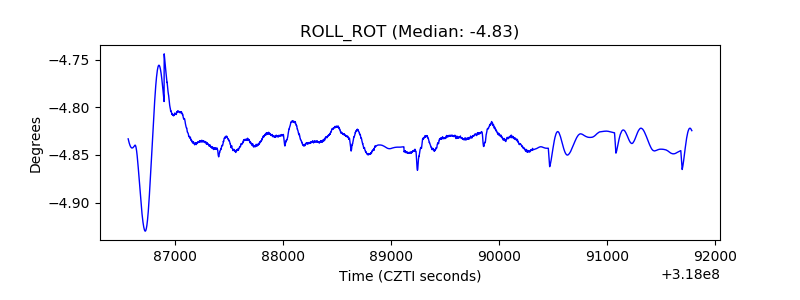 |
| _Roll_DEC |  |
| _Roll_RA | 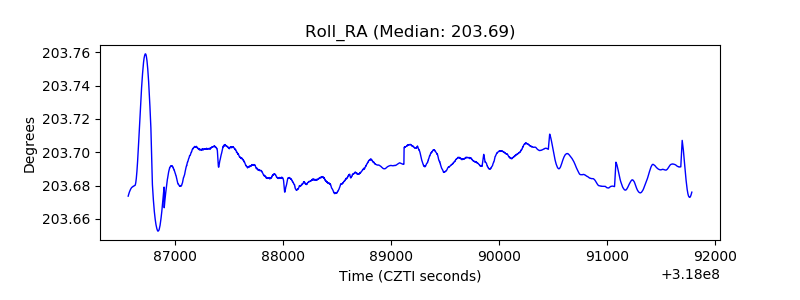 |
| Veto Counter | 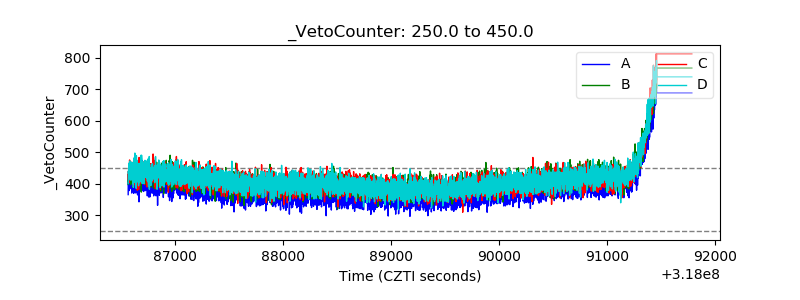 |