| Param | Original file | Final file |
|---|---|---|
| Filename | modeM0/AS1A07_100T02_9000003476cztM0_level2.fits | modeM0/AS1A07_100T02_9000003476cztM0_level2_quad_clean.evt |
| Size (bytes) | 353,597,760 | 360,397,440 |
| Size | 337.2 MB | 343.7 MB |
| Events in quadrant A | 2,183,122 | 2,231,489 |
| Events in quadrant B | 2,088,532 | 2,240,819 |
| Events in quadrant C | 2,125,100 | 2,094,764 |
| Events in quadrant D | 1,828,304 | 1,864,821 |
| Mode SS | |||
|---|---|---|---|
| Quadrant | BADHDUFLAG | Total packets | Discarded packets |
| A | 0 | 732 | 0 |
| B | 0 | 732 | 0 |
| C | 0 | 736 | 0 |
| D | 0 | 726 | 0 |
| Mode M9 | |||
|---|---|---|---|
| Quadrant | BADHDUFLAG | Total packets | Discarded packets |
| A | 0 | 66 | 0 |
| B | 0 | 67 | 0 |
| C | 0 | 66 | 0 |
| D | 0 | 66 | 0 |
| Mode M0 | |||
|---|---|---|---|
| Quadrant | BADHDUFLAG | Total packets | Discarded packets |
| A | 0 | 74192 | 0 |
| B | 0 | 80639 | 0 |
| C | 0 | 85088 | 0 |
| D | 0 | 101130 | 0 |
| Quadrant | Total seconds | Saturated seconds | Saturation percentage |
|---|---|---|---|
| A | 36158 | 215 | 0.594613% |
| B | 36161 | 502 | 1.388236% |
| C | 36167 | 1296 | 3.583377% |
| D | 36125 | 2483 | 6.873356% |
Noise dominated data is calculated using 1-second bins in cleaned event files. If a bin has >2000 counts, and if more than 50% of those come from <1% of pixels, then it is considered to be noise-dominated and hence unusable.
| Quadrant | # 1 sec bins | Bins with >0 counts | Bins with >2000 counts | High rate bins dominated by noise | Noise dominated (total time) | Noise dominated (detector-on time) | Marked lightcurve |
|---|---|---|---|---|---|---|---|
| A | 42153 | 35752 | 0 | 0 | 0.00% | 0.00% |  |
| B | 42153 | 35748 | 0 | 0 | 0.00% | 0.00% |  |
| C | 42153 | 35747 | 0 | 0 | 0.00% | 0.00% |  |
| D | 42153 | 35705 | 0 | 0 | 0.00% | 0.00% |  |
Top three noisy pixels from each quadrant. If the there are fewer than three noisy pixels in the level2.evt file, extra rows are filled as -1
| Pixel properties | Quadrant properties | ||||||
|---|---|---|---|---|---|---|---|
| Quadrant | DetID | PixID | Counts | Sigma | Mean | Median | Sigma |
| A | 0 | 29 | 2152 | 11.43 | 568 | 534 | 141.6 |
| A | 7 | 110 | 1693 | 8.19 | 568 | 534 | 141.6 |
| A | 0 | 30 | 1658 | 7.94 | 568 | 534 | 141.6 |
| B | 2 | 9 | 1672 | 10.34 | 553 | 530 | 110.4 |
| B | 2 | 8 | 1466 | 8.48 | 553 | 530 | 110.4 |
| B | 5 | 255 | 1421 | 8.07 | 553 | 530 | 110.4 |
| C | 3 | 126 | 1490 | 6.78 | 561 | 529 | 141.8 |
| C | 12 | 241 | 1482 | 6.72 | 561 | 529 | 141.8 |
| C | 3 | 187 | 1454 | 6.52 | 561 | 529 | 141.8 |
| D | 15 | 46 | 1365 | 6.42 | 522 | 479 | 138.0 |
| D | 3 | 14 | 1357 | 6.36 | 522 | 479 | 138.0 |
| D | 6 | 231 | 1264 | 5.69 | 522 | 479 | 138.0 |
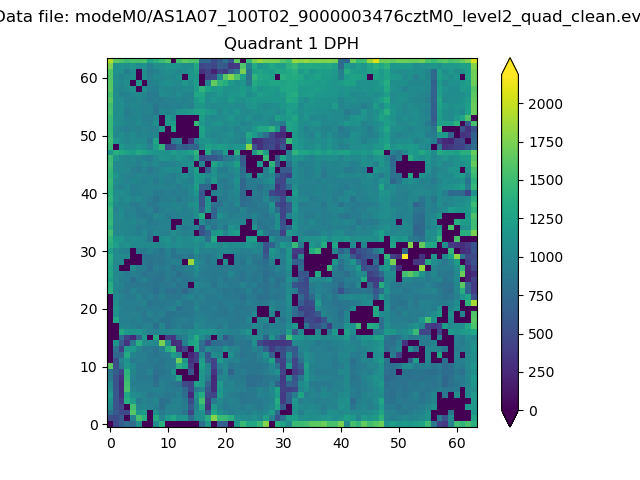
Histogram calculated using DETX and DETY for each event in the final _common_clean file
| Quadrant A |  |
 |
Quadrant B |
|---|---|---|---|
| Quadrant D | 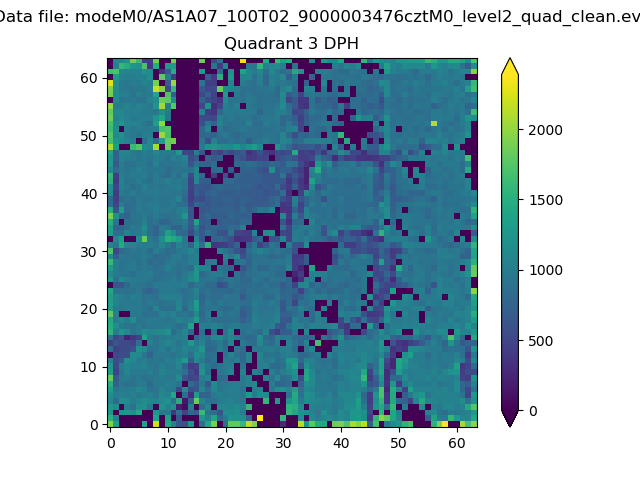 |
 |
Quadrant C |
| Plot type | Count rate plots | Images |
|---|---|---|
| Comparison with Poisson distribution Blue bars denote a histogram of data divided into 1 sec bins. Red curve is a Poisson curve with rate = median count rate of data. |
 |
 |
| Quadrant-wise count rates Data is divided into 100 sec bins |
 |
|
| Module-wise count rates for Quadrant A Data is divided into 100 sec bins |
 |
 |
| Module-wise count rates for Quadrant B Data is divided into 100 sec bins |
 |
 |
| Module-wise count rates for Quadrant C Data is divided into 100 sec bins |
 |
 |
| Module-wise count rates for Quadrant D Data is divided into 100 sec bins |
 |
 |
| Parameter | Plot |
|---|---|
| CZT HV Monitor |  |
| D_VDD |  |
| Temperature 1 |  |
| Veto HV Monitor |  |
| Veto LLD |  |
| Alpha Counter |  |
| _CPM_Rate |  |
| CZT Counter |  |
| +2.5 Volts monitor |  |
| +5 Volts monitor |  |
| _ROLL_ROT |  |
| _Roll_DEC |  |
| _Roll_RA |  |
| Veto Counter |  |