| Param | Original file | Final file |
|---|---|---|
| Filename | modeM0/AS1A07_100T02_9000003476_23486cztM0_level2.evt | modeM0/AS1A07_100T02_9000003476_23486cztM0_level2_quad_clean.evt |
| Size (bytes) | 1,153,664,640 | 239,163,840 |
| Size | 1.1 GB | 228.1 MB |
| Events in quadrant A | 7,127,004 | 1,589,211 |
| Events in quadrant B | 7,830,998 | 1,598,193 |
| Events in quadrant C | 7,946,948 | 1,522,101 |
| Events in quadrant D | 10,991,142 | 1,470,278 |
| Mode SS | |||
|---|---|---|---|
| Quadrant | BADHDUFLAG | Total packets | Discarded packets |
| A | 0 | 314 | 0 |
| B | 0 | 314 | 0 |
| C | 0 | 314 | 0 |
| D | 0 | 314 | 0 |
| Mode M9 | |||
|---|---|---|---|
| Quadrant | BADHDUFLAG | Total packets | Discarded packets |
| A | 0 | 18 | 0 |
| B | 0 | 18 | 0 |
| C | 0 | 18 | 0 |
| D | 0 | 18 | 0 |
| Mode M0 | |||
|---|---|---|---|
| Quadrant | BADHDUFLAG | Total packets | Discarded packets |
| A | 0 | 31411 | 2 |
| B | 0 | 33147 | 2 |
| C | 0 | 33485 | 2 |
| D | 0 | 43268 | 2 |
| Quadrant | Total seconds | Saturated seconds | Saturation percentage |
|---|---|---|---|
| A | 15420 | 116 | 0.752270% |
| B | 15420 | 194 | 1.258106% |
| C | 15420 | 295 | 1.913100% |
| D | 15420 | 1047 | 6.789883% |
Noise dominated data is calculated using 1-second bins in cleaned event files. If a bin has >2000 counts, and if more than 50% of those come from <1% of pixels, then it is considered to be noise-dominated and hence unusable.
| Quadrant | # 1 sec bins | Bins with >0 counts | Bins with >2000 counts | High rate bins dominated by noise | Noise dominated (total time) | Noise dominated (detector-on time) | Marked lightcurve |
|---|---|---|---|---|---|---|---|
| A | 17240 | 15420 | 3 | 3 | 0.02% | 0.02% | 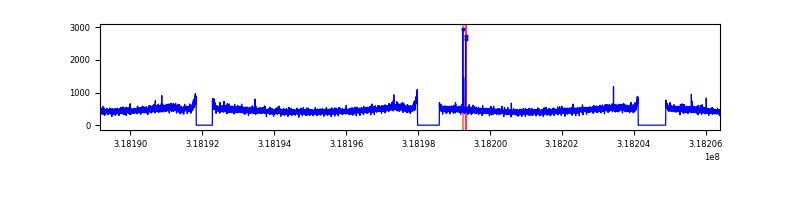 |
| B | 17240 | 15420 | 23 | 23 | 0.13% | 0.15% | 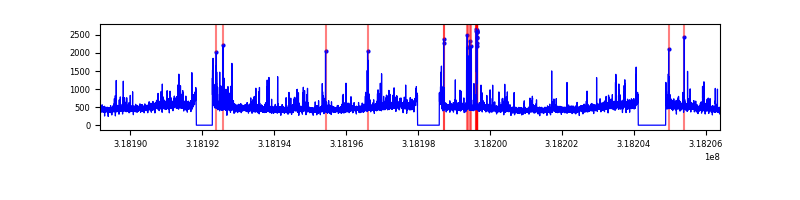 |
| C | 17239 | 15421 | 109 | 109 | 0.63% | 0.71% | 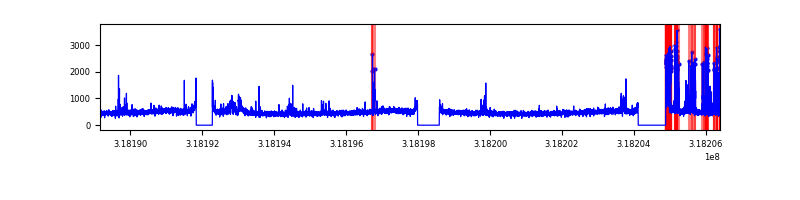 |
| D | 17240 | 15422 | 867 | 867 | 5.03% | 5.62% | 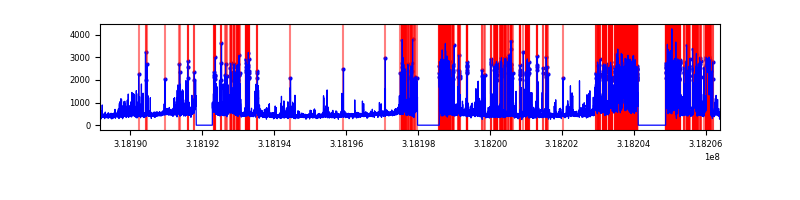 |
Top three noisy pixels from each quadrant. If the there are fewer than three noisy pixels in the level2.evt file, extra rows are filled as -1
| Pixel properties | Quadrant properties | ||||||
|---|---|---|---|---|---|---|---|
| Quadrant | DetID | PixID | Counts | Sigma | Mean | Median | Sigma |
| A | 13 | 254 | 25946 | 65.11 | 1838 | 1793 | 371.0 |
| A | 10 | 253 | 18509 | 45.06 | 1838 | 1793 | 371.0 |
| A | 3 | 137 | 16250 | 38.97 | 1838 | 1793 | 371.0 |
| B | 0 | 189 | 392190 | 1131.54 | 1831 | 1783 | 345.0 |
| B | 0 | 230 | 66712 | 188.19 | 1831 | 1783 | 345.0 |
| B | 0 | 229 | 47406 | 132.23 | 1831 | 1783 | 345.0 |
| C | 2 | 16 | 570260 | 1387.48 | 1762 | 1771 | 409.7 |
| C | 14 | 238 | 279699 | 678.32 | 1762 | 1771 | 409.7 |
| C | 7 | 247 | 93065 | 222.82 | 1762 | 1771 | 409.7 |
| D | 1 | 52 | 3489402 | 8303.91 | 1746 | 1700 | 420.0 |
| D | 9 | 35 | 412491 | 978.06 | 1746 | 1700 | 420.0 |
| D | 13 | 104 | 108061 | 253.24 | 1746 | 1700 | 420.0 |
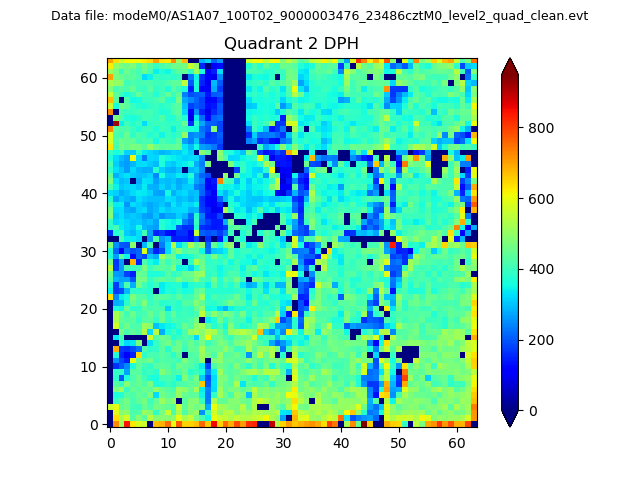
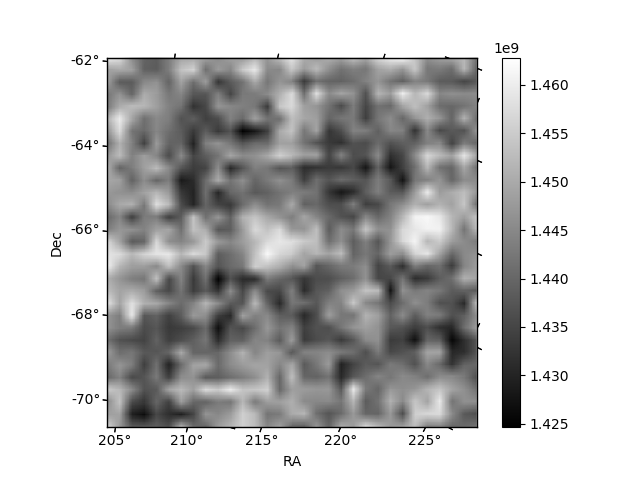
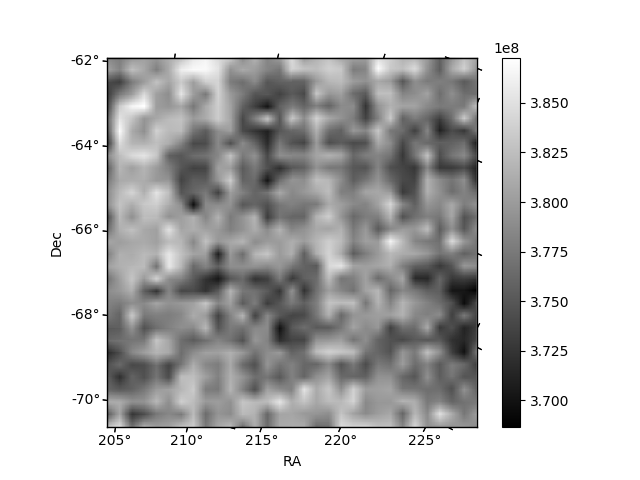
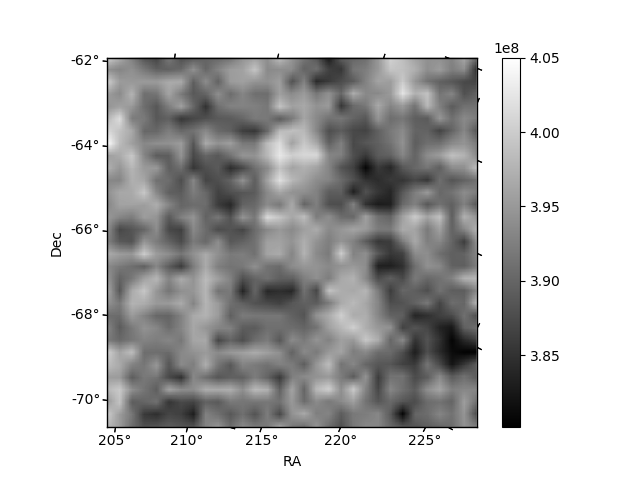
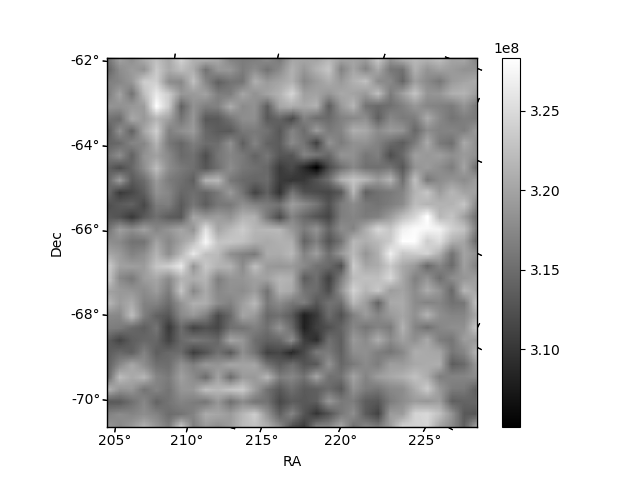
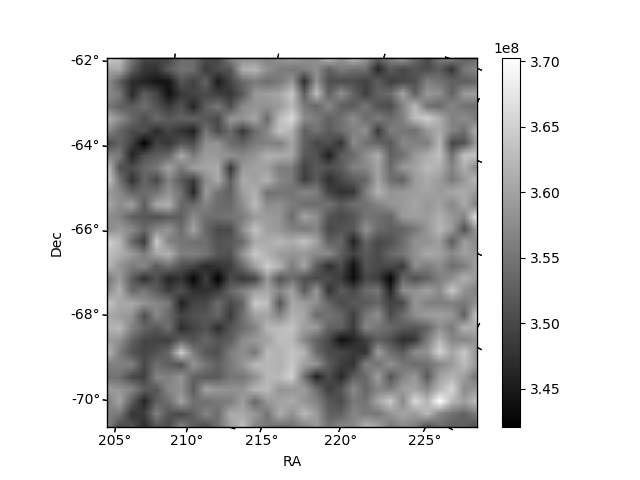
Histogram calculated using DETX and DETY for each event in the final _common_clean file
| Quadrant A | 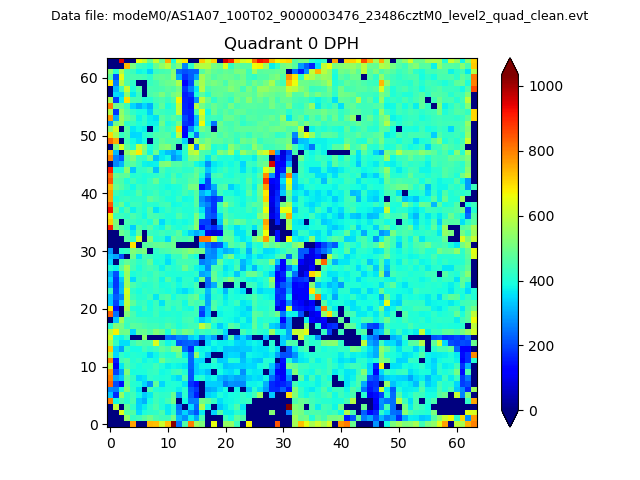 |
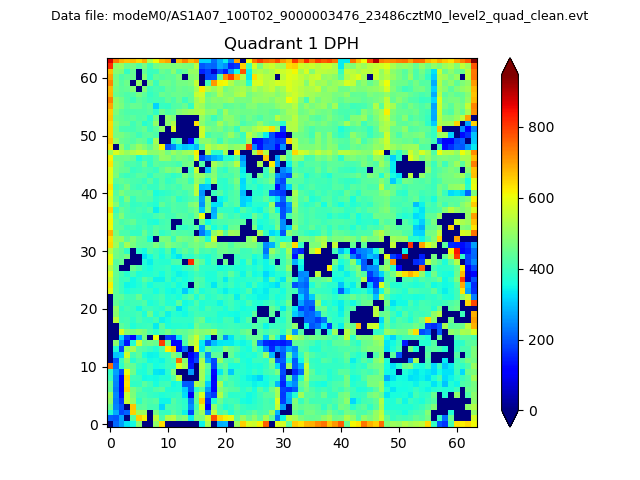 |
Quadrant B |
|---|---|---|---|
| Quadrant D | 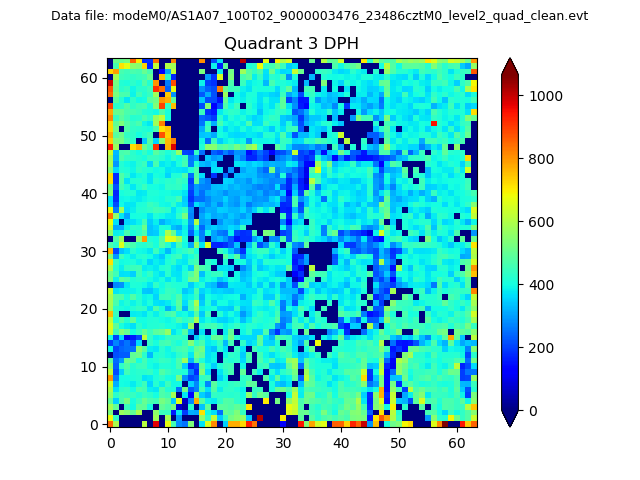 |
 |
Quadrant C |
| Plot type | Count rate plots | Images |
|---|---|---|
| Comparison with Poisson distribution Blue bars denote a histogram of data divided into 1 sec bins. Red curve is a Poisson curve with rate = median count rate of data. |
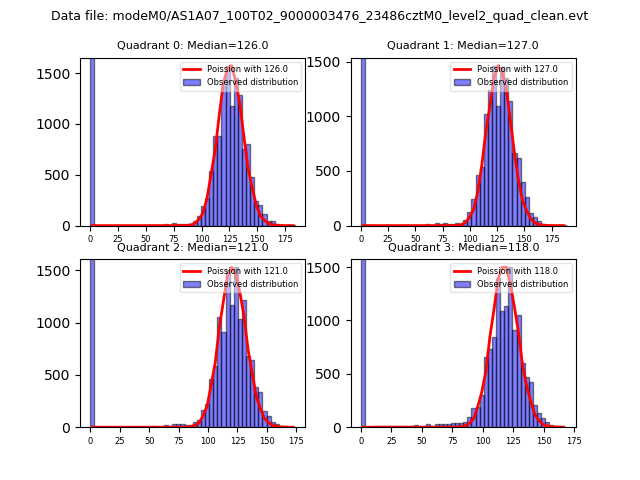 |
 |
| Quadrant-wise count rates Data is divided into 100 sec bins |
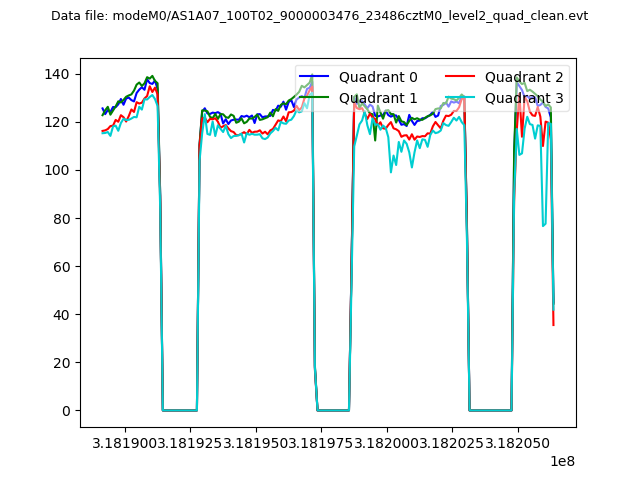 |
|
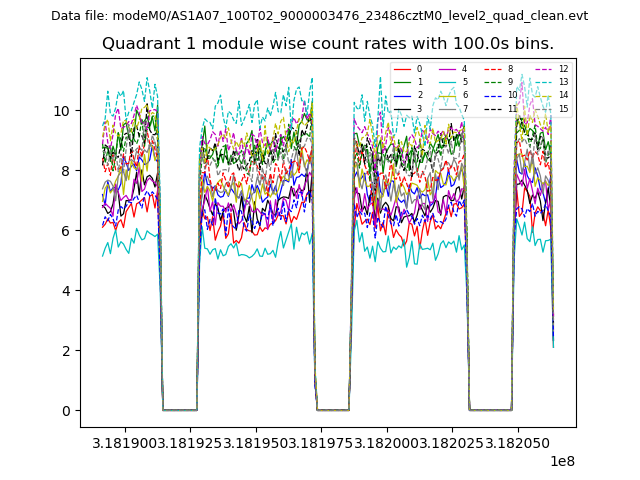
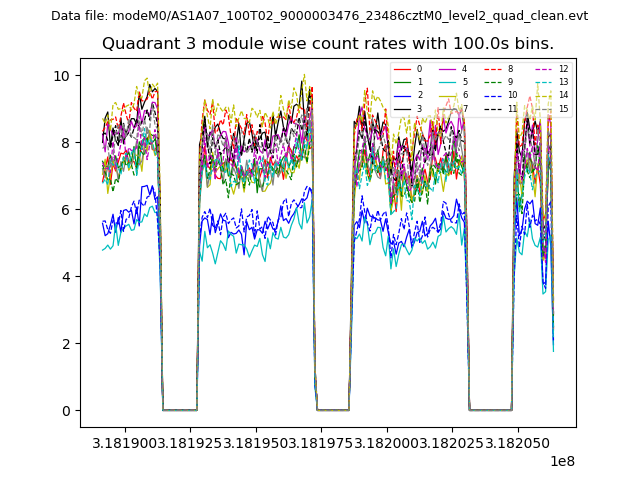
| Module-wise count rates for Quadrant A Data is divided into 100 sec bins |
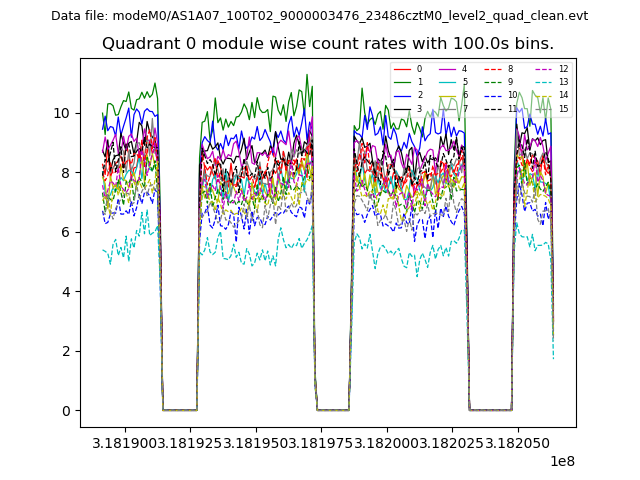 |
 |
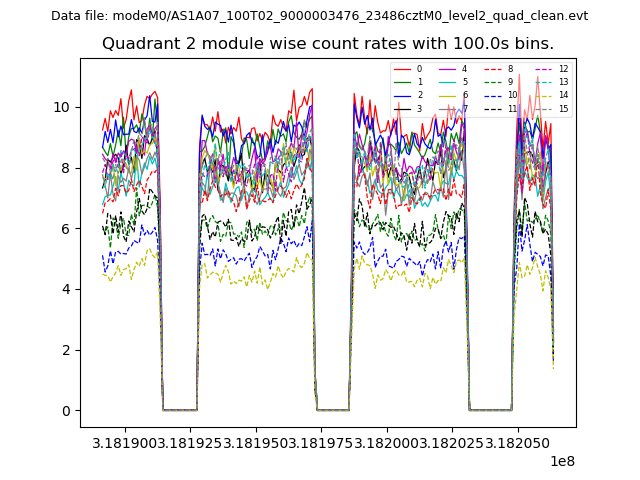
| Module-wise count rates for Quadrant B Data is divided into 100 sec bins |
 |
 |
| Module-wise count rates for Quadrant C Data is divided into 100 sec bins |
 |
 |
| Module-wise count rates for Quadrant D Data is divided into 100 sec bins |
 |
 |
| Parameter | Plot |
|---|---|
| CZT HV Monitor | 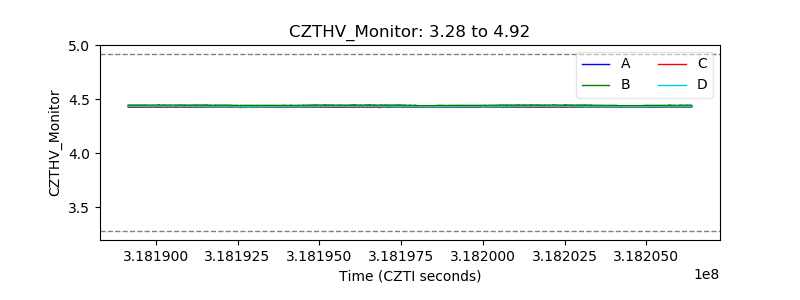 |
| D_VDD | 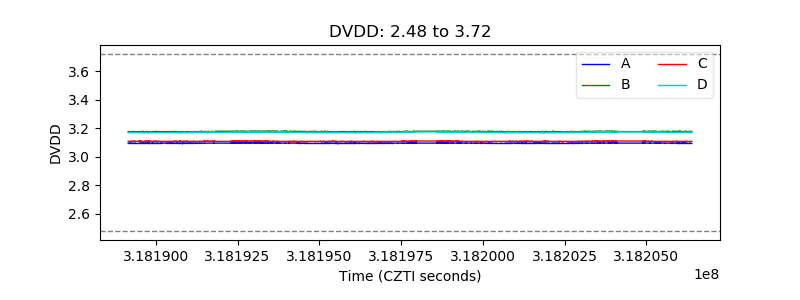 |
| Temperature 1 | 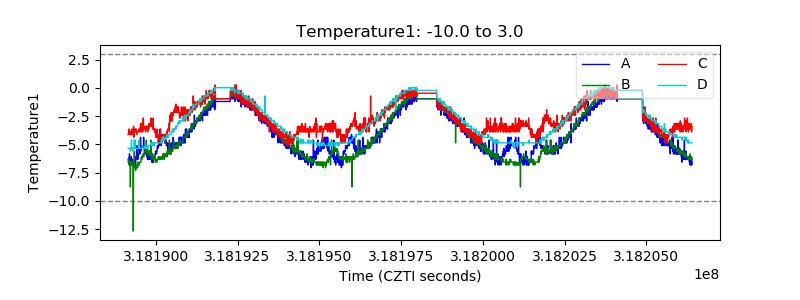 |
| Veto HV Monitor | 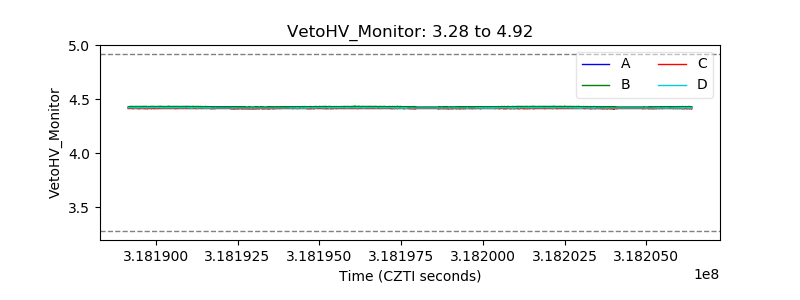 |
| Veto LLD | 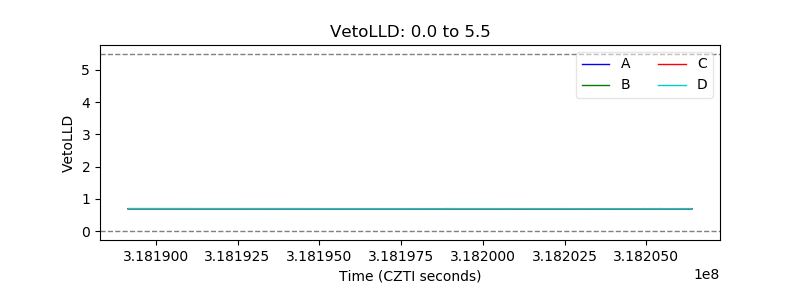 |
| Alpha Counter | 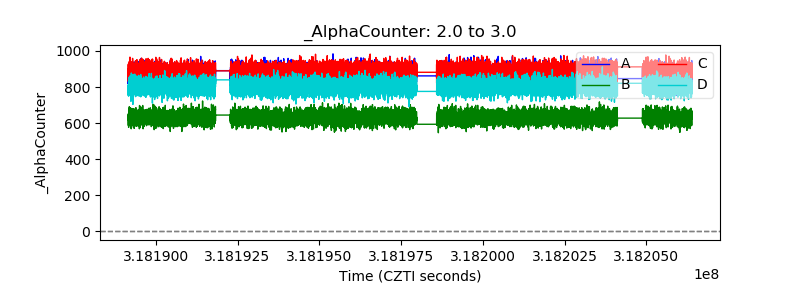 |
| _CPM_Rate | 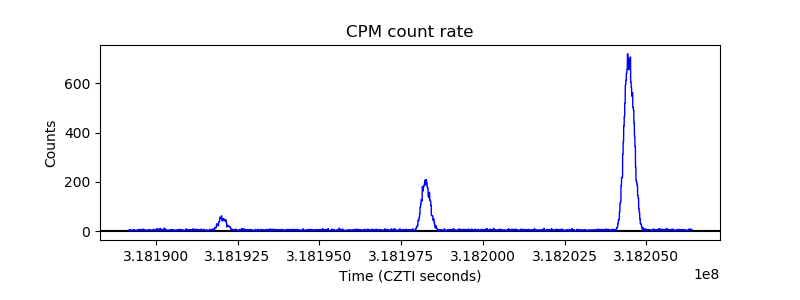 |
| CZT Counter | 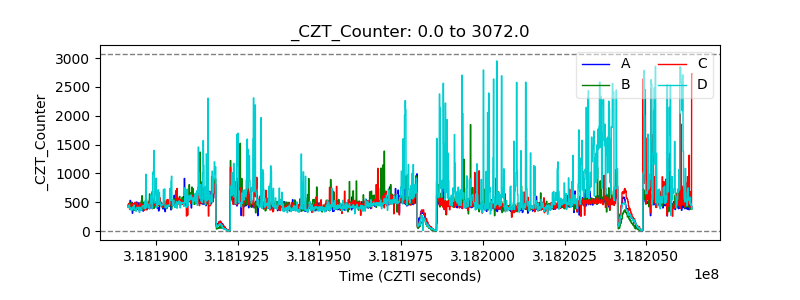 |
| +2.5 Volts monitor |  |
| +5 Volts monitor | 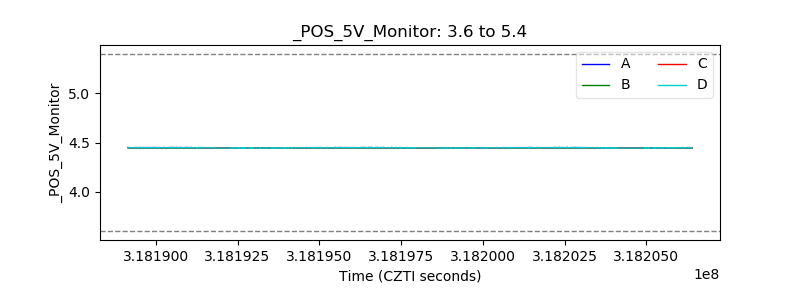 |
| _ROLL_ROT | 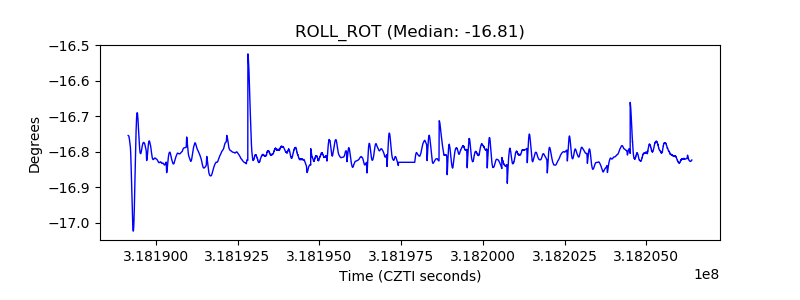 |
| _Roll_DEC | 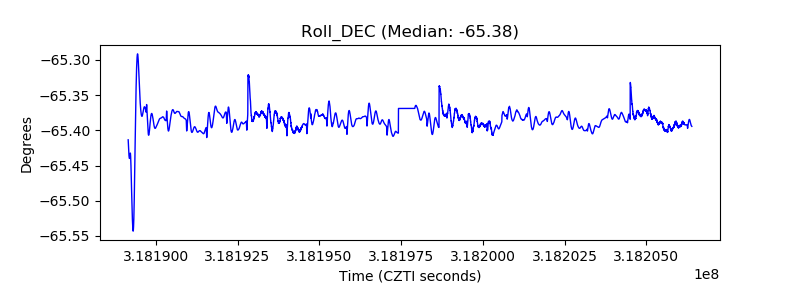 |
| _Roll_RA | 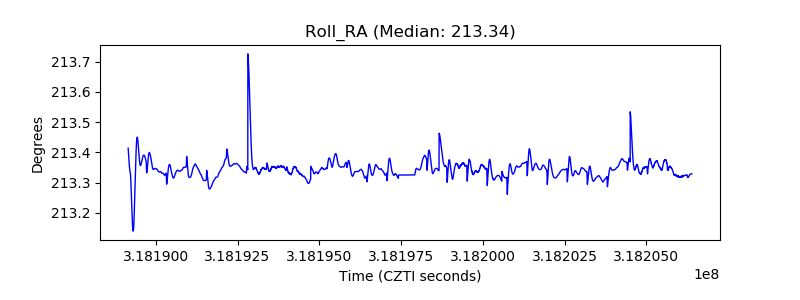 |
| Veto Counter | 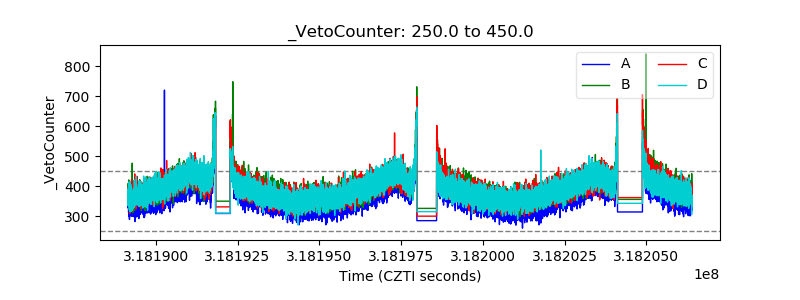 |