| Param | Original file | Final file |
|---|---|---|
| Filename | modeM0/AS1A07_100T02_9000003476_23487cztM0_level2.evt | modeM0/AS1A07_100T02_9000003476_23487cztM0_level2_quad_clean.evt |
| Size (bytes) | 687,248,640 | 108,855,360 |
| Size | 655.4 MB | 103.8 MB |
| Events in quadrant A | 3,399,979 | 732,887 |
| Events in quadrant B | 3,881,870 | 743,939 |
| Events in quadrant C | 5,003,621 | 684,779 |
| Events in quadrant D | 8,032,780 | 625,523 |
| Mode SS | |||
|---|---|---|---|
| Quadrant | BADHDUFLAG | Total packets | Discarded packets |
| A | 0 | 150 | 0 |
| B | 0 | 150 | 0 |
| C | 0 | 150 | 0 |
| D | 0 | 150 | 0 |
| Mode M9 | |||
|---|---|---|---|
| Quadrant | BADHDUFLAG | Total packets | Discarded packets |
| A | 0 | 18 | 0 |
| B | 0 | 18 | 0 |
| C | 0 | 18 | 0 |
| D | 0 | 18 | 0 |
| Mode M0 | |||
|---|---|---|---|
| Quadrant | BADHDUFLAG | Total packets | Discarded packets |
| A | 0 | 14873 | 1 |
| B | 0 | 16290 | 1 |
| C | 0 | 19648 | 1 |
| D | 0 | 28902 | 1 |
| Quadrant | Total seconds | Saturated seconds | Saturation percentage |
|---|---|---|---|
| A | 7313 | 45 | 0.615343% |
| B | 7314 | 123 | 1.681706% |
| C | 7314 | 523 | 7.150670% |
| D | 7314 | 1474 | 20.153131% |
Noise dominated data is calculated using 1-second bins in cleaned event files. If a bin has >2000 counts, and if more than 50% of those come from <1% of pixels, then it is considered to be noise-dominated and hence unusable.
| Quadrant | # 1 sec bins | Bins with >0 counts | Bins with >2000 counts | High rate bins dominated by noise | Noise dominated (total time) | Noise dominated (detector-on time) | Marked lightcurve |
|---|---|---|---|---|---|---|---|
| A | 9038 | 7314 | 0 | 0 | 0.00% | 0.00% | 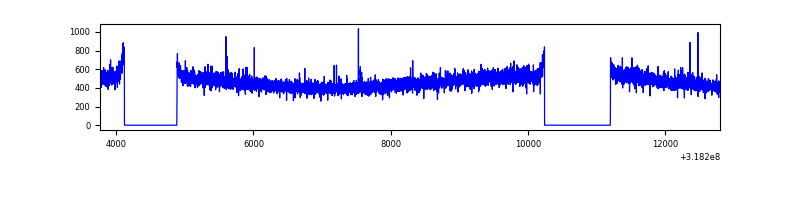 |
| B | 9039 | 7315 | 22 | 22 | 0.24% | 0.30% | 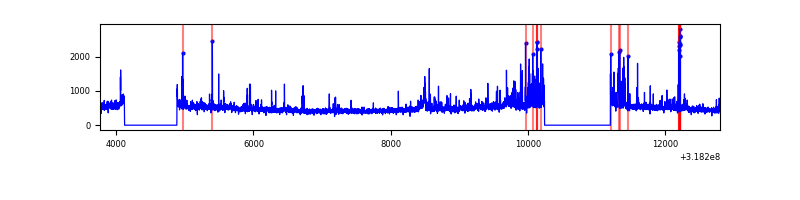 |
| C | 9039 | 7315 | 370 | 370 | 4.09% | 5.06% | 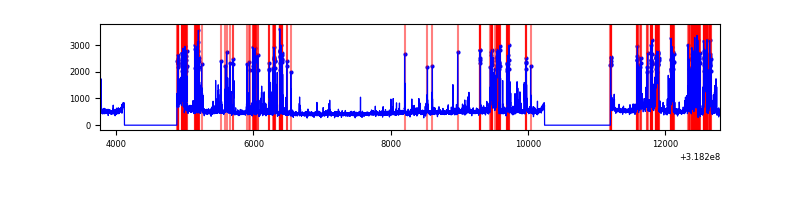 |
| D | 9039 | 7314 | 1301 | 1301 | 14.39% | 17.79% | 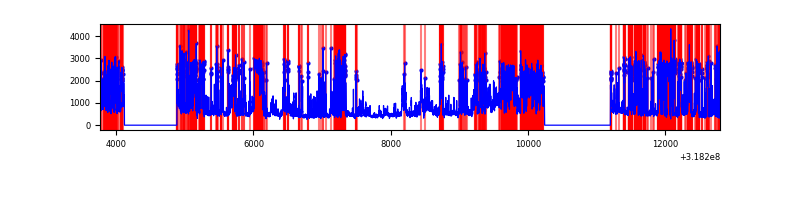 |
Top three noisy pixels from each quadrant. If the there are fewer than three noisy pixels in the level2.evt file, extra rows are filled as -1
| Pixel properties | Quadrant properties | ||||||
|---|---|---|---|---|---|---|---|
| Quadrant | DetID | PixID | Counts | Sigma | Mean | Median | Sigma |
| A | 13 | 254 | 12770 | 66.74 | 880 | 862 | 178.4 |
| A | 3 | 137 | 7655 | 38.07 | 880 | 862 | 178.4 |
| A | 0 | 226 | 7457 | 36.96 | 880 | 862 | 178.4 |
| B | 0 | 189 | 298625 | 1789.97 | 878 | 855 | 166.4 |
| B | 5 | 172 | 44950 | 265.07 | 878 | 855 | 166.4 |
| B | 0 | 229 | 32803 | 192.05 | 878 | 855 | 166.4 |
| C | 2 | 16 | 1610933 | 8358.73 | 826 | 831 | 192.6 |
| C | 14 | 238 | 128554 | 663.06 | 826 | 831 | 192.6 |
| C | 7 | 247 | 19229 | 95.51 | 826 | 831 | 192.6 |
| D | 1 | 52 | 3886592 | 20469.55 | 781 | 757 | 189.8 |
| D | 9 | 35 | 917415 | 4828.71 | 781 | 757 | 189.8 |
| D | 12 | 233 | 88559 | 462.52 | 781 | 757 | 189.8 |
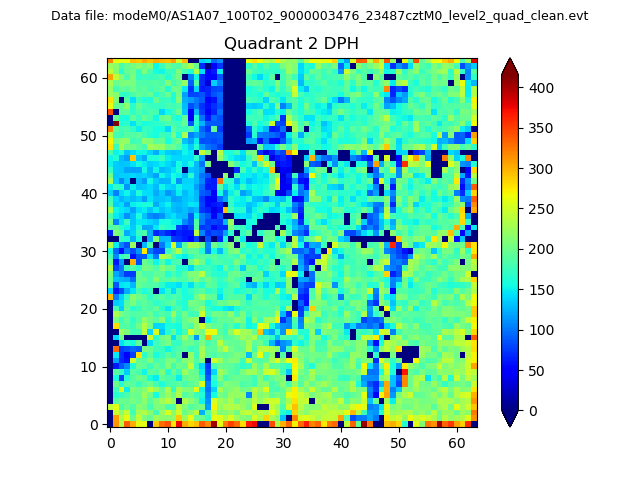
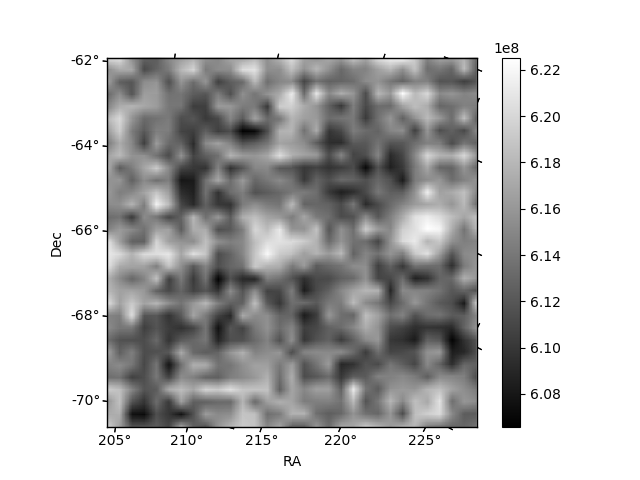
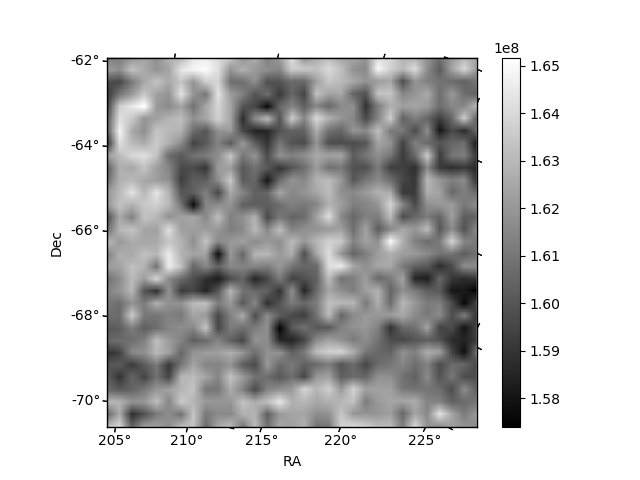
Histogram calculated using DETX and DETY for each event in the final _common_clean file
| Quadrant A | 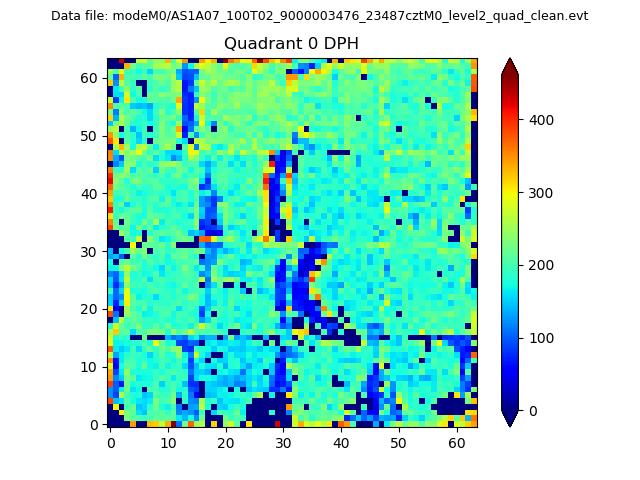 |
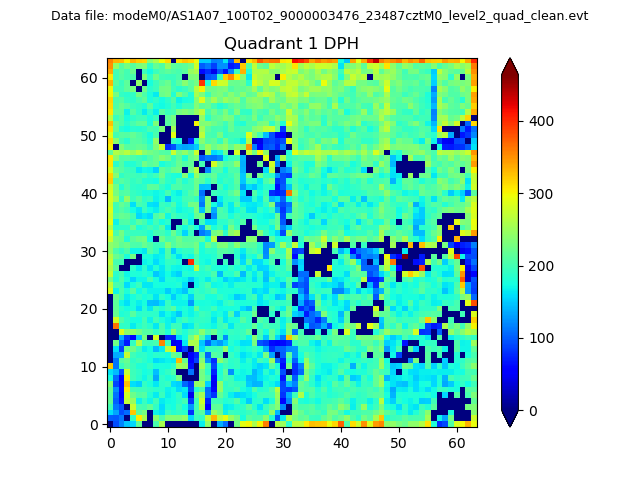 |
Quadrant B |
|---|---|---|---|
| Quadrant D | 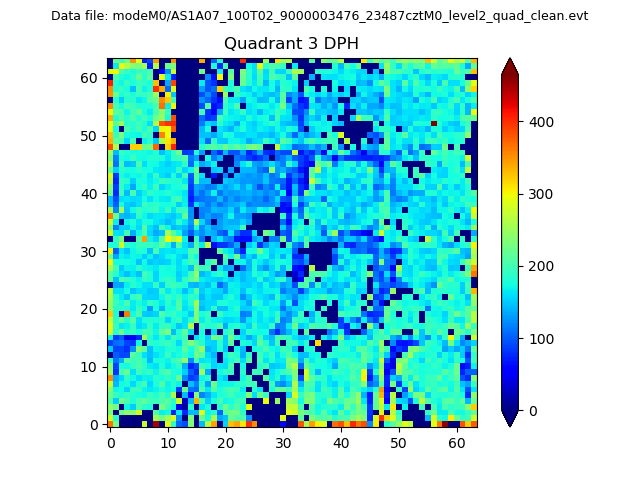 |
 |
Quadrant C |
| Plot type | Count rate plots | Images |
|---|---|---|
| Comparison with Poisson distribution Blue bars denote a histogram of data divided into 1 sec bins. Red curve is a Poisson curve with rate = median count rate of data. |
 |
 |
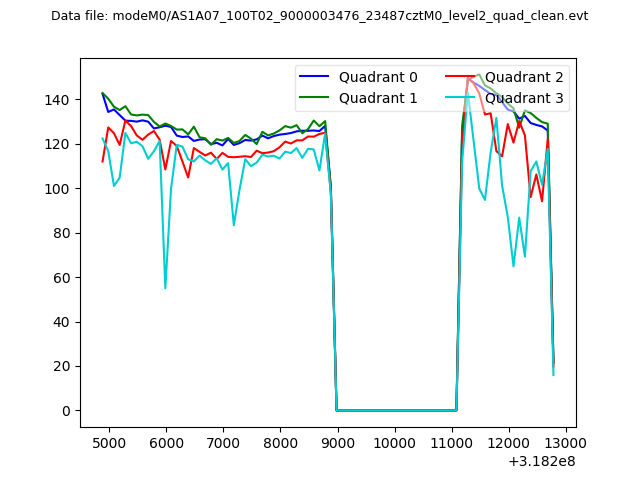
| Quadrant-wise count rates Data is divided into 100 sec bins |
 |
|
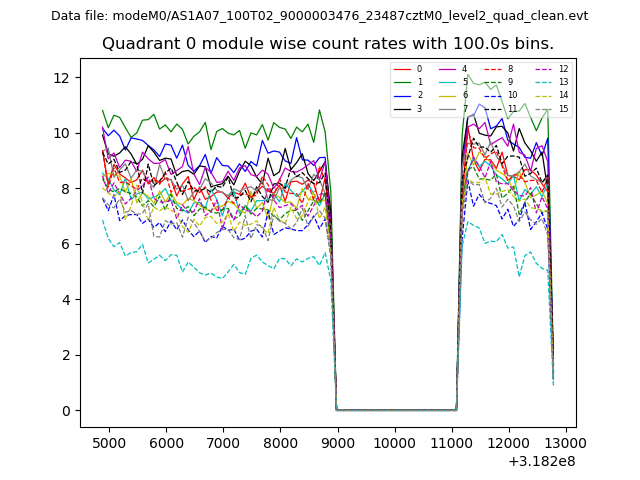
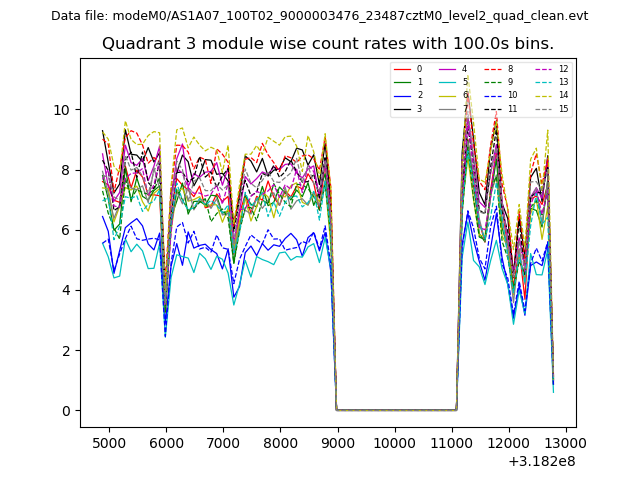
| Module-wise count rates for Quadrant A Data is divided into 100 sec bins |
 |
 |
| Module-wise count rates for Quadrant B Data is divided into 100 sec bins |
 |
 |
| Module-wise count rates for Quadrant C Data is divided into 100 sec bins |
 |
 |
| Module-wise count rates for Quadrant D Data is divided into 100 sec bins |
 |
 |
| Parameter | Plot |
|---|---|
| CZT HV Monitor |  |
| D_VDD | 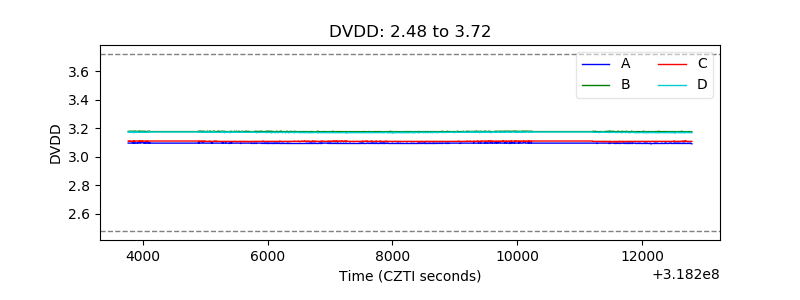 |
| Temperature 1 | 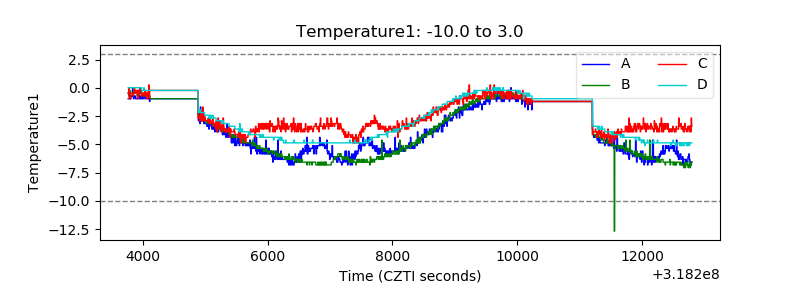 |
| Veto HV Monitor | 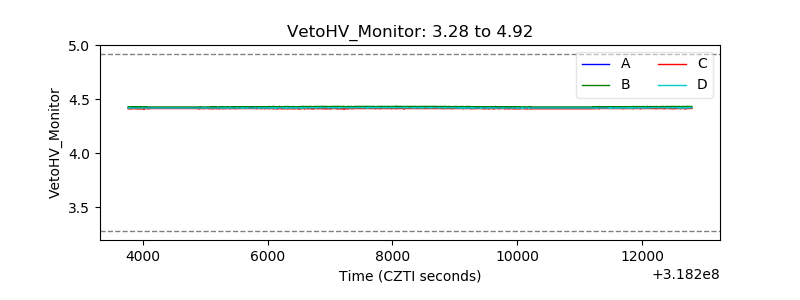 |
| Veto LLD | 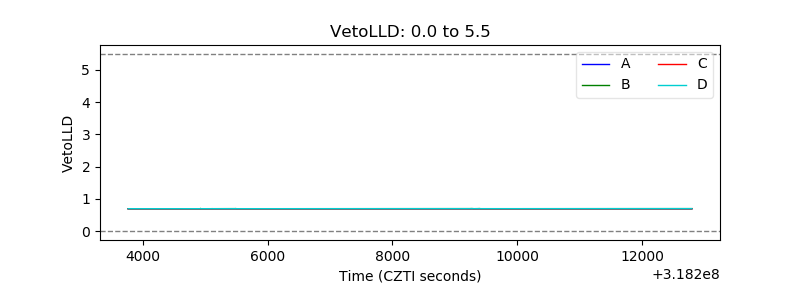 |
| Alpha Counter | 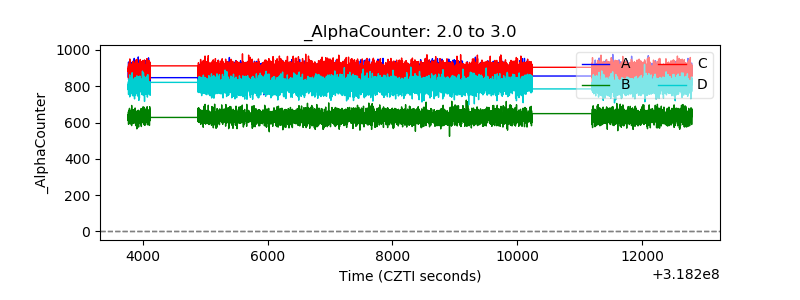 |
| _CPM_Rate | 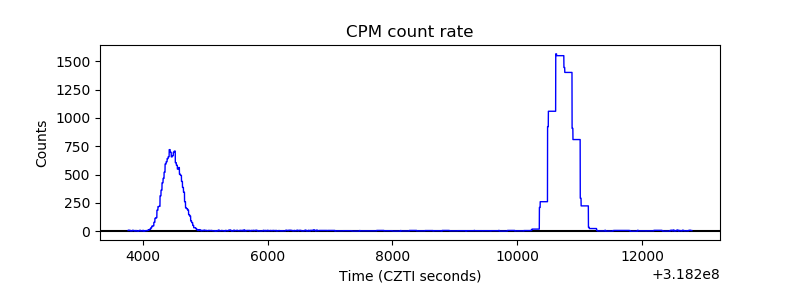 |
| CZT Counter | 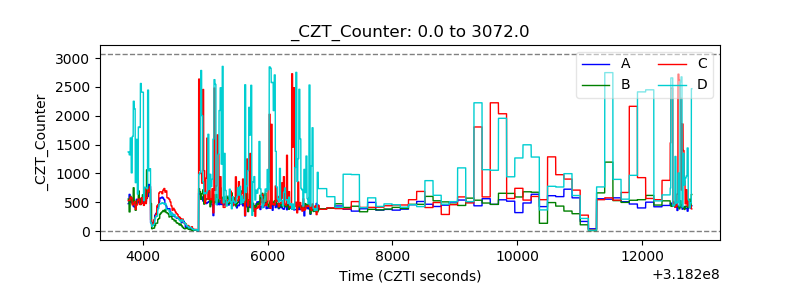 |
| +2.5 Volts monitor |  |
| +5 Volts monitor |  |
| _ROLL_ROT | 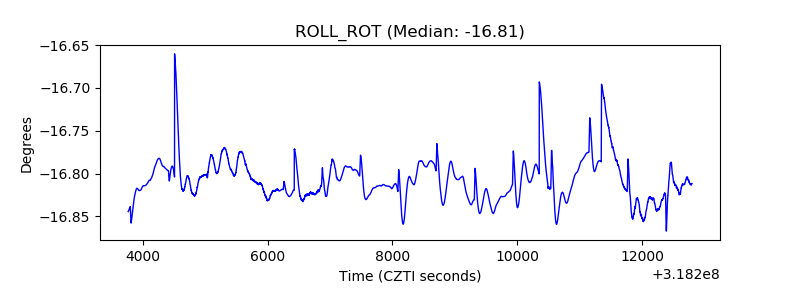 |
| _Roll_DEC | 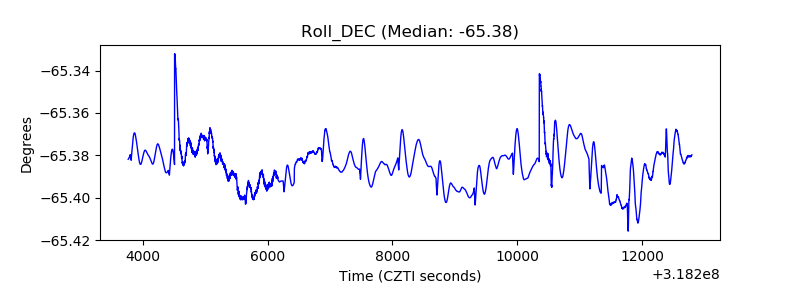 |
| _Roll_RA | 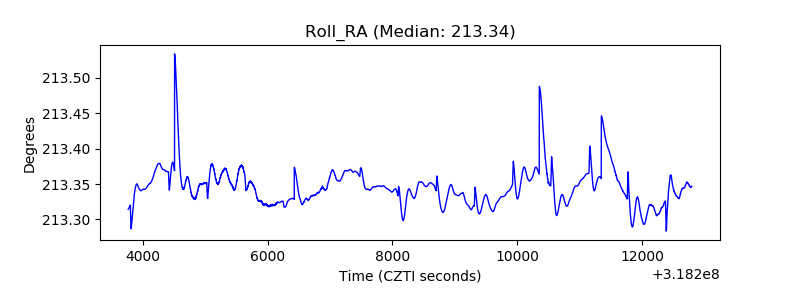 |
| Veto Counter | 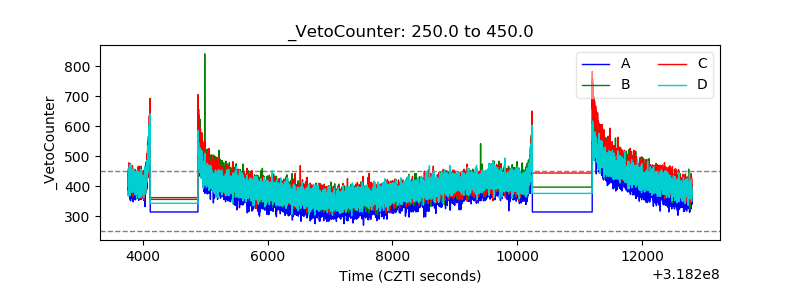 |