| Param | Original file | Final file |
|---|---|---|
| Filename | modeM0/AS1A07_100T02_9000003476_23489cztM0_level2.evt | modeM0/AS1A07_100T02_9000003476_23489cztM0_level2_quad_clean.evt |
| Size (bytes) | 535,253,760 | 97,680,960 |
| Size | 510.5 MB | 93.2 MB |
| Events in quadrant A | 2,906,903 | 650,041 |
| Events in quadrant B | 3,480,302 | 670,404 |
| Events in quadrant C | 4,713,476 | 618,982 |
| Events in quadrant D | 4,685,599 | 582,362 |
| Mode SS | |||
|---|---|---|---|
| Quadrant | BADHDUFLAG | Total packets | Discarded packets |
| A | 0 | 128 | 0 |
| B | 0 | 128 | 0 |
| C | 0 | 128 | 0 |
| D | 0 | 128 | 0 |
| Mode M9 | |||
|---|---|---|---|
| Quadrant | BADHDUFLAG | Total packets | Discarded packets |
| A | 0 | 11 | 0 |
| B | 0 | 11 | 0 |
| C | 0 | 11 | 0 |
| D | 0 | 11 | 0 |
| Mode M0 | |||
|---|---|---|---|
| Quadrant | BADHDUFLAG | Total packets | Discarded packets |
| A | 0 | 12719 | 0 |
| B | 0 | 14545 | 0 |
| C | 0 | 18003 | 0 |
| D | 0 | 17940 | 0 |
| Quadrant | Total seconds | Saturated seconds | Saturation percentage |
|---|---|---|---|
| A | 6244 | 20 | 0.320307% |
| B | 6244 | 85 | 1.361307% |
| C | 6244 | 601 | 9.625240% |
| D | 6244 | 546 | 8.744395% |
Noise dominated data is calculated using 1-second bins in cleaned event files. If a bin has >2000 counts, and if more than 50% of those come from <1% of pixels, then it is considered to be noise-dominated and hence unusable.
| Quadrant | # 1 sec bins | Bins with >0 counts | Bins with >2000 counts | High rate bins dominated by noise | Noise dominated (total time) | Noise dominated (detector-on time) | Marked lightcurve |
|---|---|---|---|---|---|---|---|
| A | 7339 | 6245 | 1 | 1 | 0.01% | 0.02% | 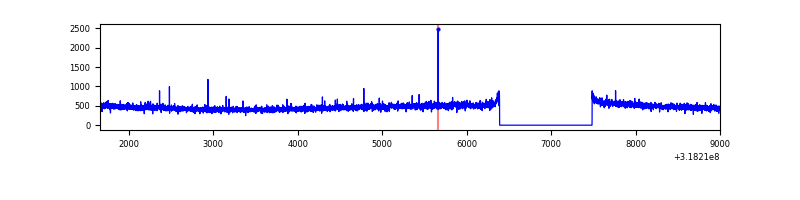 |
| B | 7339 | 6244 | 31 | 31 | 0.42% | 0.50% | 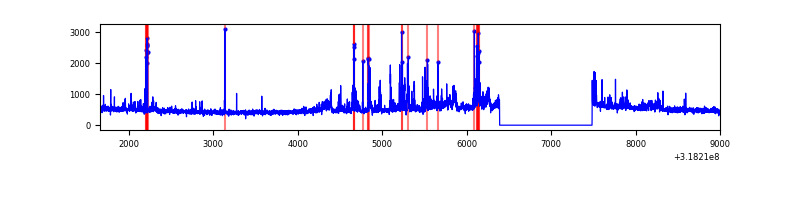 |
| C | 7339 | 6244 | 457 | 457 | 6.23% | 7.32% | 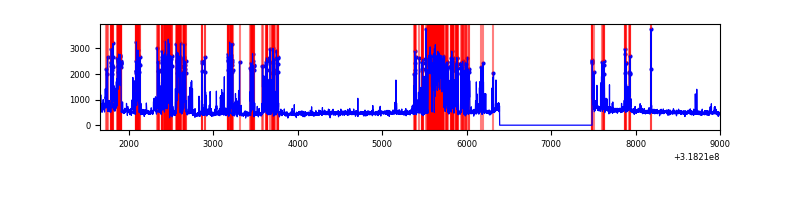 |
| D | 7339 | 6245 | 532 | 532 | 7.25% | 8.52% | 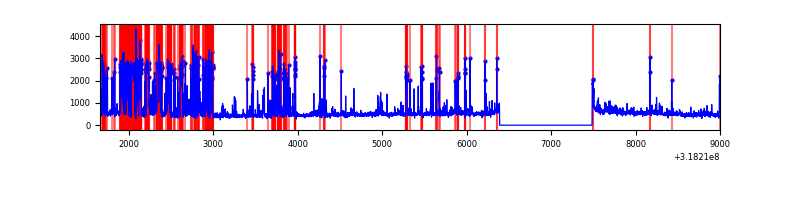 |
Top three noisy pixels from each quadrant. If the there are fewer than three noisy pixels in the level2.evt file, extra rows are filled as -1
| Pixel properties | Quadrant properties | ||||||
|---|---|---|---|---|---|---|---|
| Quadrant | DetID | PixID | Counts | Sigma | Mean | Median | Sigma |
| A | 13 | 254 | 10955 | 67.29 | 752 | 735 | 151.9 |
| A | 0 | 226 | 6446 | 37.6 | 752 | 735 | 151.9 |
| A | 3 | 137 | 6328 | 36.83 | 752 | 735 | 151.9 |
| B | 0 | 189 | 322082 | 2263.23 | 759 | 740 | 142.0 |
| B | 5 | 172 | 82544 | 576.15 | 759 | 740 | 142.0 |
| B | 0 | 230 | 42993 | 297.59 | 759 | 740 | 142.0 |
| C | 2 | 16 | 1787220 | 10747.09 | 712 | 717 | 166.2 |
| C | 14 | 238 | 111027 | 663.59 | 712 | 717 | 166.2 |
| C | 7 | 247 | 25714 | 150.37 | 712 | 717 | 166.2 |
| D | 1 | 52 | 1831600 | 10611.39 | 714 | 694 | 172.5 |
| D | 7 | 238 | 32426 | 183.91 | 714 | 694 | 172.5 |
| D | 13 | 174 | 31536 | 178.75 | 714 | 694 | 172.5 |
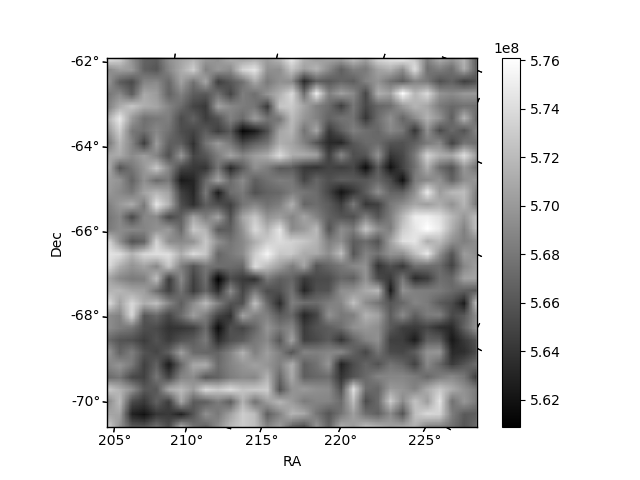
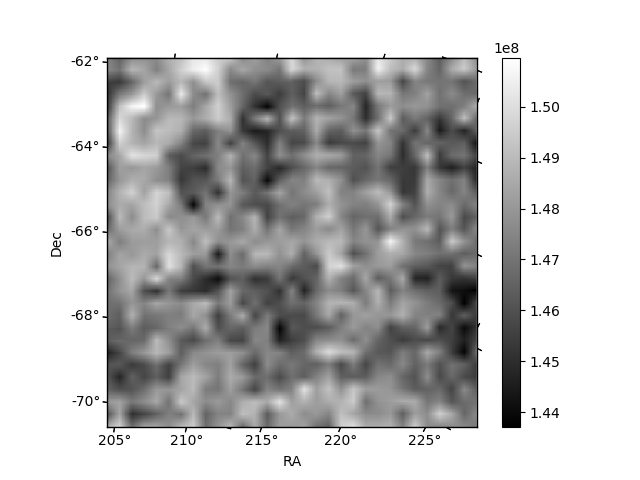
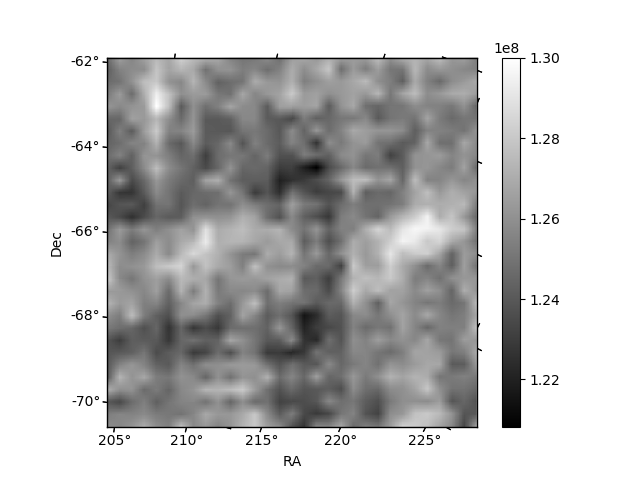
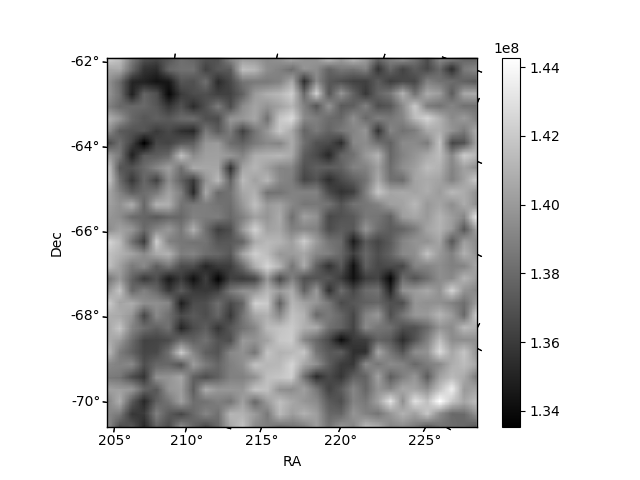
Histogram calculated using DETX and DETY for each event in the final _common_clean file
| Quadrant A | 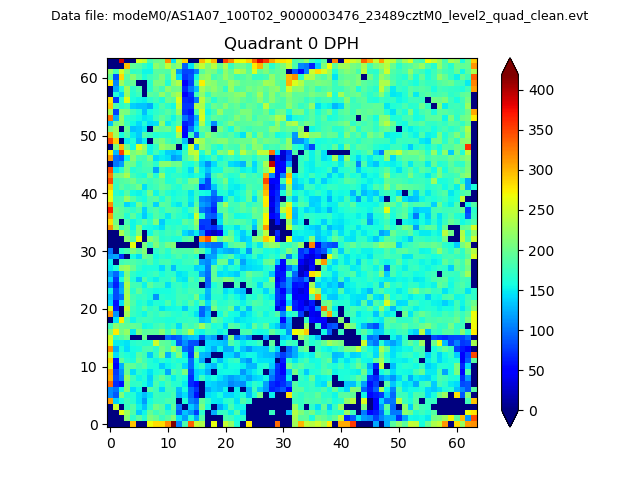 |
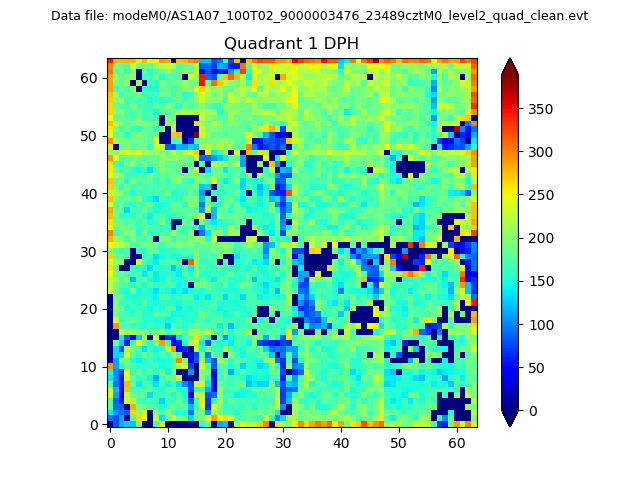 |
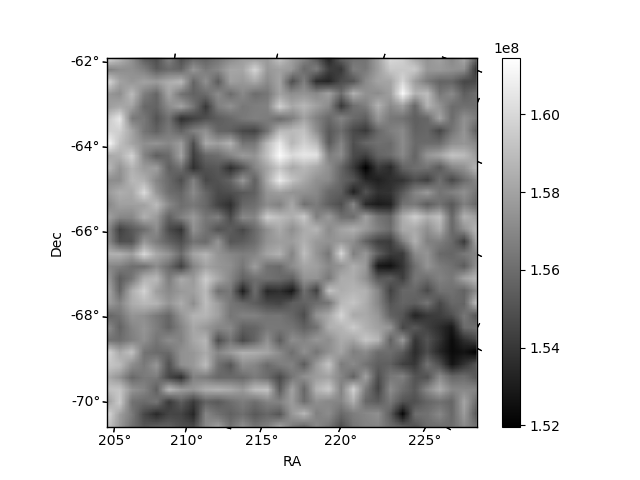
Quadrant B |
|---|---|---|---|
| Quadrant D | 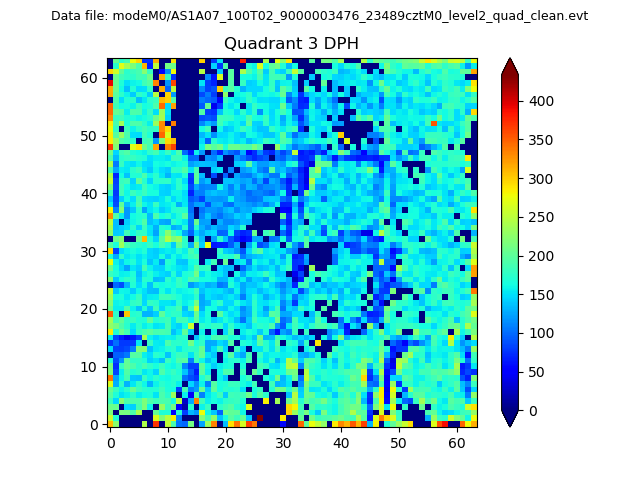 |
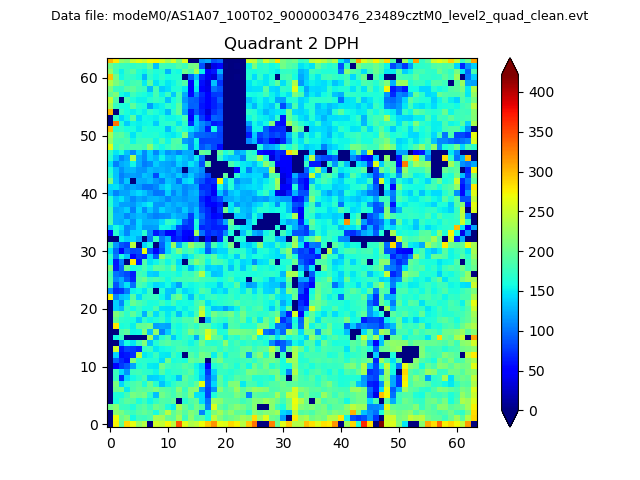 |
Quadrant C |
| Plot type | Count rate plots | Images |
|---|---|---|
| Comparison with Poisson distribution Blue bars denote a histogram of data divided into 1 sec bins. Red curve is a Poisson curve with rate = median count rate of data. |
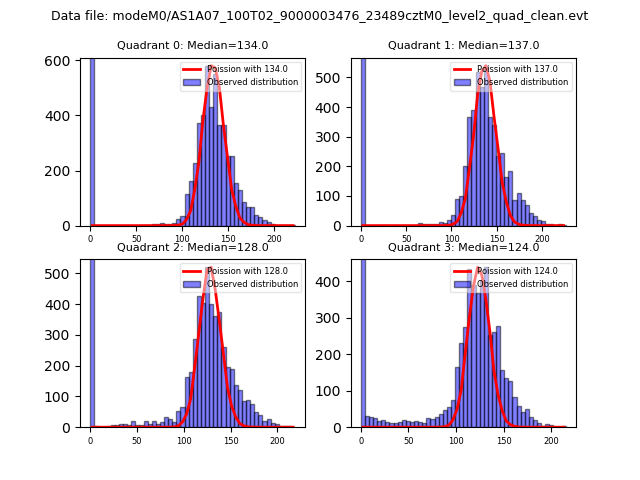 |
 |
| Quadrant-wise count rates Data is divided into 100 sec bins |
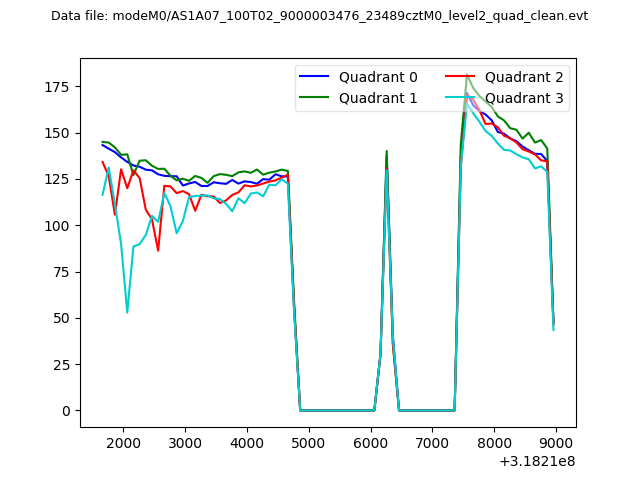 |
|
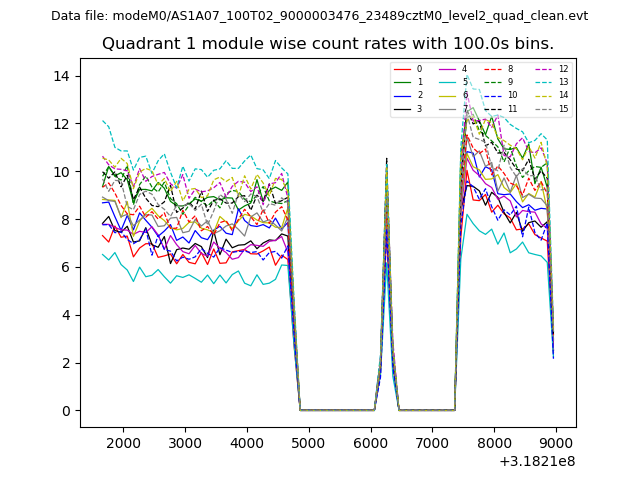
| Module-wise count rates for Quadrant A Data is divided into 100 sec bins |
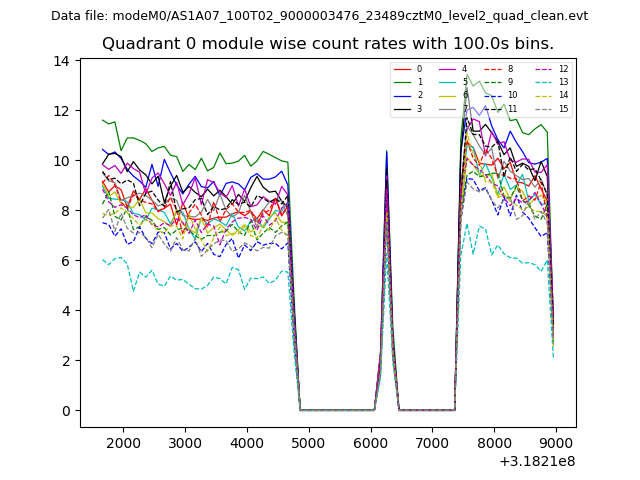 |
 |
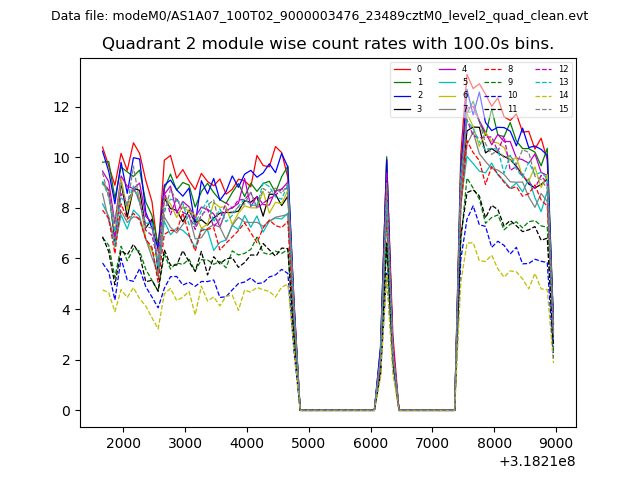
| Module-wise count rates for Quadrant B Data is divided into 100 sec bins |
 |
 |
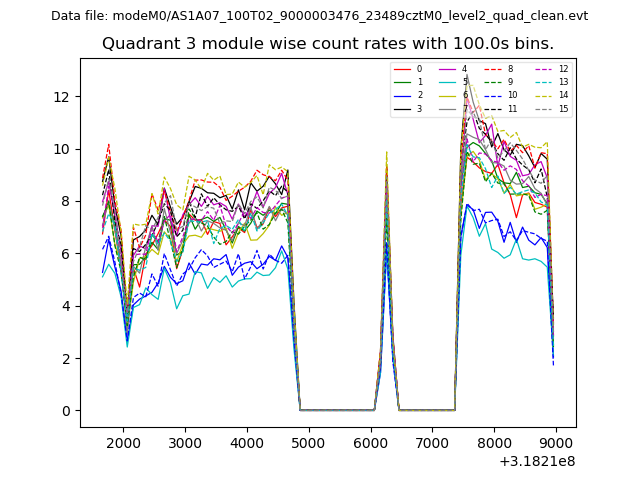
| Module-wise count rates for Quadrant C Data is divided into 100 sec bins |
 |
 |
| Module-wise count rates for Quadrant D Data is divided into 100 sec bins |
 |
 |
| Parameter | Plot |
|---|---|
| CZT HV Monitor | 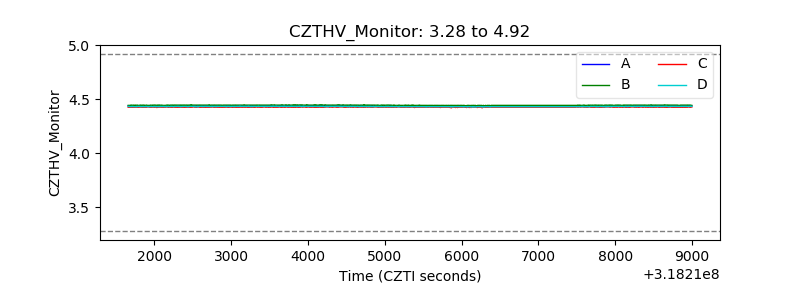 |
| D_VDD | 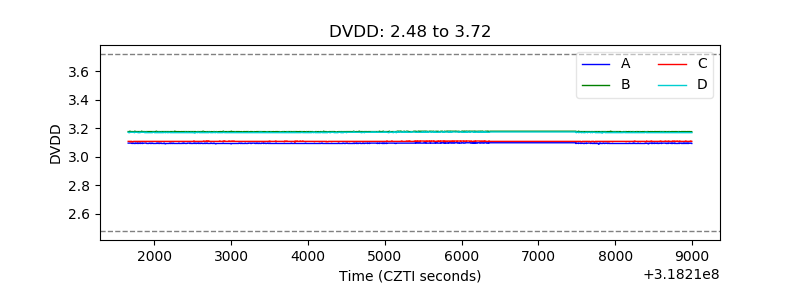 |
| Temperature 1 | 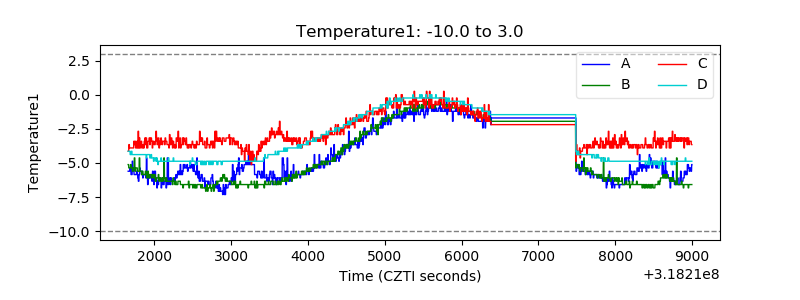 |
| Veto HV Monitor | 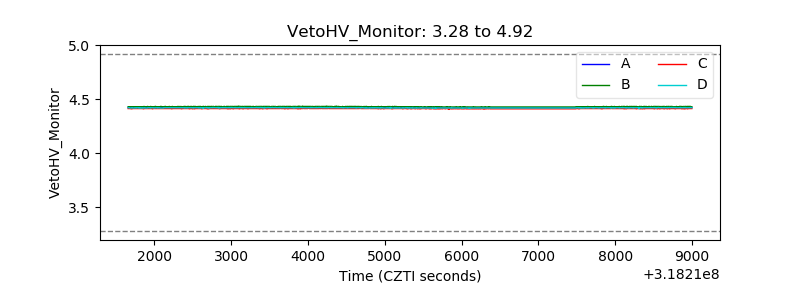 |
| Veto LLD | 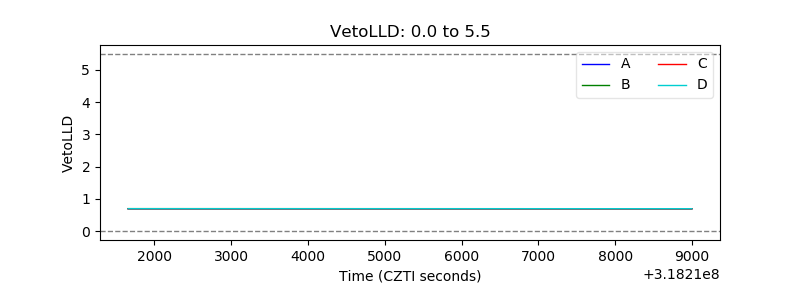 |
| Alpha Counter | 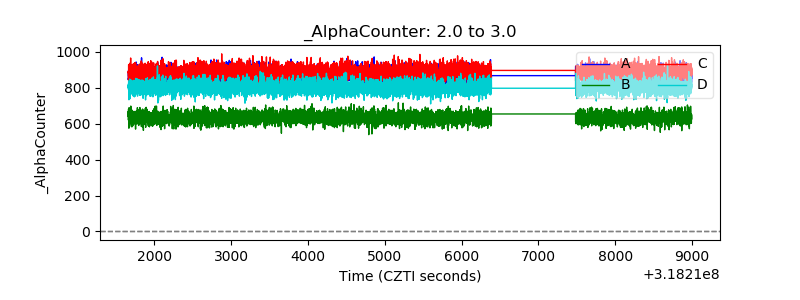 |
| _CPM_Rate | 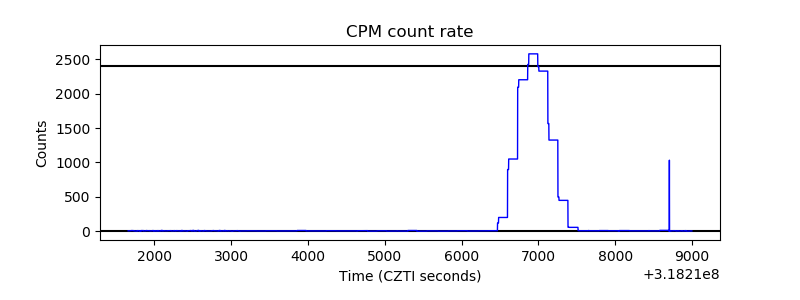 |
| CZT Counter | 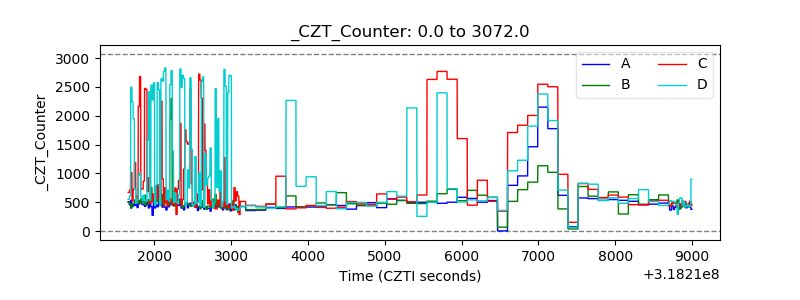 |
| +2.5 Volts monitor |  |
| +5 Volts monitor |  |
| _ROLL_ROT | 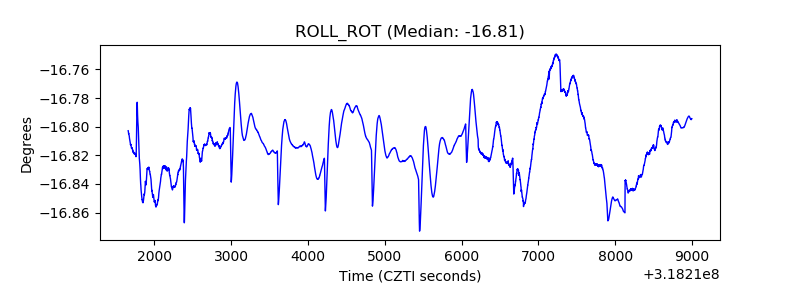 |
| _Roll_DEC | 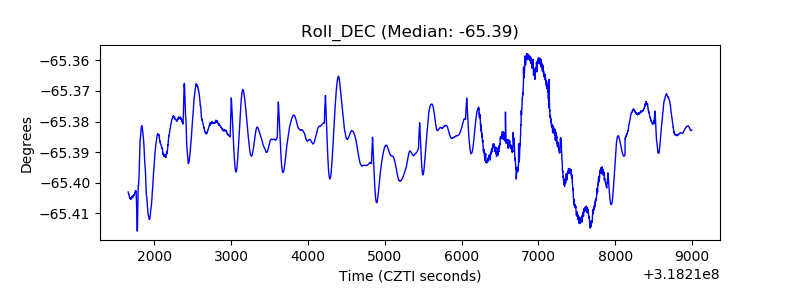 |
| _Roll_RA | 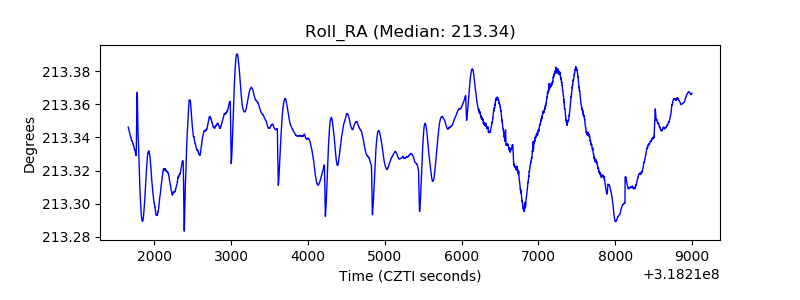 |
| Veto Counter | 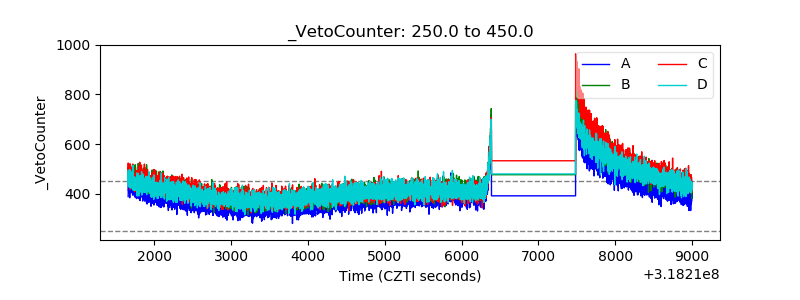 |