| Param | Original file | Final file |
|---|---|---|
| Filename | modeM0/AS1A07_100T02_9000003476_23490cztM0_level2.evt | modeM0/AS1A07_100T02_9000003476_23490cztM0_level2_quad_clean.evt |
| Size (bytes) | 437,927,040 | 101,502,720 |
| Size | 417.6 MB | 96.8 MB |
| Events in quadrant A | 2,906,568 | 666,113 |
| Events in quadrant B | 3,176,287 | 690,099 |
| Events in quadrant C | 3,384,542 | 661,777 |
| Events in quadrant D | 3,388,043 | 637,584 |
| Mode SS | |||
|---|---|---|---|
| Quadrant | BADHDUFLAG | Total packets | Discarded packets |
| A | 0 | 122 | 0 |
| B | 0 | 122 | 0 |
| C | 0 | 122 | 0 |
| D | 0 | 122 | 0 |
| Mode M9 | |||
|---|---|---|---|
| Quadrant | BADHDUFLAG | Total packets | Discarded packets |
| A | 0 | 12 | 0 |
| B | 0 | 12 | 0 |
| C | 0 | 12 | 0 |
| D | 0 | 12 | 0 |
| Mode M0 | |||
|---|---|---|---|
| Quadrant | BADHDUFLAG | Total packets | Discarded packets |
| A | 0 | 12369 | 1 |
| B | 0 | 13316 | 1 |
| C | 0 | 13753 | 1 |
| D | 0 | 13794 | 1 |
| Quadrant | Total seconds | Saturated seconds | Saturation percentage |
|---|---|---|---|
| A | 5992 | 14 | 0.233645% |
| B | 5992 | 36 | 0.600801% |
| C | 5992 | 154 | 2.570093% |
| D | 5992 | 57 | 0.951268% |
Noise dominated data is calculated using 1-second bins in cleaned event files. If a bin has >2000 counts, and if more than 50% of those come from <1% of pixels, then it is considered to be noise-dominated and hence unusable.
| Quadrant | # 1 sec bins | Bins with >0 counts | Bins with >2000 counts | High rate bins dominated by noise | Noise dominated (total time) | Noise dominated (detector-on time) | Marked lightcurve |
|---|---|---|---|---|---|---|---|
| A | 7217 | 5993 | 0 | 0 | 0.00% | 0.00% | 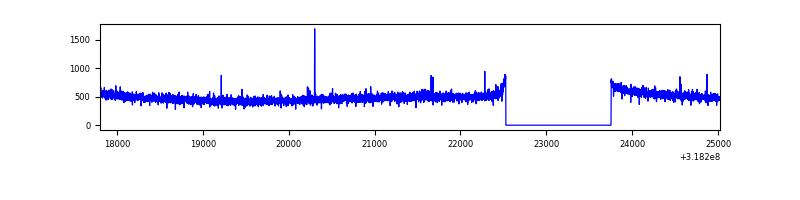 |
| B | 7217 | 5993 | 1 | 1 | 0.01% | 0.02% | 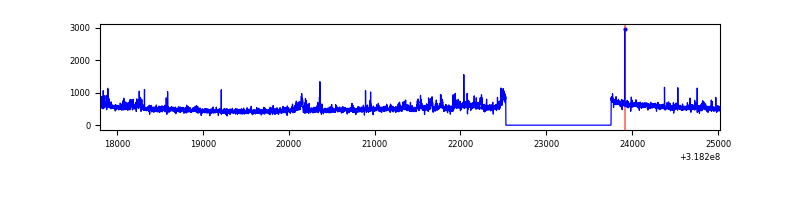 |
| C | 7217 | 5992 | 69 | 69 | 0.96% | 1.15% | 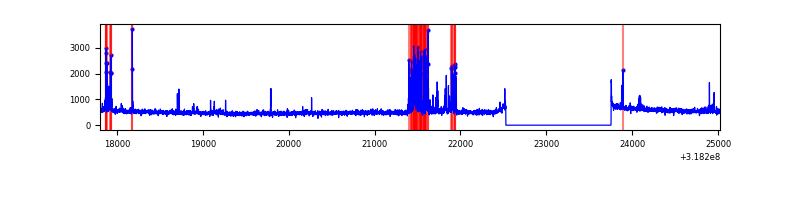 |
| D | 7217 | 5993 | 41 | 41 | 0.57% | 0.68% | 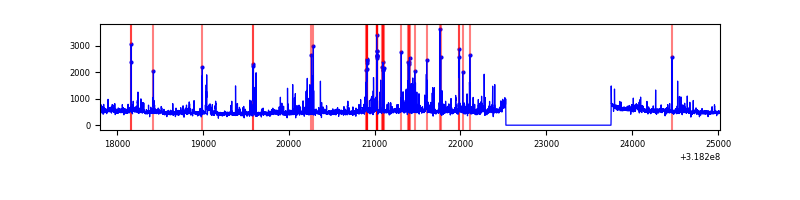 |
Top three noisy pixels from each quadrant. If the there are fewer than three noisy pixels in the level2.evt file, extra rows are filled as -1
| Pixel properties | Quadrant properties | ||||||
|---|---|---|---|---|---|---|---|
| Quadrant | DetID | PixID | Counts | Sigma | Mean | Median | Sigma |
| A | 13 | 254 | 11043 | 68.28 | 752 | 736 | 150.9 |
| A | 0 | 226 | 6482 | 38.07 | 752 | 736 | 150.9 |
| A | 3 | 137 | 6151 | 35.87 | 752 | 736 | 150.9 |
| B | 0 | 189 | 107488 | 758.6 | 760 | 741 | 140.7 |
| B | 0 | 230 | 40648 | 283.6 | 760 | 741 | 140.7 |
| B | 0 | 229 | 40016 | 279.11 | 760 | 741 | 140.7 |
| C | 2 | 16 | 330757 | 1924.04 | 740 | 745 | 171.5 |
| C | 14 | 238 | 119230 | 690.79 | 740 | 745 | 171.5 |
| C | 7 | 247 | 36545 | 208.72 | 740 | 745 | 171.5 |
| D | 1 | 52 | 281151 | 1562.49 | 744 | 723 | 179.5 |
| D | 13 | 104 | 90078 | 497.87 | 744 | 723 | 179.5 |
| D | 12 | 233 | 77967 | 430.39 | 744 | 723 | 179.5 |
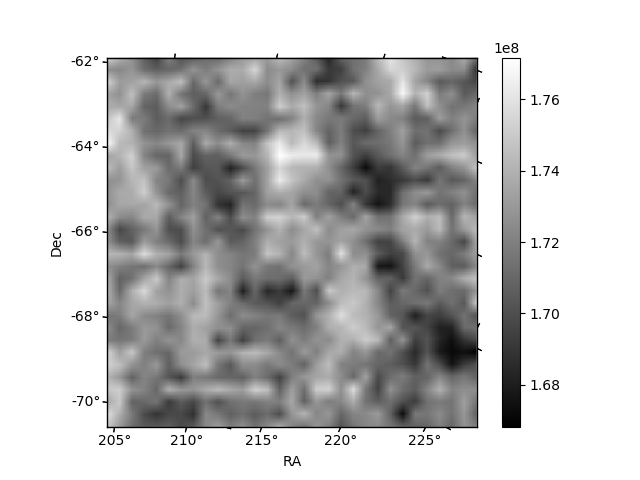
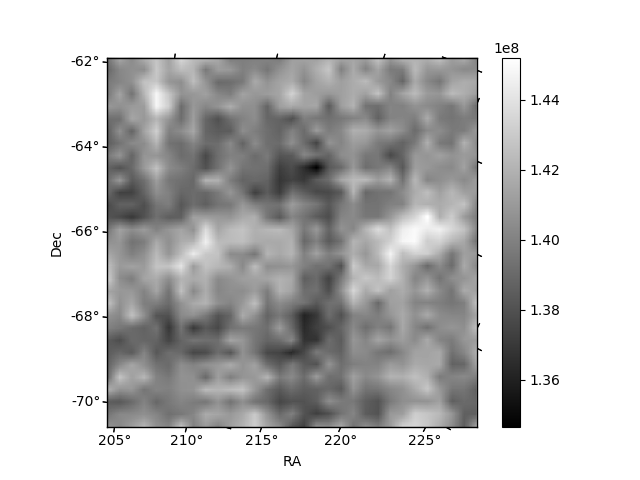
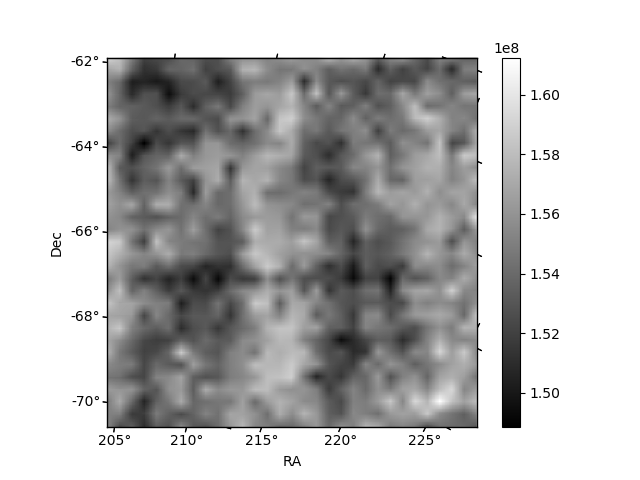
Histogram calculated using DETX and DETY for each event in the final _common_clean file
| Quadrant A | 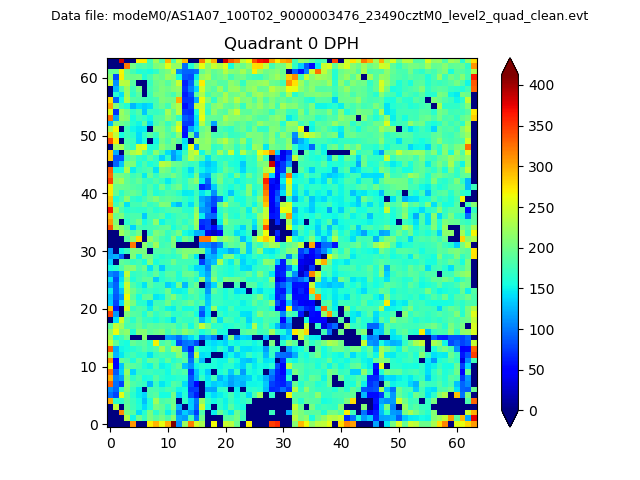 |
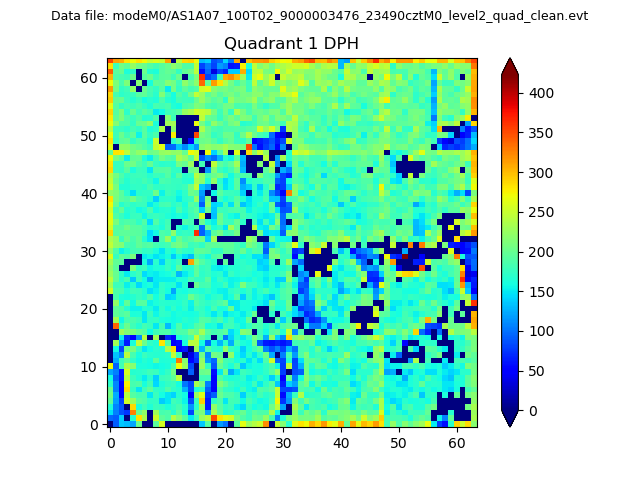 |
Quadrant B |
|---|---|---|---|
| Quadrant D | 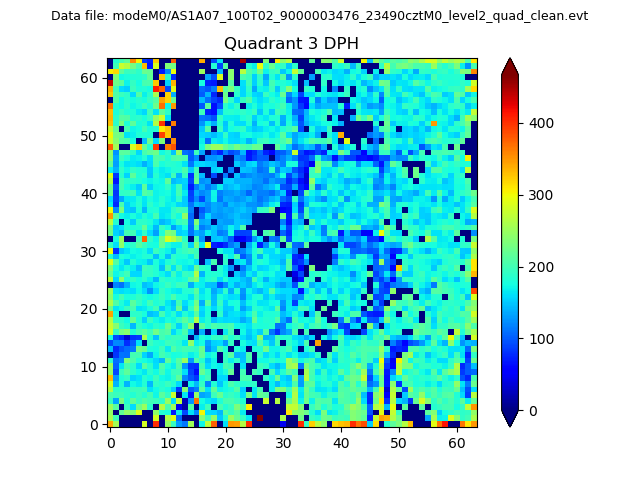 |
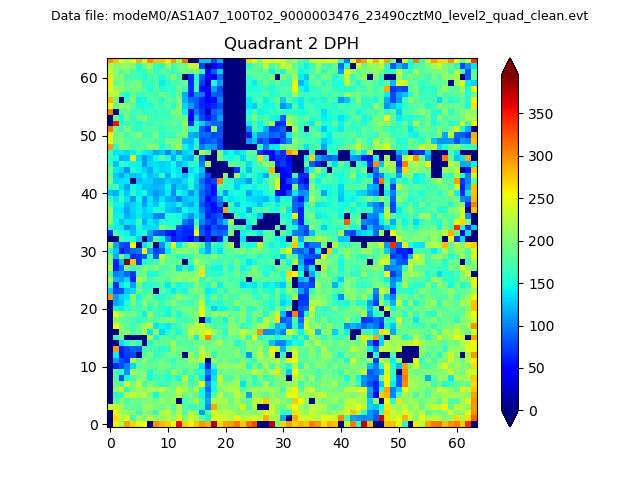 |
Quadrant C |
| Plot type | Count rate plots | Images |
|---|---|---|
| Comparison with Poisson distribution Blue bars denote a histogram of data divided into 1 sec bins. Red curve is a Poisson curve with rate = median count rate of data. |
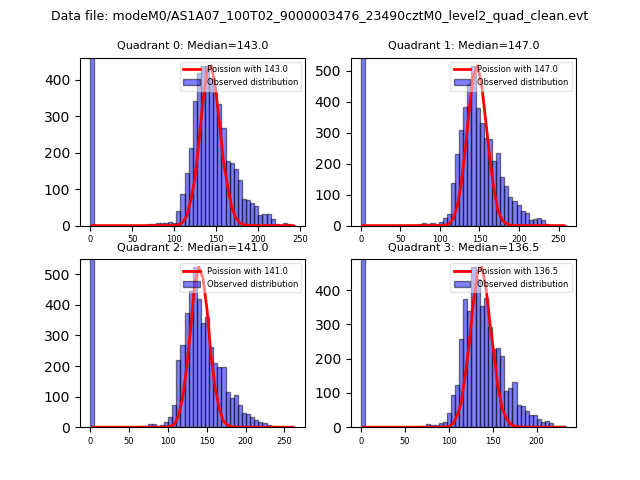 |
 |
| Quadrant-wise count rates Data is divided into 100 sec bins |
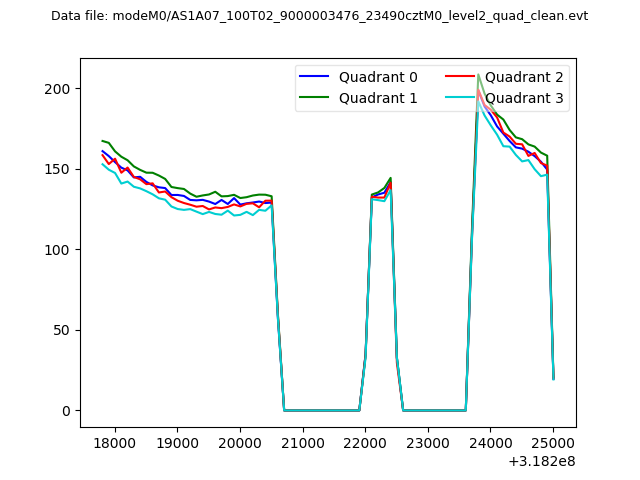 |
|
| Module-wise count rates for Quadrant A Data is divided into 100 sec bins |
 |
 |
| Module-wise count rates for Quadrant B Data is divided into 100 sec bins |
 |
 |
| Module-wise count rates for Quadrant C Data is divided into 100 sec bins |
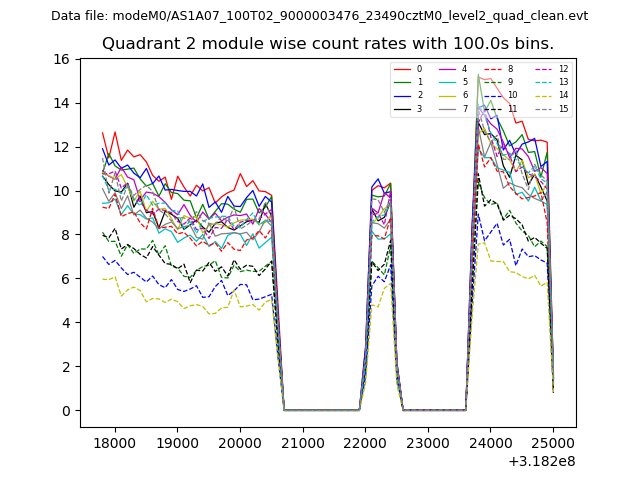 |
 |
| Module-wise count rates for Quadrant D Data is divided into 100 sec bins |
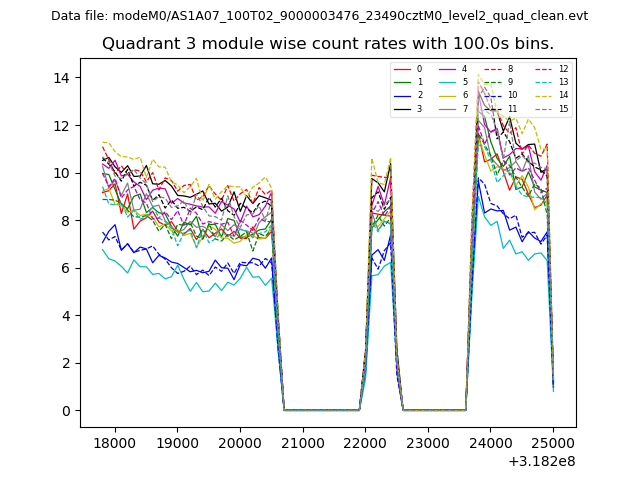 |
 |
| Parameter | Plot |
|---|---|
| CZT HV Monitor | 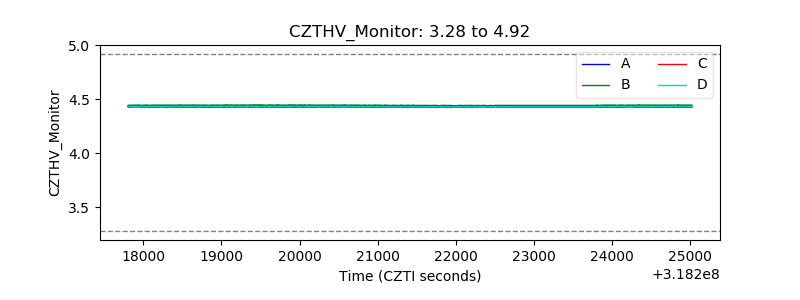 |
| D_VDD | 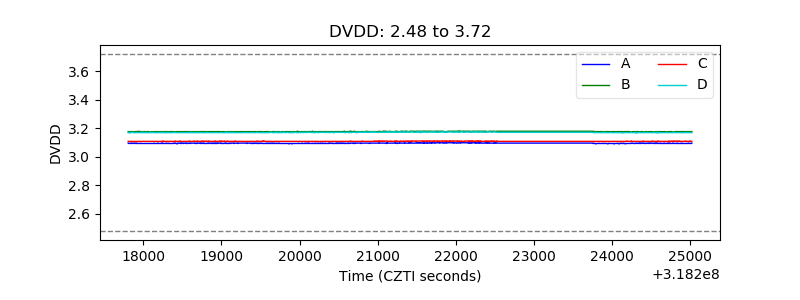 |
| Temperature 1 | 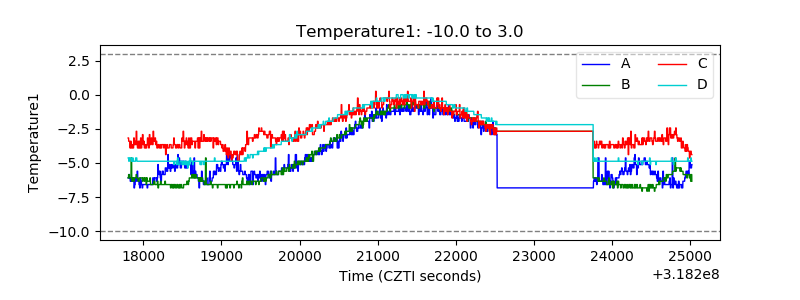 |
| Veto HV Monitor | 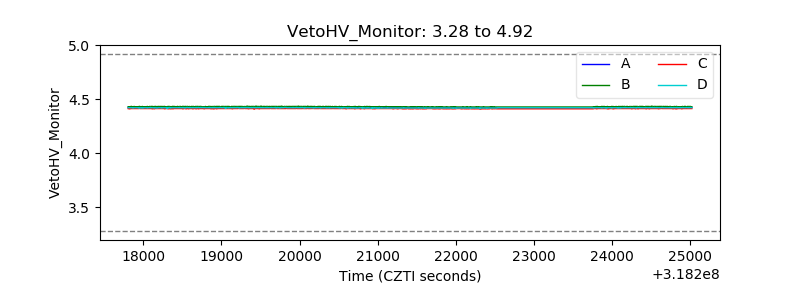 |
| Veto LLD | 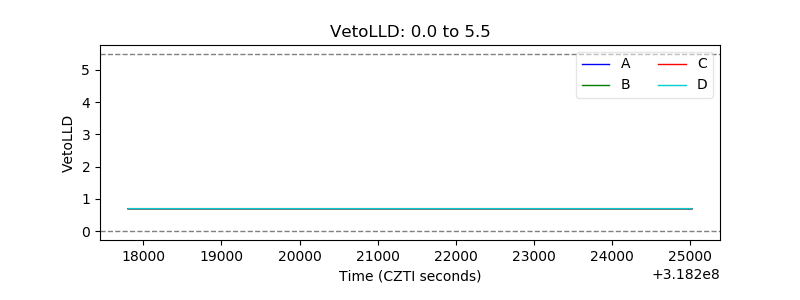 |
| Alpha Counter | 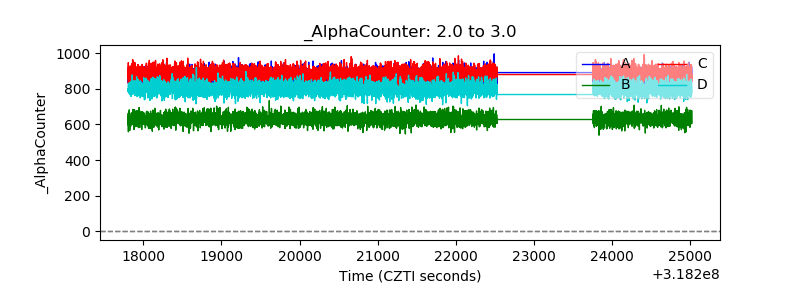 |
| _CPM_Rate | 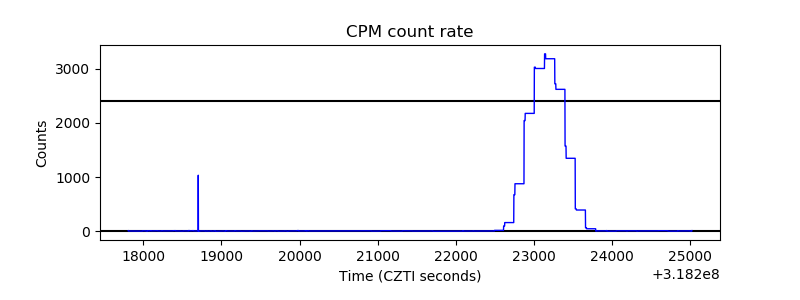 |
| CZT Counter | 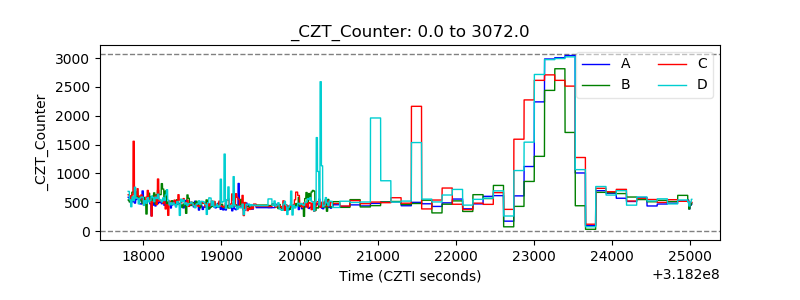 |
| +2.5 Volts monitor |  |
| +5 Volts monitor | 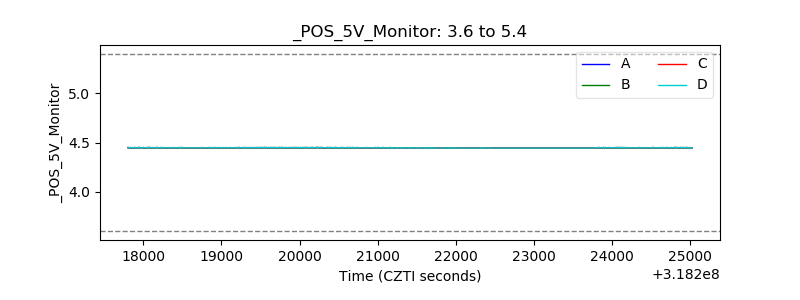 |
| _ROLL_ROT | 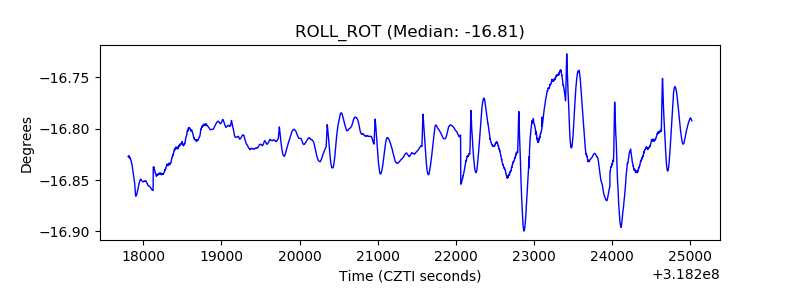 |
| _Roll_DEC |  |
| _Roll_RA | 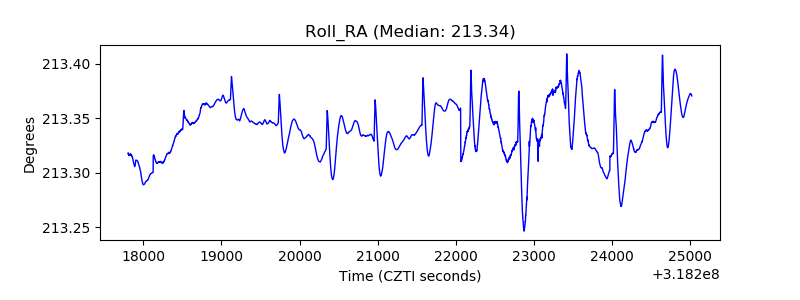 |
| Veto Counter |  |