| Param | Original file | Final file |
|---|---|---|
| Filename | modeM0/AS1A07_100T02_9000003476_23492cztM0_level2.evt | modeM0/AS1A07_100T02_9000003476_23492cztM0_level2_quad_clean.evt |
| Size (bytes) | 476,830,080 | 105,416,640 |
| Size | 454.7 MB | 100.5 MB |
| Events in quadrant A | 2,992,160 | 707,459 |
| Events in quadrant B | 3,517,600 | 722,206 |
| Events in quadrant C | 3,185,931 | 701,613 |
| Events in quadrant D | 4,352,967 | 657,300 |
| Mode SS | |||
|---|---|---|---|
| Quadrant | BADHDUFLAG | Total packets | Discarded packets |
| A | 0 | 118 | 0 |
| B | 0 | 118 | 0 |
| C | 0 | 118 | 0 |
| D | 0 | 118 | 0 |
| Mode M9 | |||
|---|---|---|---|
| Quadrant | BADHDUFLAG | Total packets | Discarded packets |
| A | 0 | 14 | 0 |
| B | 0 | 14 | 0 |
| C | 0 | 14 | 0 |
| D | 0 | 14 | 0 |
| Mode M0 | |||
|---|---|---|---|
| Quadrant | BADHDUFLAG | Total packets | Discarded packets |
| A | 0 | 12194 | 1 |
| B | 0 | 14250 | 1 |
| C | 0 | 12902 | 1 |
| D | 0 | 16499 | 1 |
| Quadrant | Total seconds | Saturated seconds | Saturation percentage |
|---|---|---|---|
| A | 5778 | 16 | 0.276912% |
| B | 5778 | 59 | 1.021115% |
| C | 5778 | 81 | 1.401869% |
| D | 5779 | 379 | 6.558228% |
Noise dominated data is calculated using 1-second bins in cleaned event files. If a bin has >2000 counts, and if more than 50% of those come from <1% of pixels, then it is considered to be noise-dominated and hence unusable.
| Quadrant | # 1 sec bins | Bins with >0 counts | Bins with >2000 counts | High rate bins dominated by noise | Noise dominated (total time) | Noise dominated (detector-on time) | Marked lightcurve |
|---|---|---|---|---|---|---|---|
| A | 7158 | 5779 | 0 | 0 | 0.00% | 0.00% | 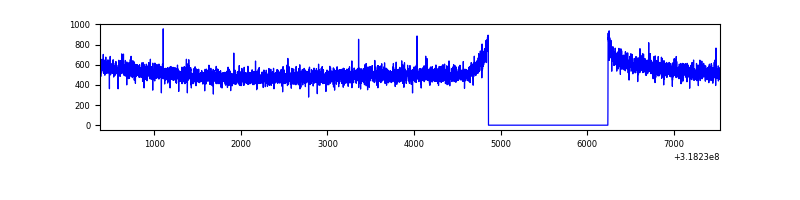 |
| B | 7158 | 5779 | 26 | 26 | 0.36% | 0.45% | 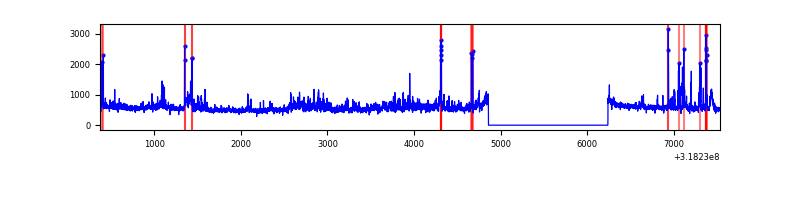 |
| C | 7158 | 5779 | 6 | 6 | 0.08% | 0.10% | 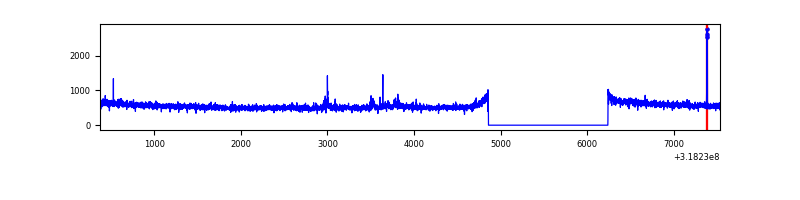 |
| D | 7159 | 5780 | 348 | 348 | 4.86% | 6.02% | 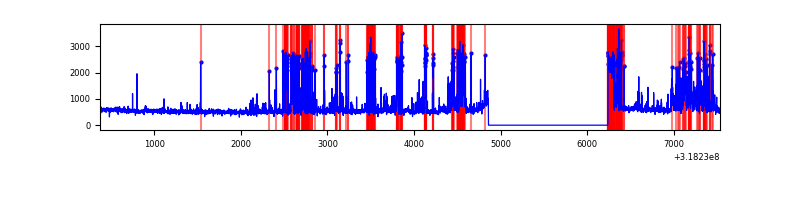 |
Top three noisy pixels from each quadrant. If the there are fewer than three noisy pixels in the level2.evt file, extra rows are filled as -1
| Pixel properties | Quadrant properties | ||||||
|---|---|---|---|---|---|---|---|
| Quadrant | DetID | PixID | Counts | Sigma | Mean | Median | Sigma |
| A | 13 | 254 | 9834 | 59.42 | 775 | 761 | 152.7 |
| A | 0 | 226 | 6816 | 39.66 | 775 | 761 | 152.7 |
| A | 3 | 137 | 5823 | 33.15 | 775 | 761 | 152.7 |
| B | 0 | 229 | 190863 | 1352.08 | 772 | 755 | 140.6 |
| B | 0 | 189 | 114529 | 809.18 | 772 | 755 | 140.6 |
| B | 5 | 172 | 88735 | 625.73 | 772 | 755 | 140.6 |
| C | 14 | 238 | 123207 | 698.9 | 764 | 771 | 175.2 |
| C | 8 | 208 | 29543 | 164.24 | 764 | 771 | 175.2 |
| C | 7 | 247 | 22581 | 124.5 | 764 | 771 | 175.2 |
| D | 1 | 52 | 1391650 | 7728.62 | 752 | 734 | 180.0 |
| D | 12 | 233 | 41190 | 224.79 | 752 | 734 | 180.0 |
| D | 7 | 38 | 27783 | 150.3 | 752 | 734 | 180.0 |
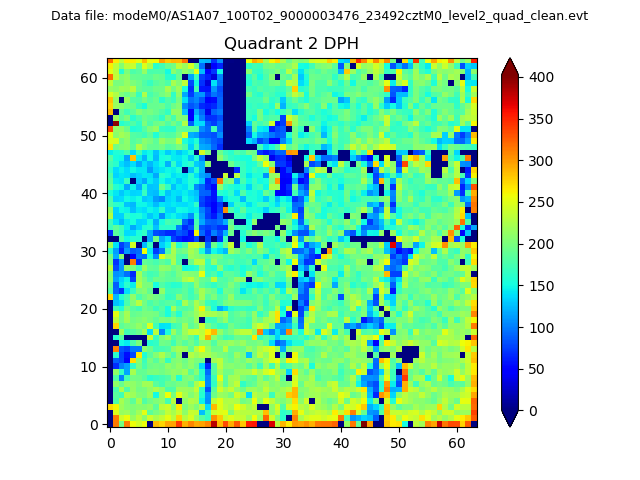
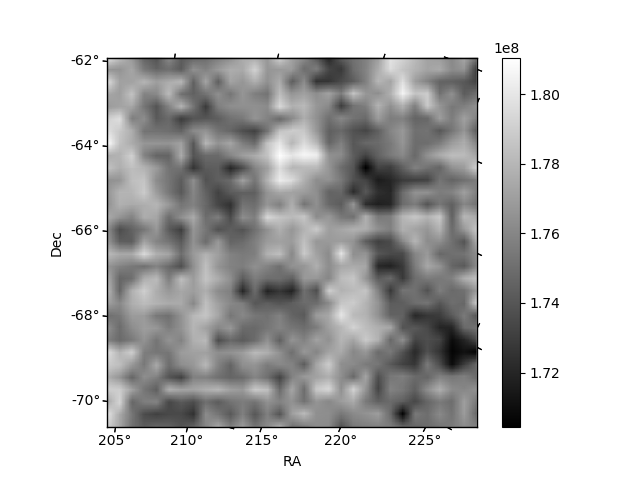
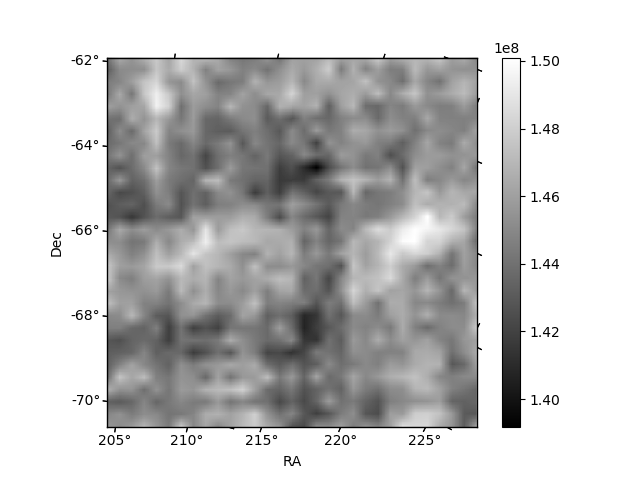
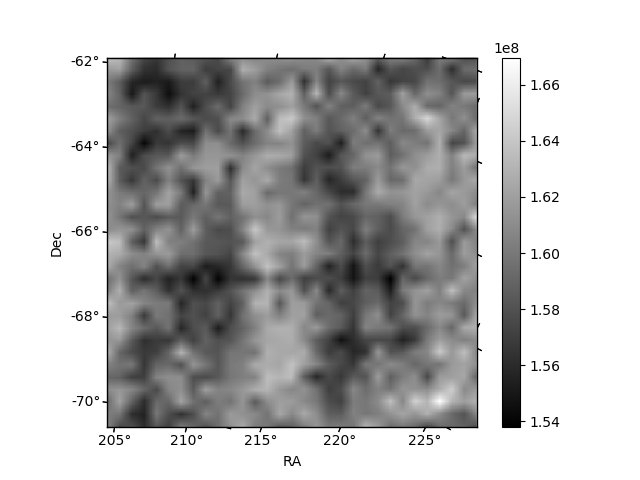
Histogram calculated using DETX and DETY for each event in the final _common_clean file
| Quadrant A | 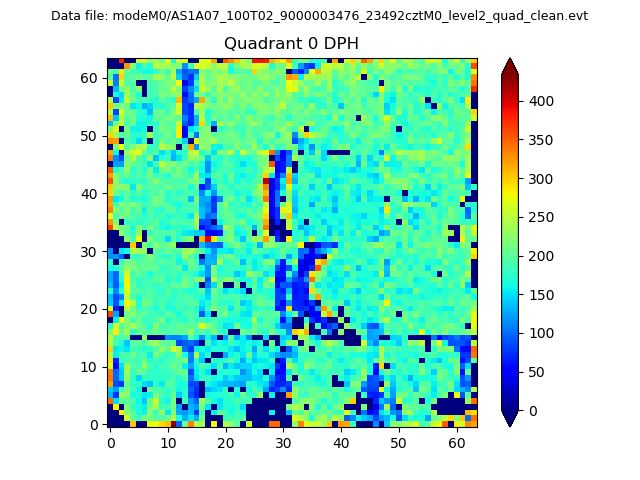 |
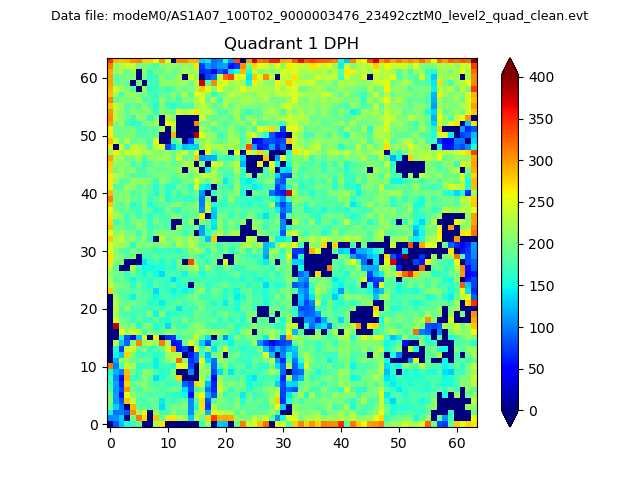 |
Quadrant B |
|---|---|---|---|
| Quadrant D | 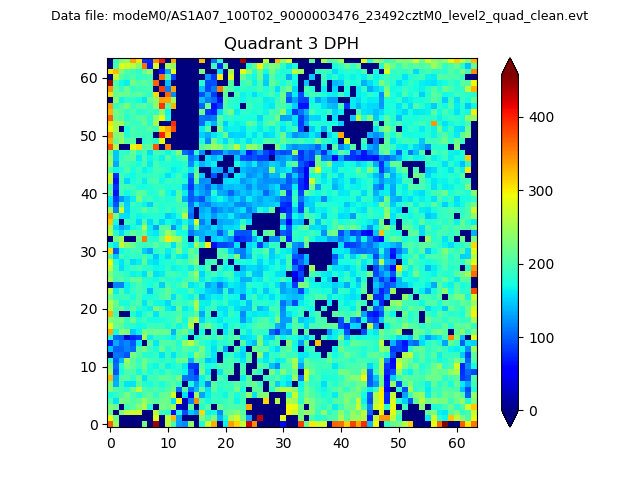 |
 |
Quadrant C |
| Plot type | Count rate plots | Images |
|---|---|---|
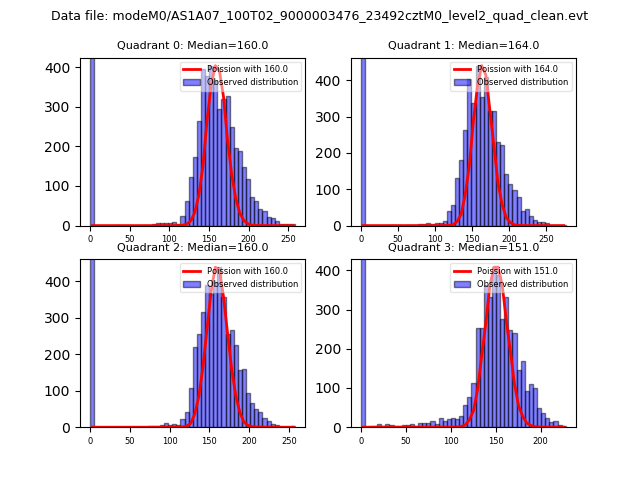
| Comparison with Poisson distribution Blue bars denote a histogram of data divided into 1 sec bins. Red curve is a Poisson curve with rate = median count rate of data. |
 |
 |
| Quadrant-wise count rates Data is divided into 100 sec bins |
 |
|
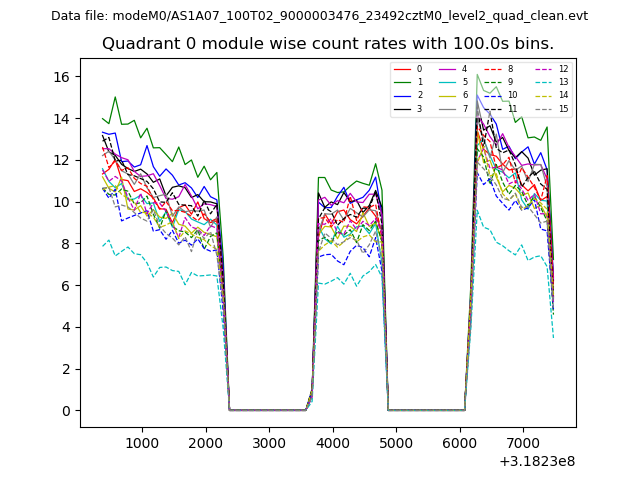
| Module-wise count rates for Quadrant A Data is divided into 100 sec bins |
 |
 |
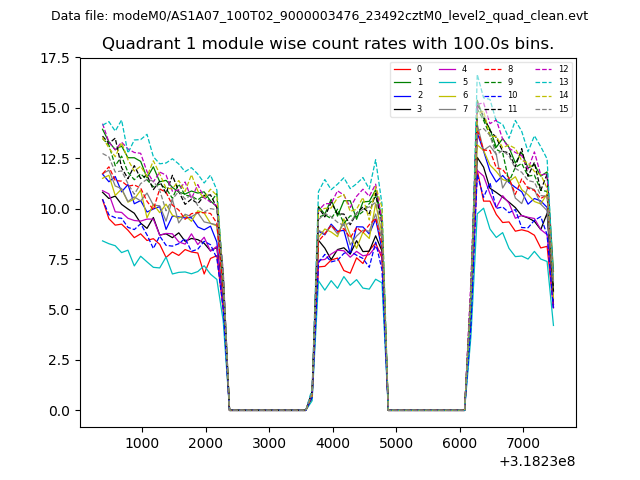
| Module-wise count rates for Quadrant B Data is divided into 100 sec bins |
 |
 |
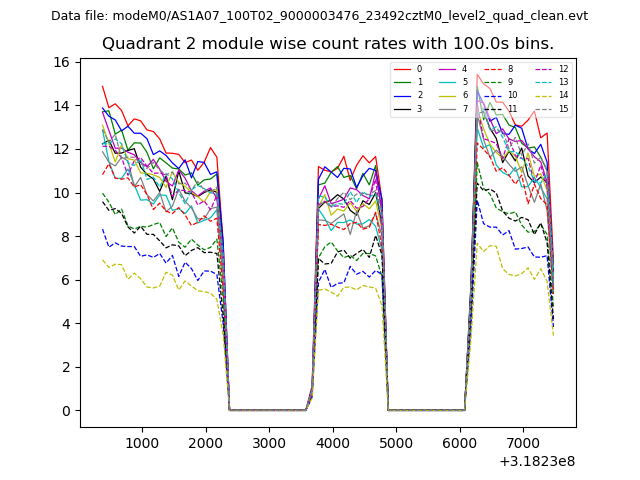
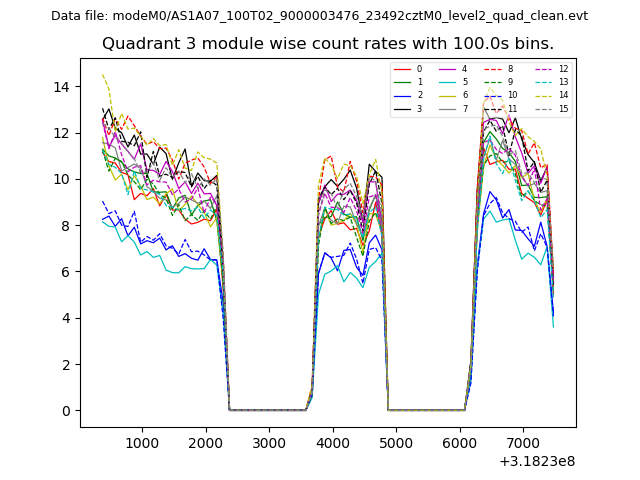
| Module-wise count rates for Quadrant C Data is divided into 100 sec bins |
 |
 |
| Module-wise count rates for Quadrant D Data is divided into 100 sec bins |
 |
 |
| Parameter | Plot |
|---|---|
| CZT HV Monitor | 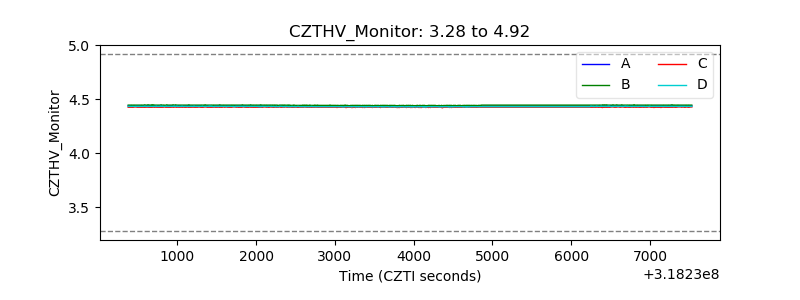 |
| D_VDD | 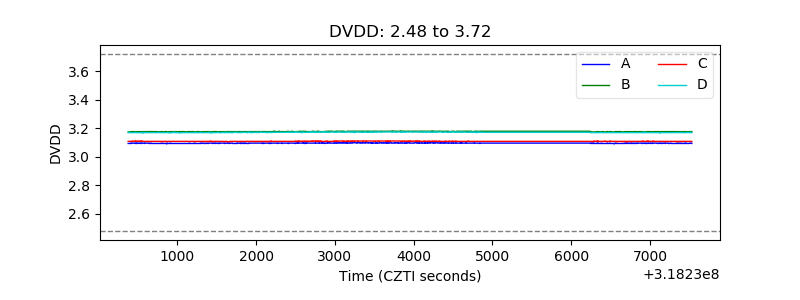 |
| Temperature 1 | 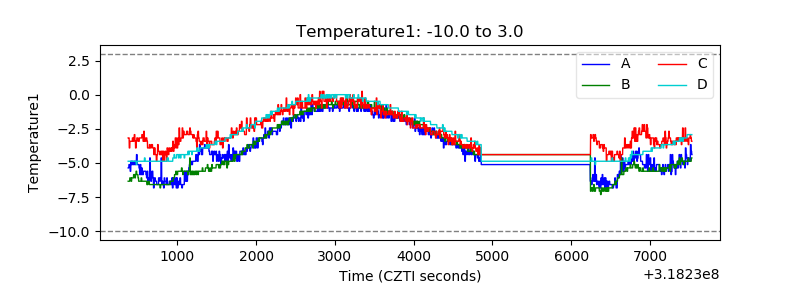 |
| Veto HV Monitor | 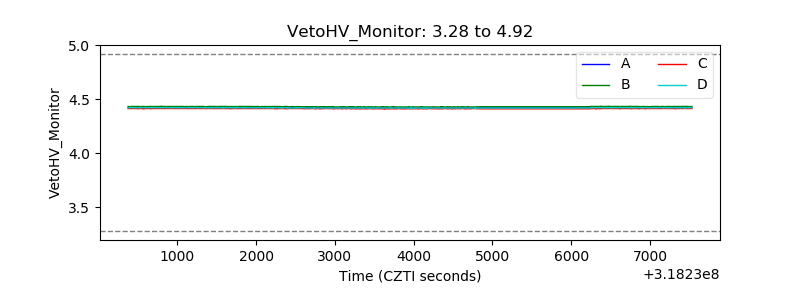 |
| Veto LLD | 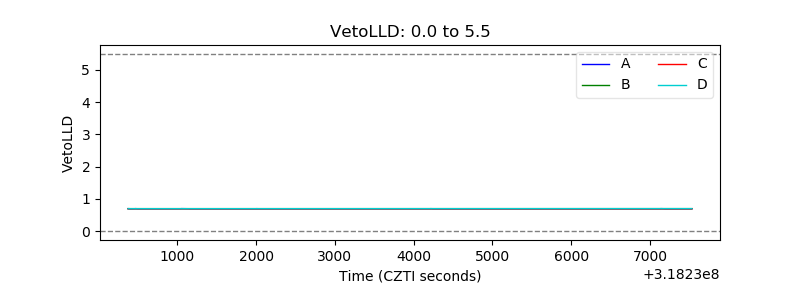 |
| Alpha Counter | 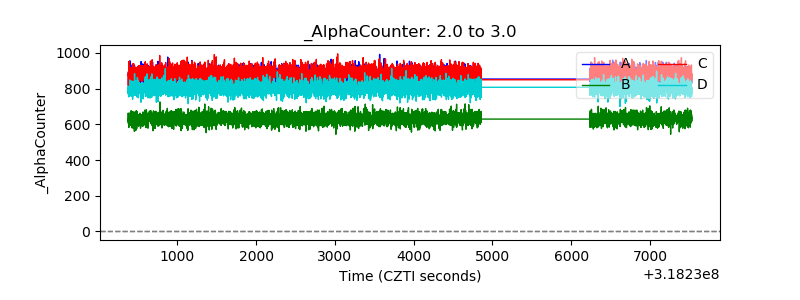 |
| _CPM_Rate | 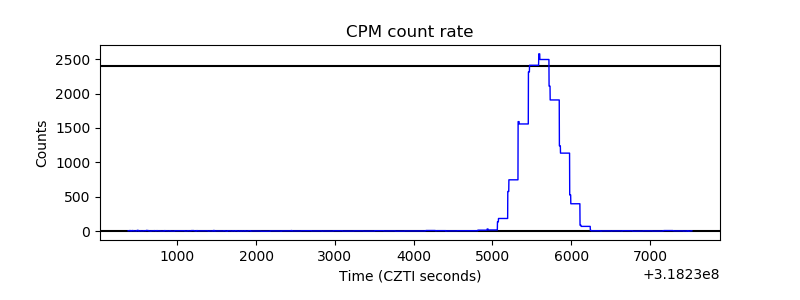 |
| CZT Counter | 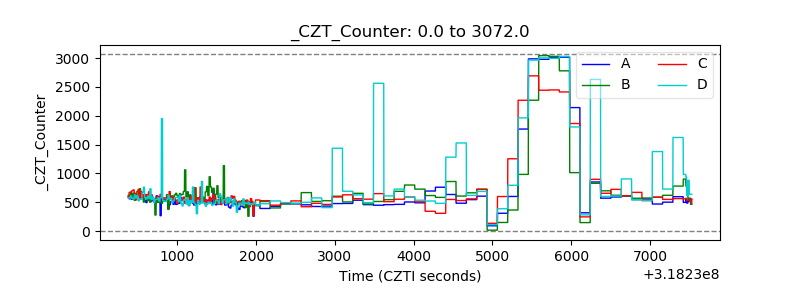 |
| +2.5 Volts monitor |  |
| +5 Volts monitor |  |
| _ROLL_ROT |  |
| _Roll_DEC | 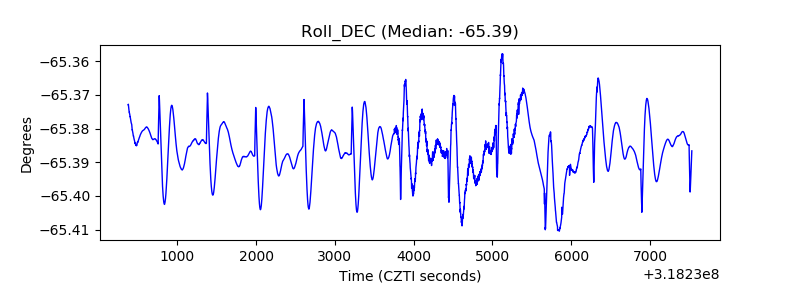 |
| _Roll_RA | 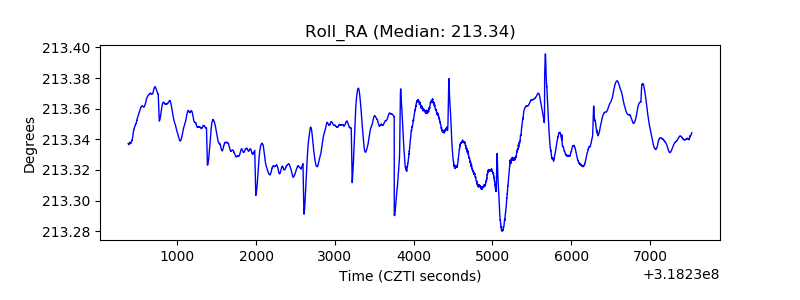 |
| Veto Counter | 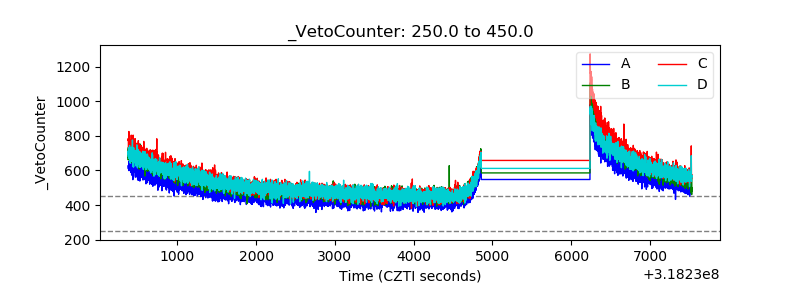 |