| Param | Original file | Final file |
|---|---|---|
| Filename | modeM0/AS1A07_100T02_9000003476_23493cztM0_level2.evt | modeM0/AS1A07_100T02_9000003476_23493cztM0_level2_quad_clean.evt |
| Size (bytes) | 518,569,920 | 108,803,520 |
| Size | 494.5 MB | 103.8 MB |
| Events in quadrant A | 3,117,771 | 734,972 |
| Events in quadrant B | 3,855,818 | 741,154 |
| Events in quadrant C | 3,628,722 | 717,409 |
| Events in quadrant D | 4,696,384 | 683,145 |
| Mode SS | |||
|---|---|---|---|
| Quadrant | BADHDUFLAG | Total packets | Discarded packets |
| A | 0 | 122 | 0 |
| B | 0 | 122 | 0 |
| C | 0 | 122 | 0 |
| D | 0 | 122 | 0 |
| Mode M9 | |||
|---|---|---|---|
| Quadrant | BADHDUFLAG | Total packets | Discarded packets |
| A | 0 | 13 | 0 |
| B | 0 | 13 | 0 |
| C | 0 | 13 | 0 |
| D | 0 | 13 | 0 |
| Mode M0 | |||
|---|---|---|---|
| Quadrant | BADHDUFLAG | Total packets | Discarded packets |
| A | 0 | 12670 | 1 |
| B | 0 | 15196 | 1 |
| C | 0 | 14382 | 1 |
| D | 0 | 17812 | 1 |
| Quadrant | Total seconds | Saturated seconds | Saturation percentage |
|---|---|---|---|
| A | 5989 | 44 | 0.734680% |
| B | 5990 | 154 | 2.570952% |
| C | 5990 | 169 | 2.821369% |
| D | 5990 | 485 | 8.096828% |
Noise dominated data is calculated using 1-second bins in cleaned event files. If a bin has >2000 counts, and if more than 50% of those come from <1% of pixels, then it is considered to be noise-dominated and hence unusable.
| Quadrant | # 1 sec bins | Bins with >0 counts | Bins with >2000 counts | High rate bins dominated by noise | Noise dominated (total time) | Noise dominated (detector-on time) | Marked lightcurve |
|---|---|---|---|---|---|---|---|
| A | 7324 | 5989 | 0 | 0 | 0.00% | 0.00% | 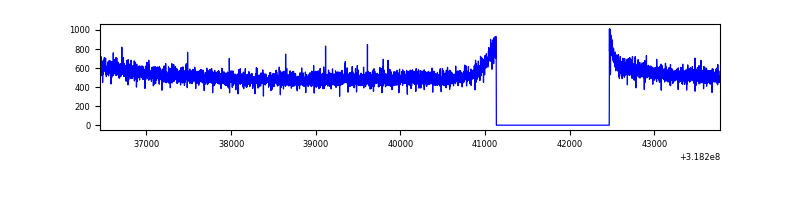 |
| B | 7325 | 5991 | 96 | 96 | 1.31% | 1.60% | 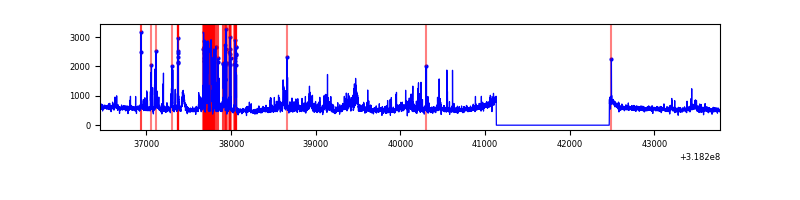 |
| C | 7325 | 5991 | 28 | 28 | 0.38% | 0.47% | 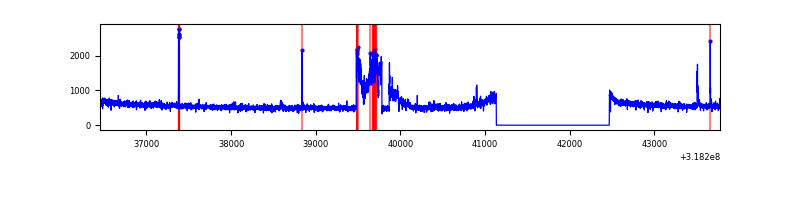 |
| D | 7325 | 5990 | 403 | 403 | 5.50% | 6.73% | 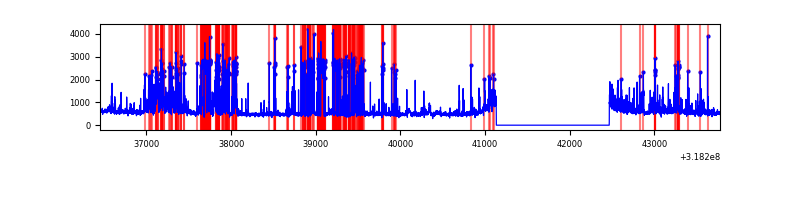 |
Top three noisy pixels from each quadrant. If the there are fewer than three noisy pixels in the level2.evt file, extra rows are filled as -1
| Pixel properties | Quadrant properties | ||||||
|---|---|---|---|---|---|---|---|
| Quadrant | DetID | PixID | Counts | Sigma | Mean | Median | Sigma |
| A | 13 | 254 | 9931 | 57.13 | 808 | 793 | 160.0 |
| A | 0 | 226 | 6899 | 38.17 | 808 | 793 | 160.0 |
| A | 3 | 137 | 6069 | 32.98 | 808 | 793 | 160.0 |
| B | 5 | 172 | 381512 | 2646.64 | 794 | 776 | 143.9 |
| B | 0 | 189 | 187878 | 1300.62 | 794 | 776 | 143.9 |
| B | 0 | 228 | 52497 | 359.53 | 794 | 776 | 143.9 |
| C | 8 | 208 | 354699 | 1946.98 | 787 | 795 | 181.8 |
| C | 14 | 238 | 126519 | 691.66 | 787 | 795 | 181.8 |
| C | 2 | 16 | 36975 | 199.04 | 787 | 795 | 181.8 |
| D | 1 | 52 | 1573281 | 8558.0 | 771 | 752 | 183.7 |
| D | 13 | 172 | 68163 | 366.86 | 771 | 752 | 183.7 |
| D | 12 | 233 | 52724 | 282.84 | 771 | 752 | 183.7 |
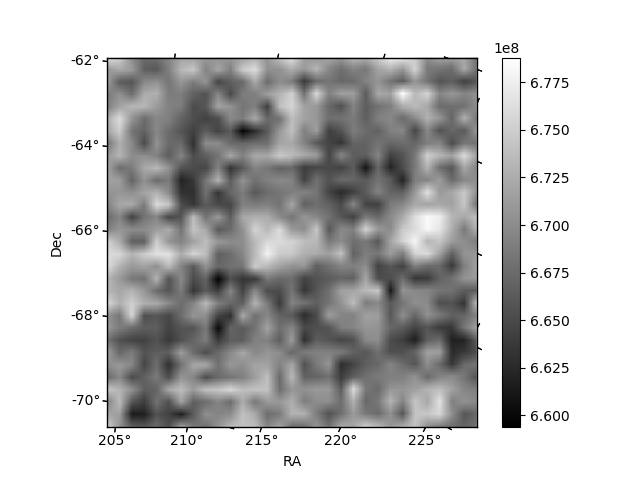
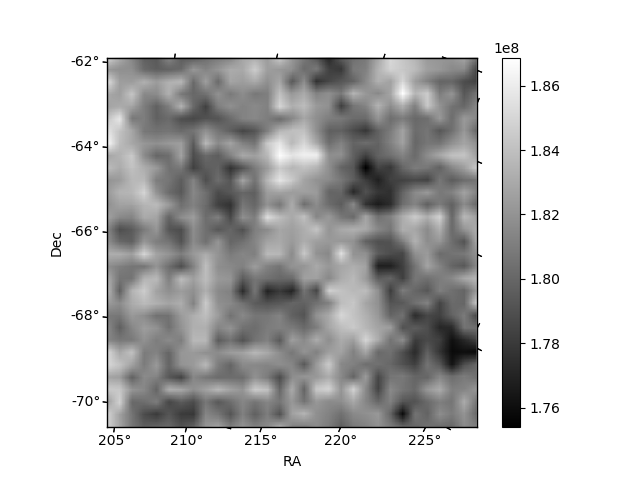
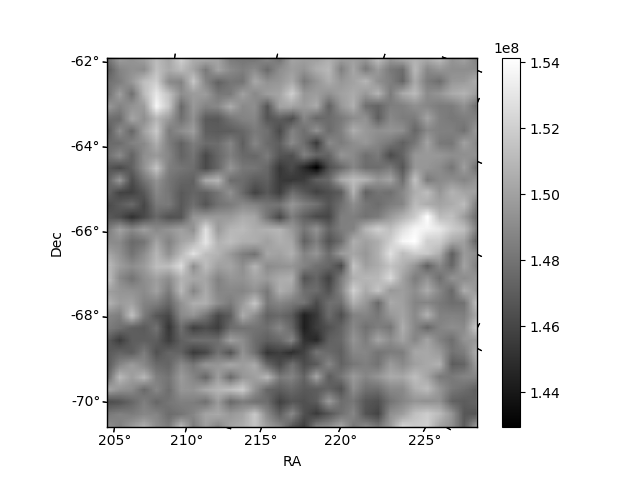
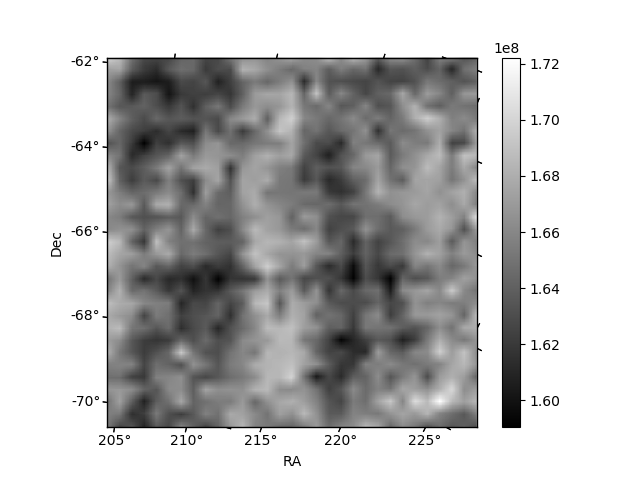
Histogram calculated using DETX and DETY for each event in the final _common_clean file
| Quadrant A | 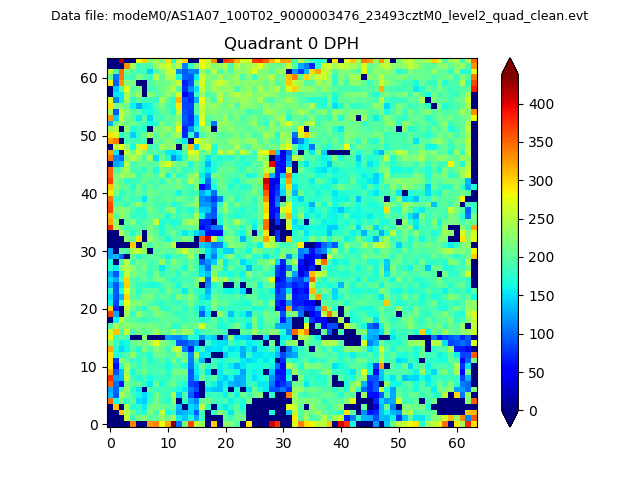 |
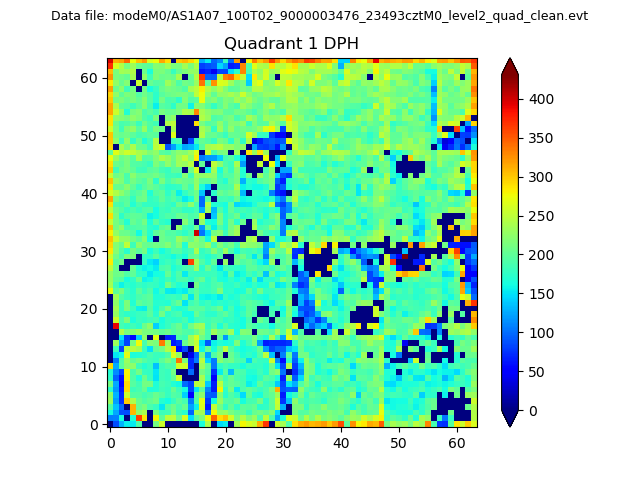 |
Quadrant B |
|---|---|---|---|
| Quadrant D | 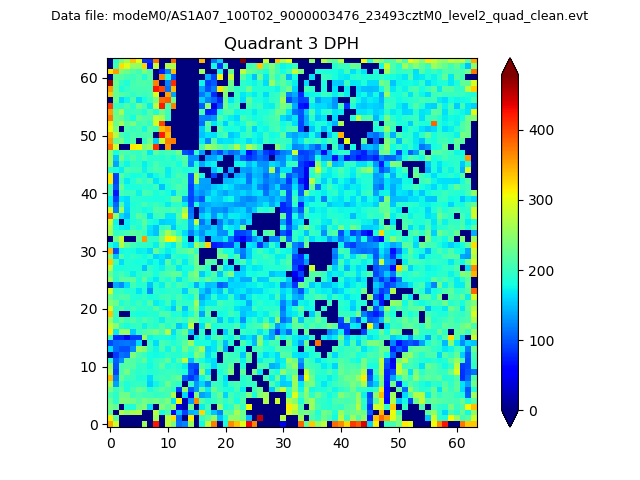 |
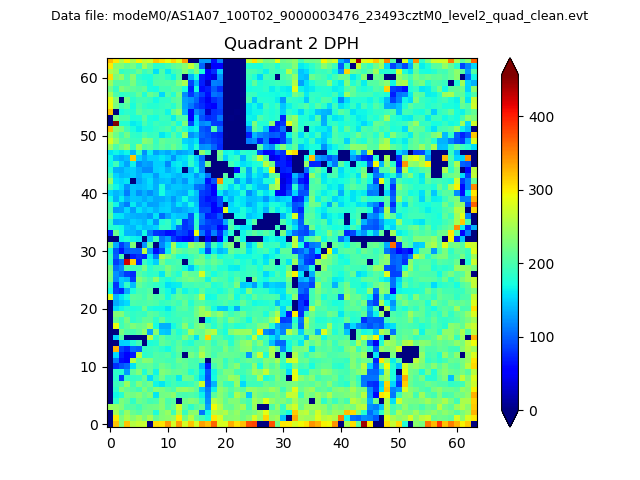 |
Quadrant C |
| Plot type | Count rate plots | Images |
|---|---|---|
| Comparison with Poisson distribution Blue bars denote a histogram of data divided into 1 sec bins. Red curve is a Poisson curve with rate = median count rate of data. |
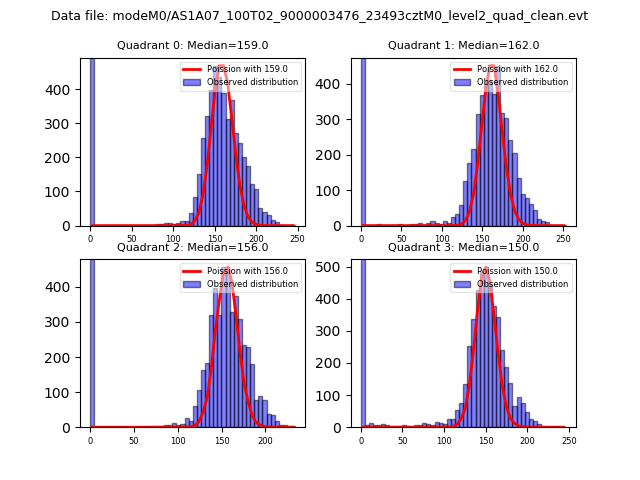 |
 |
| Quadrant-wise count rates Data is divided into 100 sec bins |
 |
|
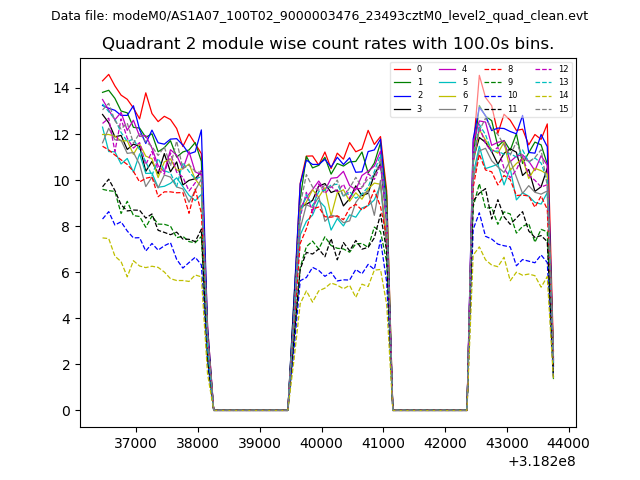
| Module-wise count rates for Quadrant A Data is divided into 100 sec bins |
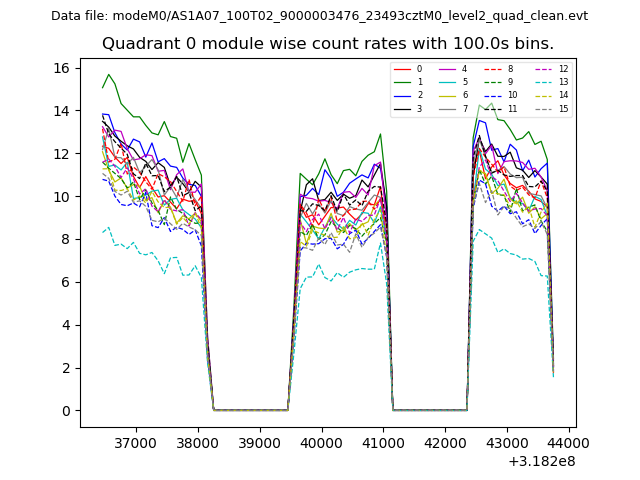 |
 |
| Module-wise count rates for Quadrant B Data is divided into 100 sec bins |
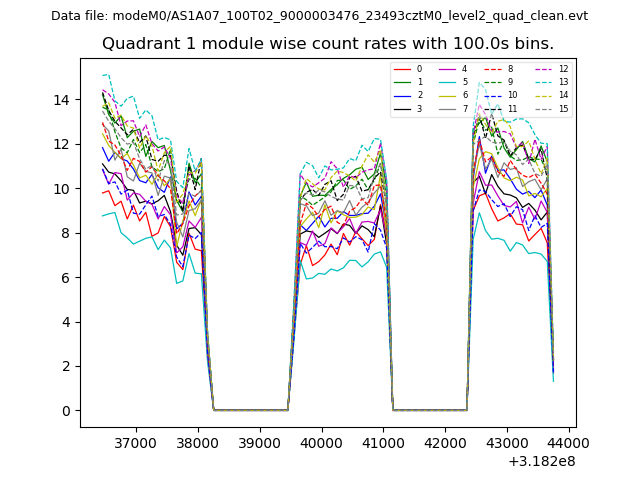 |
 |
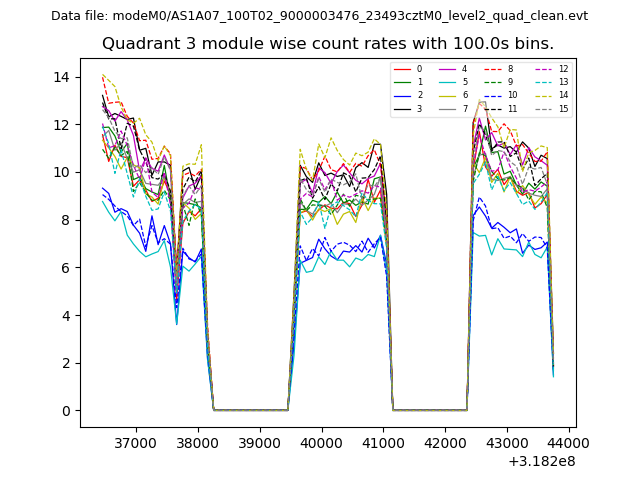
| Module-wise count rates for Quadrant C Data is divided into 100 sec bins |
 |
 |
| Module-wise count rates for Quadrant D Data is divided into 100 sec bins |
 |
 |
| Parameter | Plot |
|---|---|
| CZT HV Monitor |  |
| D_VDD | 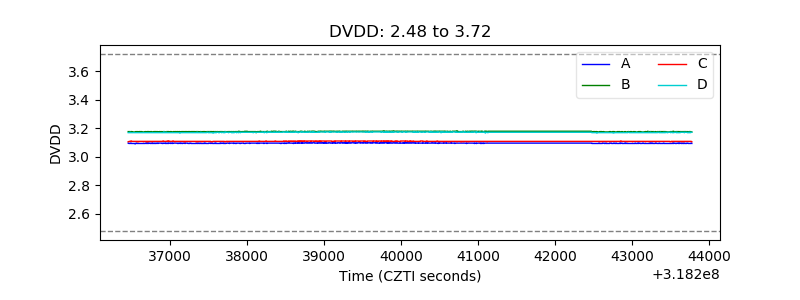 |
| Temperature 1 | 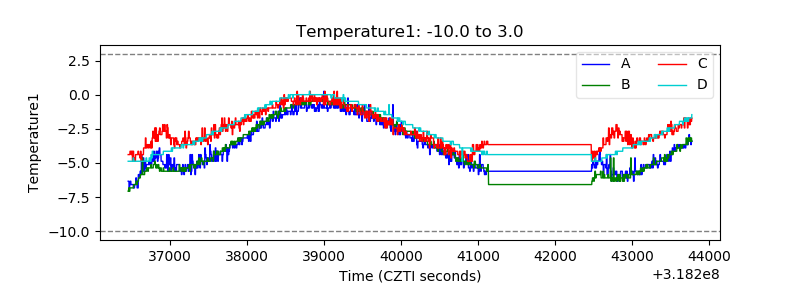 |
| Veto HV Monitor | 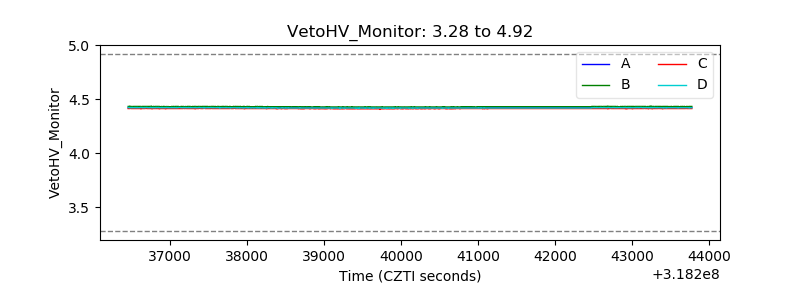 |
| Veto LLD | 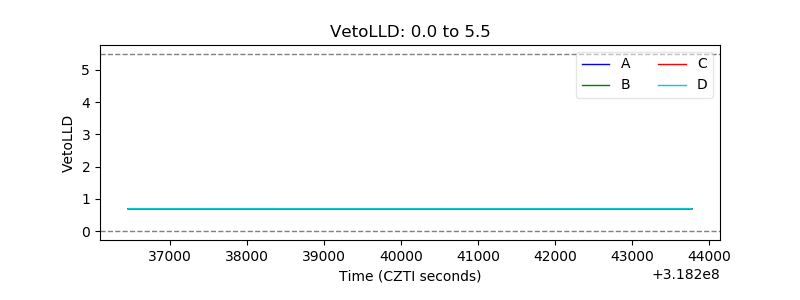 |
| Alpha Counter | 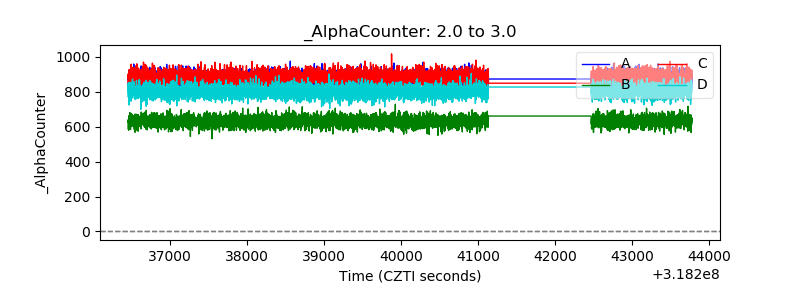 |
| _CPM_Rate | 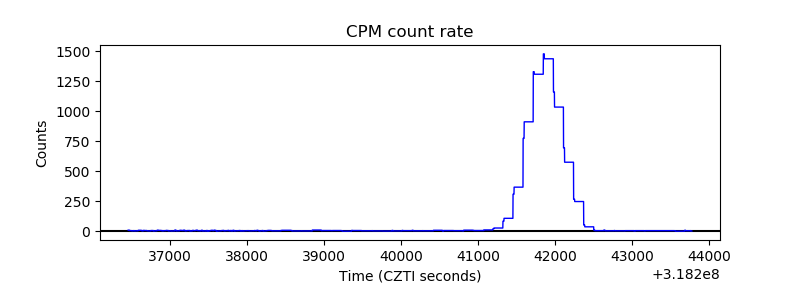 |
| CZT Counter | 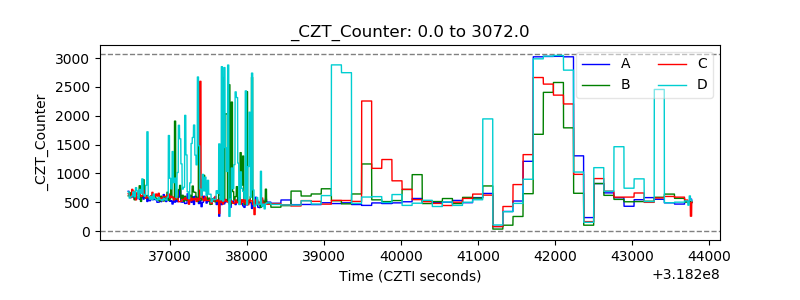 |
| +2.5 Volts monitor |  |
| +5 Volts monitor |  |
| _ROLL_ROT | 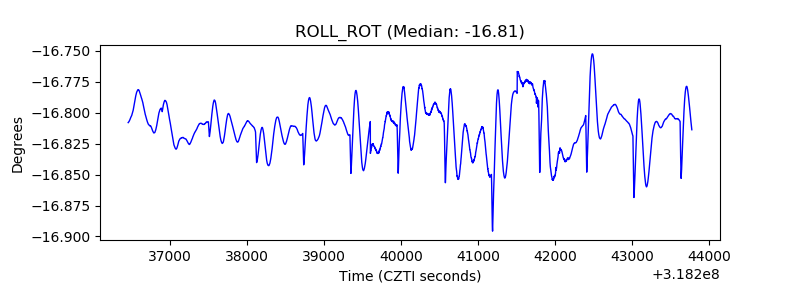 |
| _Roll_DEC | 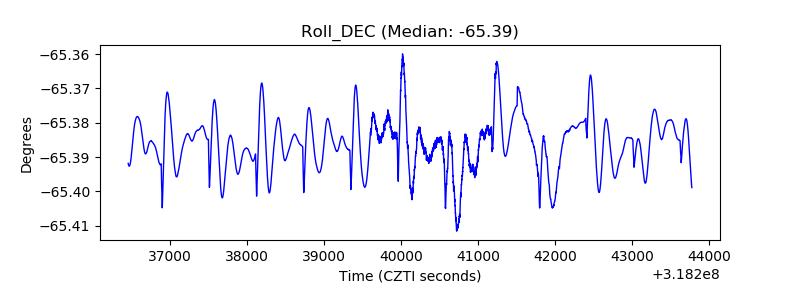 |
| _Roll_RA | 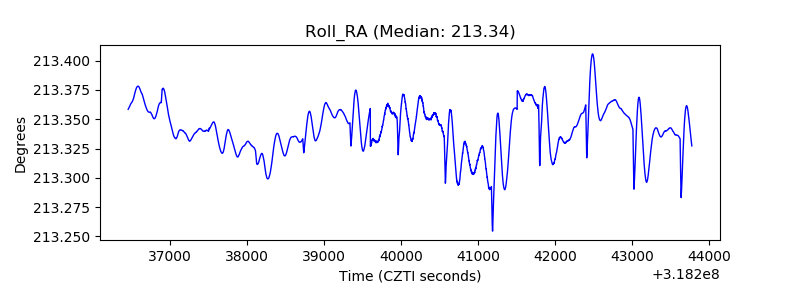 |
| Veto Counter | 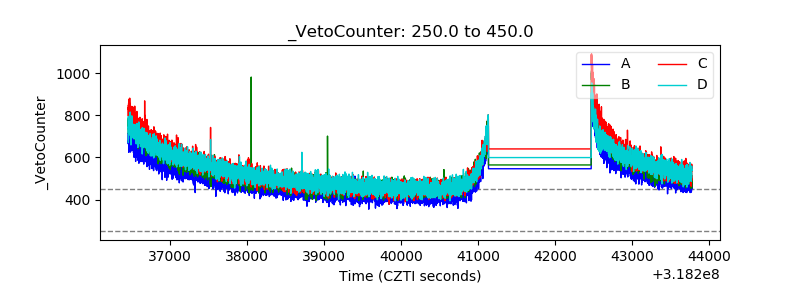 |