| Param | Original file | Final file |
|---|---|---|
| Filename | modeM0/AS1A07_100T02_9000003476_23494cztM0_level2.evt | modeM0/AS1A07_100T02_9000003476_23494cztM0_level2_quad_clean.evt |
| Size (bytes) | 479,450,880 | 104,408,640 |
| Size | 457.2 MB | 99.6 MB |
| Events in quadrant A | 3,103,923 | 695,143 |
| Events in quadrant B | 3,384,721 | 706,275 |
| Events in quadrant C | 3,679,270 | 673,490 |
| Events in quadrant D | 3,934,571 | 657,440 |
| Mode SS | |||
|---|---|---|---|
| Quadrant | BADHDUFLAG | Total packets | Discarded packets |
| A | 0 | 126 | 0 |
| B | 0 | 126 | 0 |
| C | 0 | 126 | 0 |
| D | 0 | 126 | 0 |
| Mode M9 | |||
|---|---|---|---|
| Quadrant | BADHDUFLAG | Total packets | Discarded packets |
| A | 0 | 12 | 0 |
| B | 0 | 12 | 0 |
| C | 0 | 12 | 0 |
| D | 0 | 12 | 0 |
| Mode M0 | |||
|---|---|---|---|
| Quadrant | BADHDUFLAG | Total packets | Discarded packets |
| A | 0 | 12770 | 1 |
| B | 0 | 13611 | 1 |
| C | 0 | 14658 | 1 |
| D | 0 | 15565 | 1 |
| Quadrant | Total seconds | Saturated seconds | Saturation percentage |
|---|---|---|---|
| A | 6151 | 49 | 0.796618% |
| B | 6151 | 64 | 1.040481% |
| C | 6151 | 156 | 2.536173% |
| D | 6151 | 179 | 2.910096% |
Noise dominated data is calculated using 1-second bins in cleaned event files. If a bin has >2000 counts, and if more than 50% of those come from <1% of pixels, then it is considered to be noise-dominated and hence unusable.
| Quadrant | # 1 sec bins | Bins with >0 counts | Bins with >2000 counts | High rate bins dominated by noise | Noise dominated (total time) | Noise dominated (detector-on time) | Marked lightcurve |
|---|---|---|---|---|---|---|---|
| A | 7346 | 6151 | 0 | 0 | 0.00% | 0.00% | 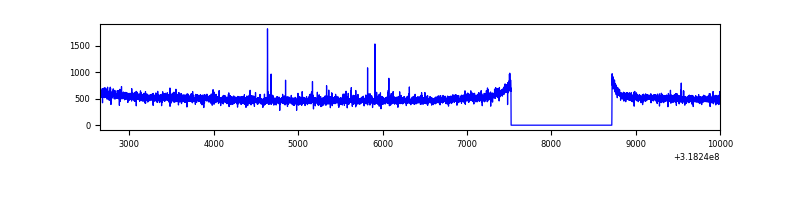 |
| B | 7346 | 6152 | 4 | 4 | 0.05% | 0.07% | 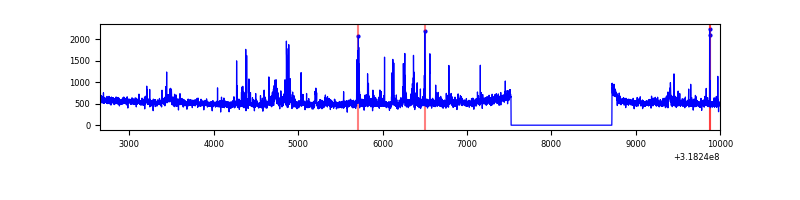 |
| C | 7346 | 6151 | 14 | 14 | 0.19% | 0.23% | 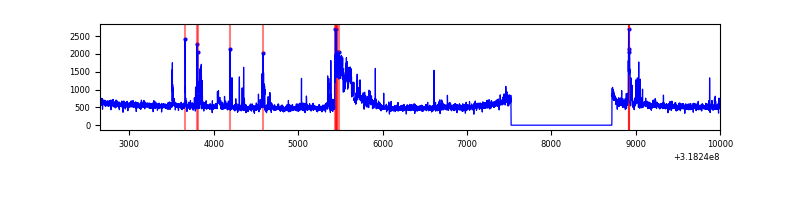 |
| D | 7346 | 6152 | 136 | 136 | 1.85% | 2.21% | 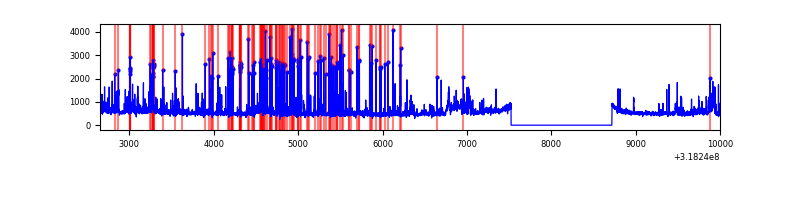 |
Top three noisy pixels from each quadrant. If the there are fewer than three noisy pixels in the level2.evt file, extra rows are filled as -1
| Pixel properties | Quadrant properties | ||||||
|---|---|---|---|---|---|---|---|
| Quadrant | DetID | PixID | Counts | Sigma | Mean | Median | Sigma |
| A | 13 | 254 | 10401 | 60.48 | 800 | 785 | 159.0 |
| A | 15 | 174 | 6884 | 38.36 | 800 | 785 | 159.0 |
| A | 0 | 226 | 6833 | 38.04 | 800 | 785 | 159.0 |
| B | 0 | 189 | 147750 | 1009.93 | 791 | 772 | 145.5 |
| B | 0 | 229 | 28018 | 187.22 | 791 | 772 | 145.5 |
| B | 15 | 33 | 22399 | 148.61 | 791 | 772 | 145.5 |
| C | 8 | 208 | 298657 | 1676.84 | 773 | 781 | 177.6 |
| C | 14 | 238 | 125057 | 699.59 | 773 | 781 | 177.6 |
| C | 2 | 16 | 116590 | 651.93 | 773 | 781 | 177.6 |
| D | 1 | 52 | 797816 | 4254.41 | 781 | 759 | 187.3 |
| D | 13 | 172 | 63875 | 336.89 | 781 | 759 | 187.3 |
| D | 12 | 233 | 44022 | 230.92 | 781 | 759 | 187.3 |
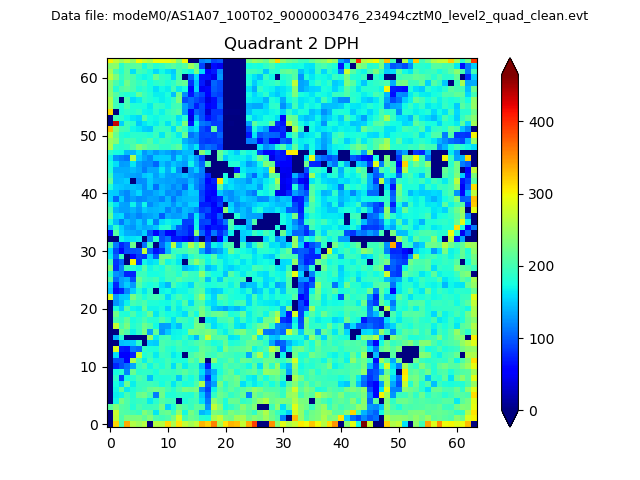
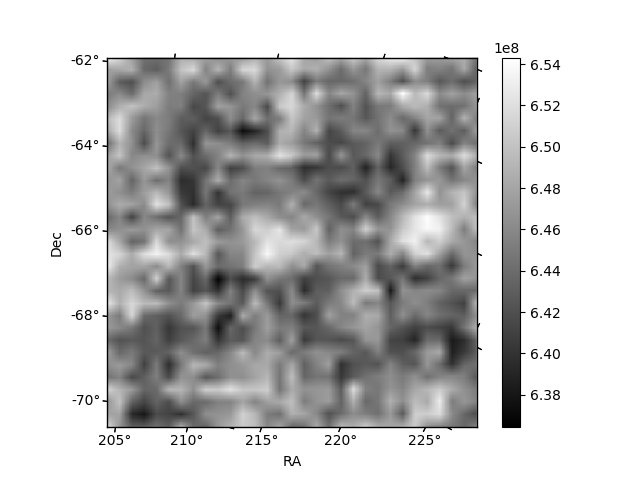
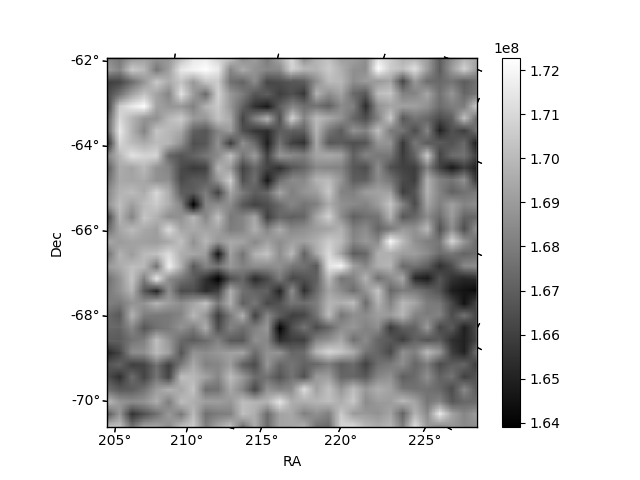
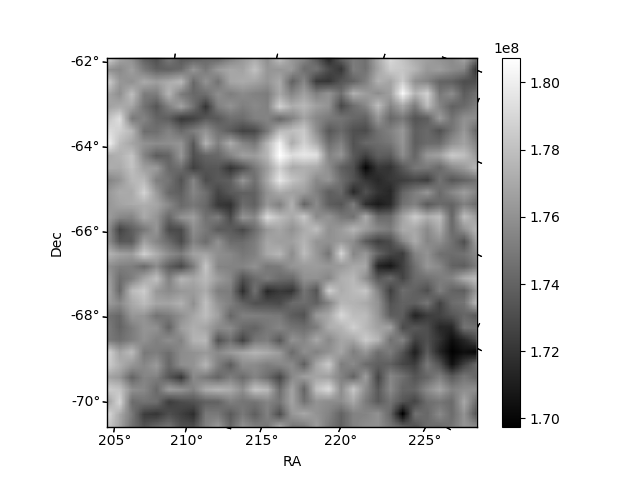
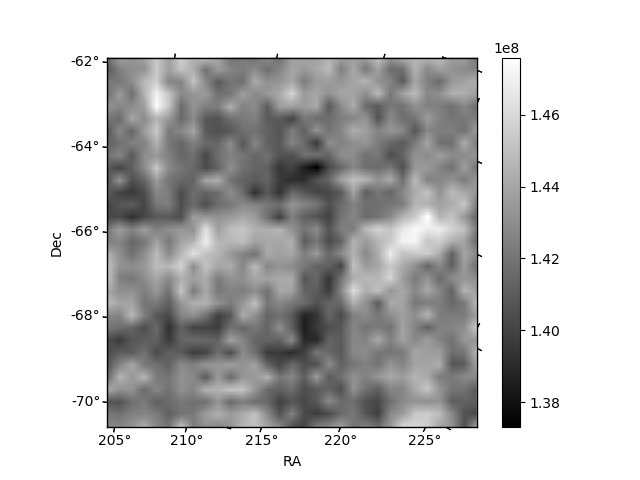
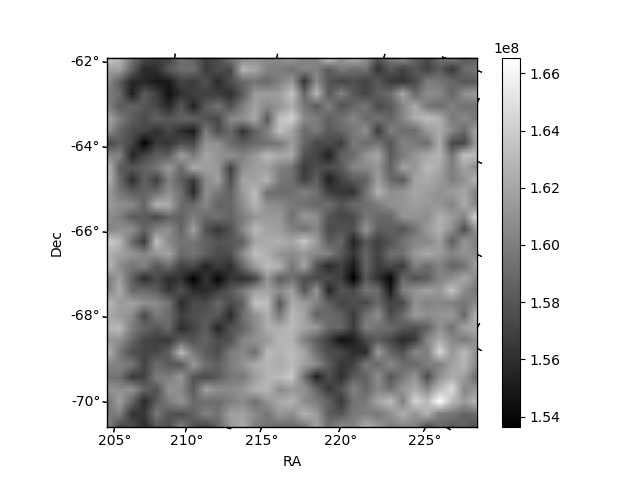
Histogram calculated using DETX and DETY for each event in the final _common_clean file
| Quadrant A | 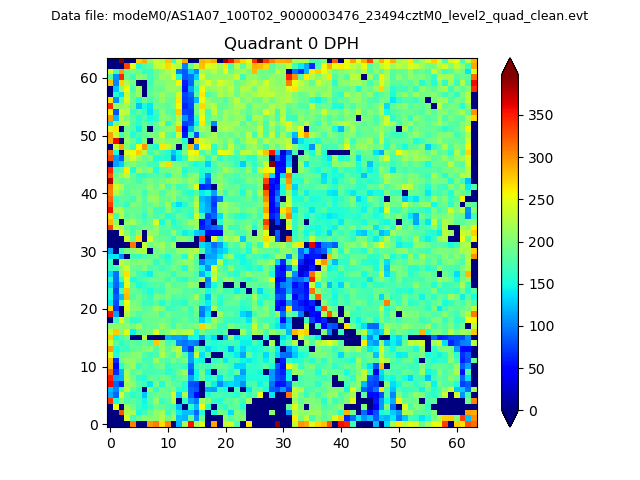 |
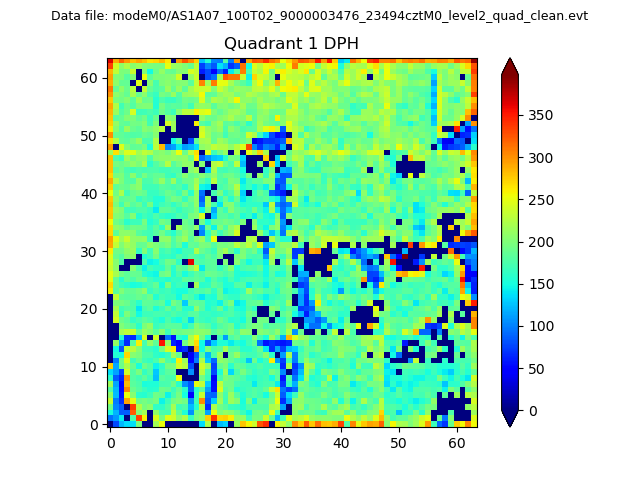 |
Quadrant B |
|---|---|---|---|
| Quadrant D | 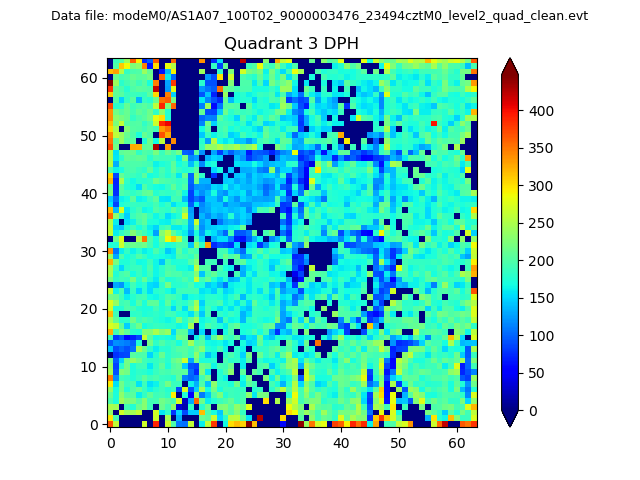 |
 |
Quadrant C |
| Plot type | Count rate plots | Images |
|---|---|---|
| Comparison with Poisson distribution Blue bars denote a histogram of data divided into 1 sec bins. Red curve is a Poisson curve with rate = median count rate of data. |
 |
 |
| Quadrant-wise count rates Data is divided into 100 sec bins |
 |
|
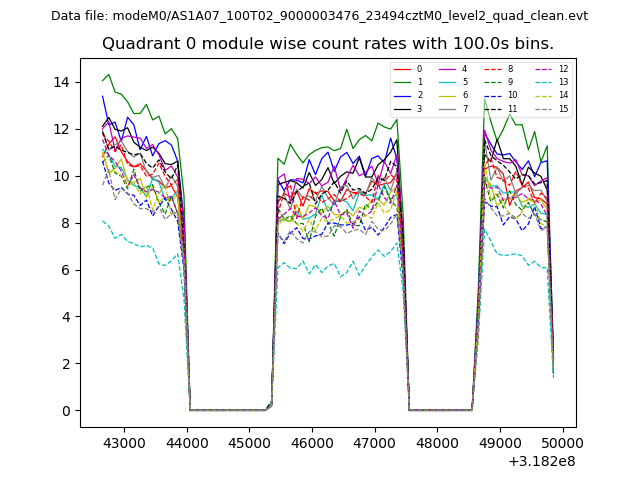
| Module-wise count rates for Quadrant A Data is divided into 100 sec bins |
 |
 |
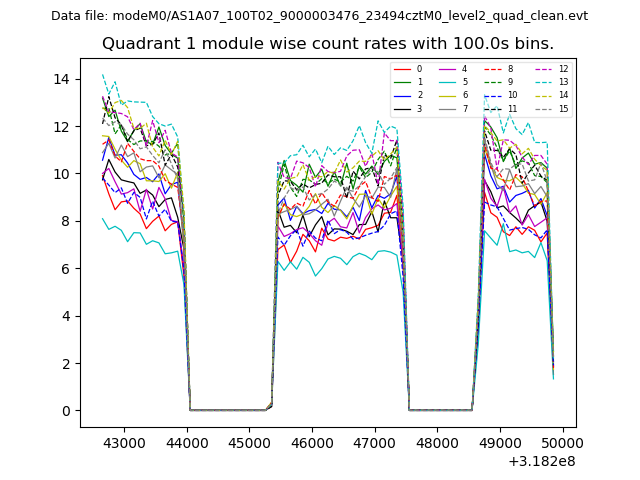
| Module-wise count rates for Quadrant B Data is divided into 100 sec bins |
 |
 |
| Module-wise count rates for Quadrant C Data is divided into 100 sec bins |
 |
 |
| Module-wise count rates for Quadrant D Data is divided into 100 sec bins |
 |
 |
| Parameter | Plot |
|---|---|
| CZT HV Monitor | 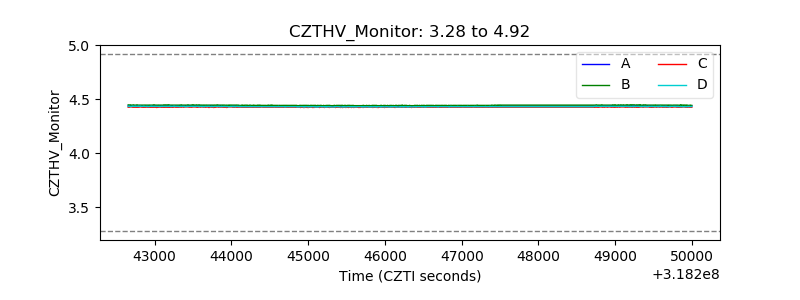 |
| D_VDD | 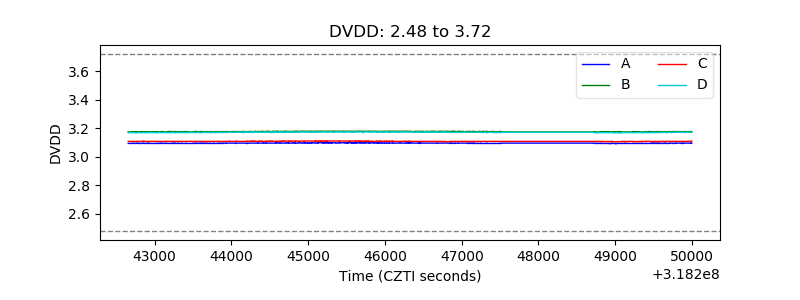 |
| Temperature 1 | 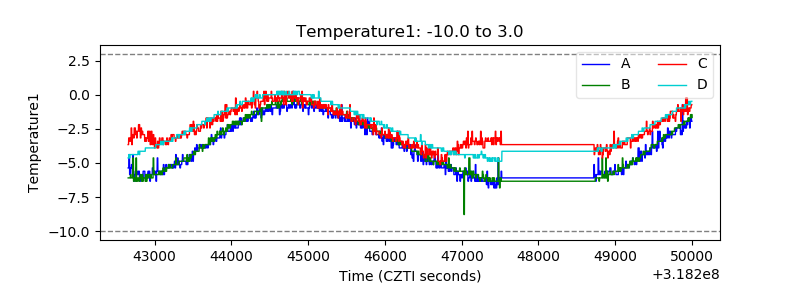 |
| Veto HV Monitor | 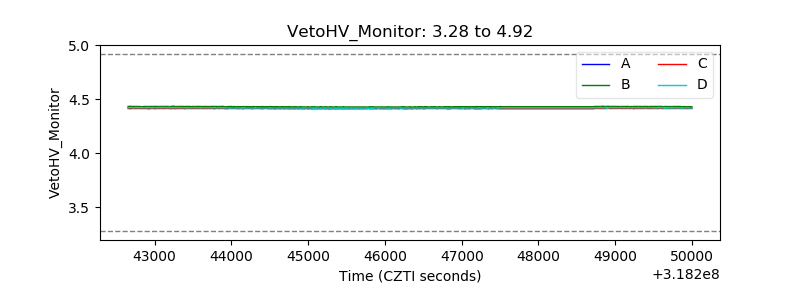 |
| Veto LLD | 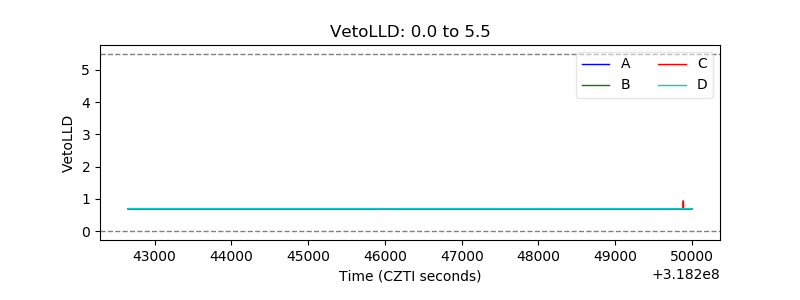 |
| Alpha Counter |  |
| _CPM_Rate | 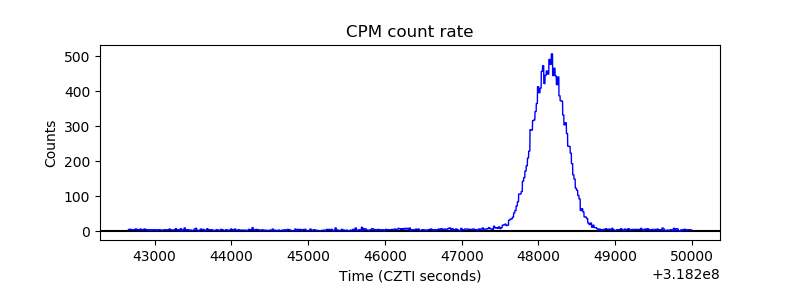 |
| CZT Counter | 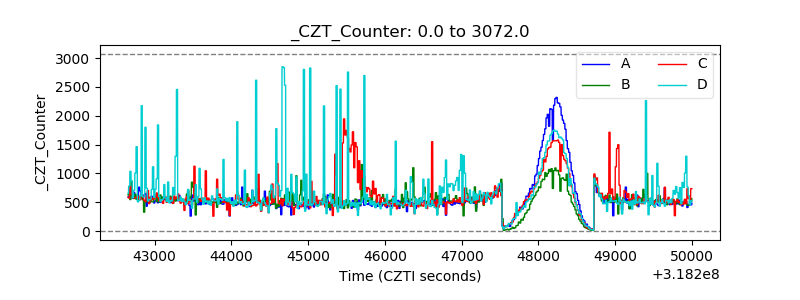 |
| +2.5 Volts monitor |  |
| +5 Volts monitor |  |
| _ROLL_ROT | 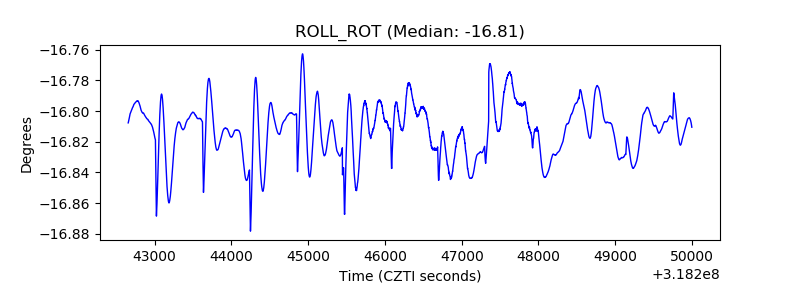 |
| _Roll_DEC |  |
| _Roll_RA | 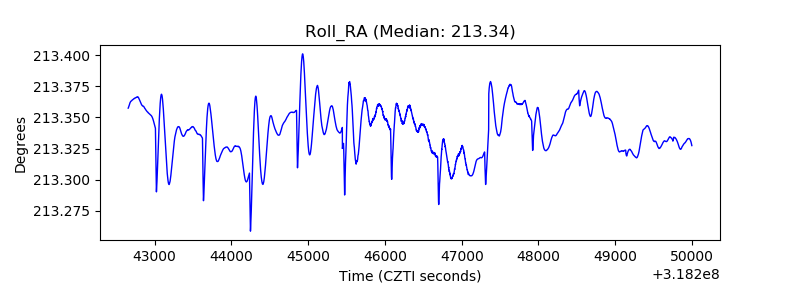 |
| Veto Counter | 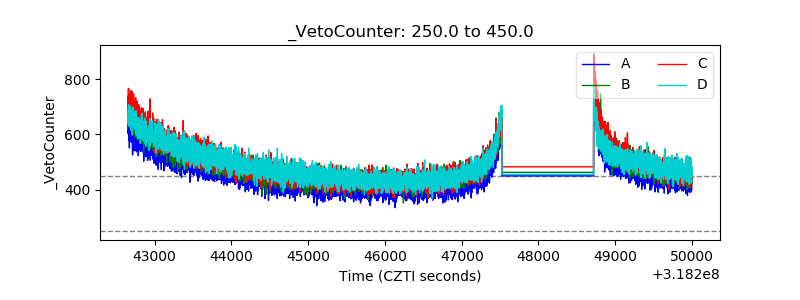 |