| Param | Original file | Final file |
|---|---|---|
| Filename | modeM0/AS1A07_100T02_9000003476_23495cztM0_level2.evt | modeM0/AS1A07_100T02_9000003476_23495cztM0_level2_quad_clean.evt |
| Size (bytes) | 143,254,080 | 24,534,720 |
| Size | 136.6 MB | 23.4 MB |
| Events in quadrant A | 948,608 | 152,463 |
| Events in quadrant B | 1,034,637 | 158,665 |
| Events in quadrant C | 1,179,050 | 147,306 |
| Events in quadrant D | 1,045,178 | 146,027 |
| Mode SS | |||
|---|---|---|---|
| Quadrant | BADHDUFLAG | Total packets | Discarded packets |
| A | 0 | 41 | 5 |
| B | 0 | 41 | 5 |
| C | 0 | 40 | 4 |
| D | 0 | 39 | 3 |
| Mode M9 | |||
|---|---|---|---|
| Quadrant | BADHDUFLAG | Total packets | Discarded packets |
| A | 0 | 3 | 2 |
| B | 0 | 3 | 1 |
| C | 0 | 3 | 1 |
| D | 0 | 3 | 1 |
| Mode M0 | |||
|---|---|---|---|
| Quadrant | BADHDUFLAG | Total packets | Discarded packets |
| A | 0 | 4209 | 244 |
| B | 0 | 4409 | 210 |
| C | 0 | 4928 | 243 |
| D | 0 | 4509 | 261 |
| Quadrant | Total seconds | Saturated seconds | Saturation percentage |
|---|---|---|---|
| A | 1893 | 35 | 1.848917% |
| B | 1906 | 60 | 3.147954% |
| C | 1897 | 122 | 6.431207% |
| D | 1892 | 23 | 1.215645% |
Noise dominated data is calculated using 1-second bins in cleaned event files. If a bin has >2000 counts, and if more than 50% of those come from <1% of pixels, then it is considered to be noise-dominated and hence unusable.
| Quadrant | # 1 sec bins | Bins with >0 counts | Bins with >2000 counts | High rate bins dominated by noise | Noise dominated (total time) | Noise dominated (detector-on time) | Marked lightcurve |
|---|---|---|---|---|---|---|---|
| A | 2832 | 1905 | 0 | 0 | 0.00% | 0.00% | 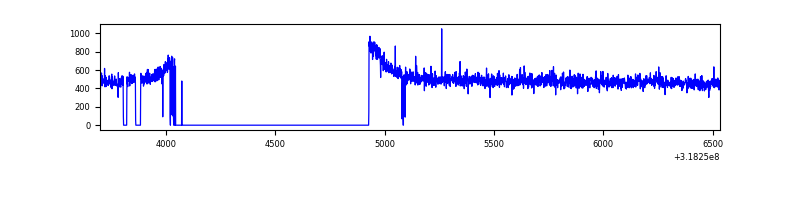 |
| B | 2834 | 1916 | 0 | 0 | 0.00% | 0.00% | 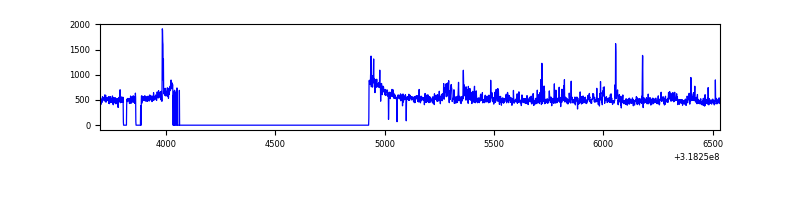 |
| C | 2834 | 1910 | 18 | 18 | 0.64% | 0.94% | 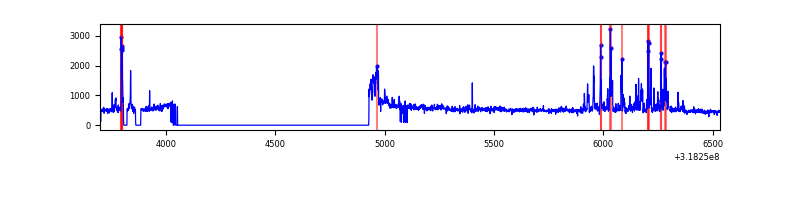 |
| D | 2833 | 1905 | 7 | 7 | 0.25% | 0.37% | 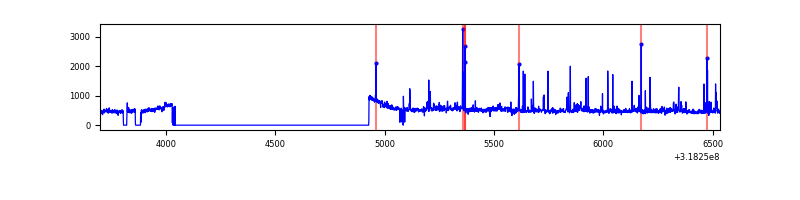 |
Top three noisy pixels from each quadrant. If the there are fewer than three noisy pixels in the level2.evt file, extra rows are filled as -1
| Pixel properties | Quadrant properties | ||||||
|---|---|---|---|---|---|---|---|
| Quadrant | DetID | PixID | Counts | Sigma | Mean | Median | Sigma |
| A | 13 | 254 | 3112 | 55.87 | 245 | 240 | 51.4 |
| A | 0 | 226 | 2156 | 37.27 | 245 | 240 | 51.4 |
| A | 3 | 137 | 2103 | 36.24 | 245 | 240 | 51.4 |
| B | 0 | 189 | 44531 | 916.25 | 244 | 238 | 48.3 |
| B | 5 | 172 | 9870 | 199.25 | 244 | 238 | 48.3 |
| B | 0 | 229 | 6240 | 124.16 | 244 | 238 | 48.3 |
| C | 0 | 207 | 120538 | 2143.88 | 236 | 236 | 56.1 |
| C | 7 | 247 | 50563 | 896.87 | 236 | 236 | 56.1 |
| C | 14 | 238 | 36785 | 651.33 | 236 | 236 | 56.1 |
| D | 1 | 52 | 71599 | 1185.99 | 244 | 237 | 60.2 |
| D | 13 | 174 | 32497 | 536.14 | 244 | 237 | 60.2 |
| D | 2 | 234 | 7652 | 123.23 | 244 | 237 | 60.2 |
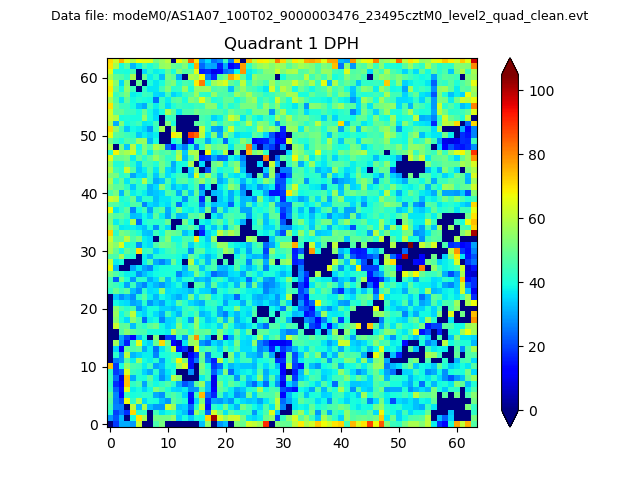
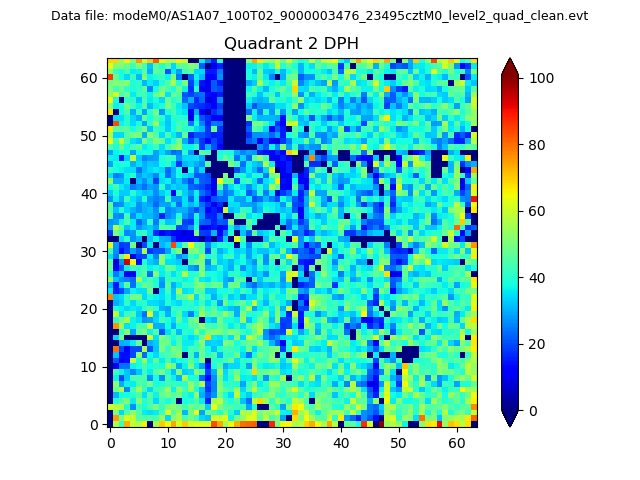
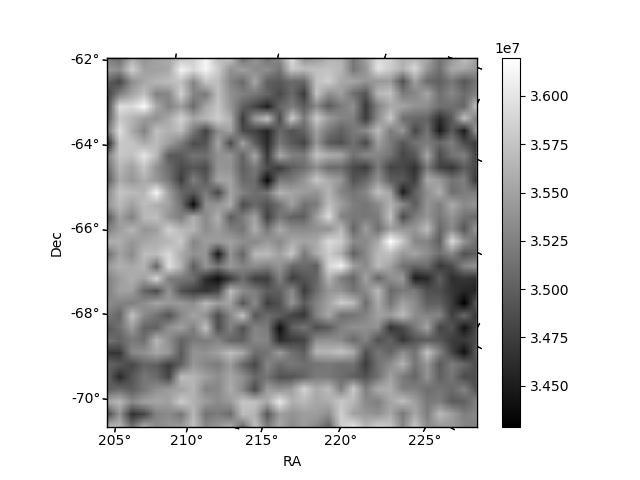
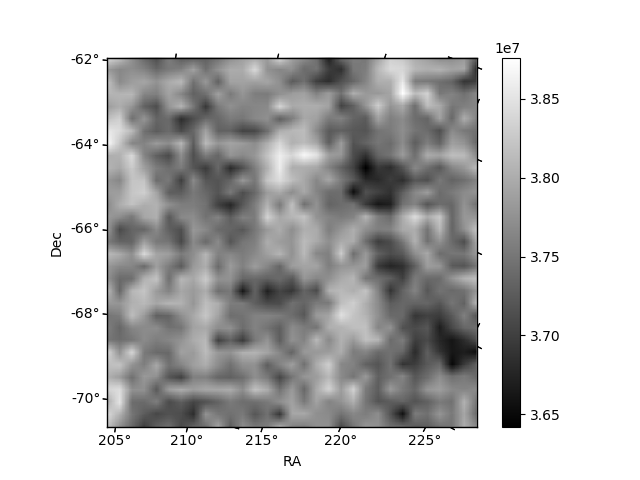
Histogram calculated using DETX and DETY for each event in the final _common_clean file
| Quadrant A |  |
 |
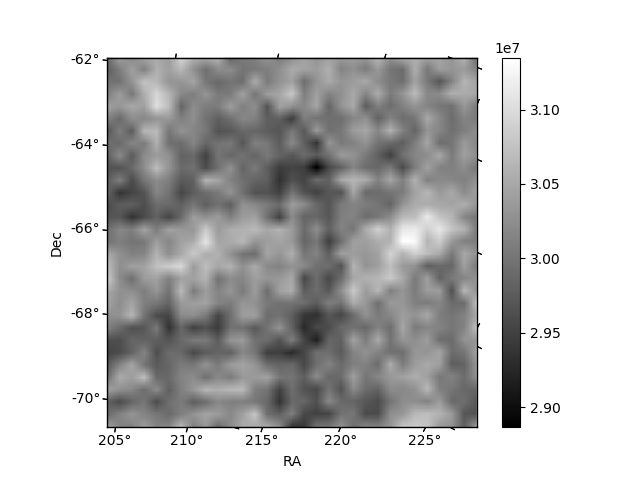
Quadrant B |
|---|---|---|---|
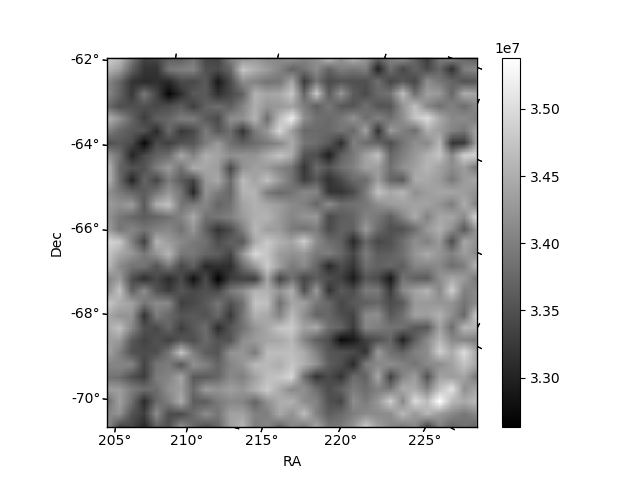
| Quadrant D | 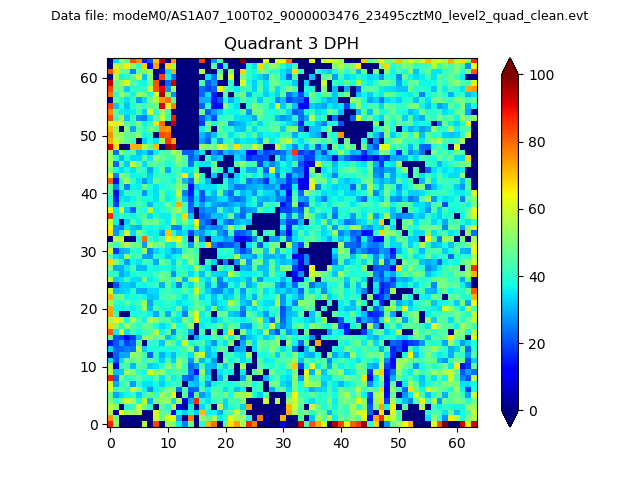 |
 |
Quadrant C |
| Plot type | Count rate plots | Images |
|---|---|---|
| Comparison with Poisson distribution Blue bars denote a histogram of data divided into 1 sec bins. Red curve is a Poisson curve with rate = median count rate of data. |
 |
 |
| Quadrant-wise count rates Data is divided into 100 sec bins |
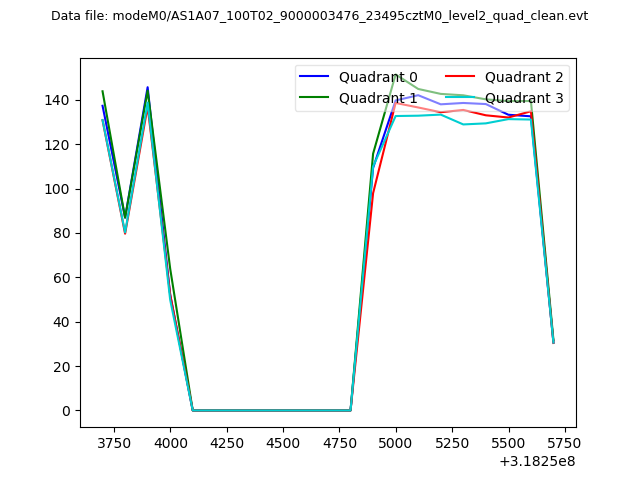 |
|
| Module-wise count rates for Quadrant A Data is divided into 100 sec bins |
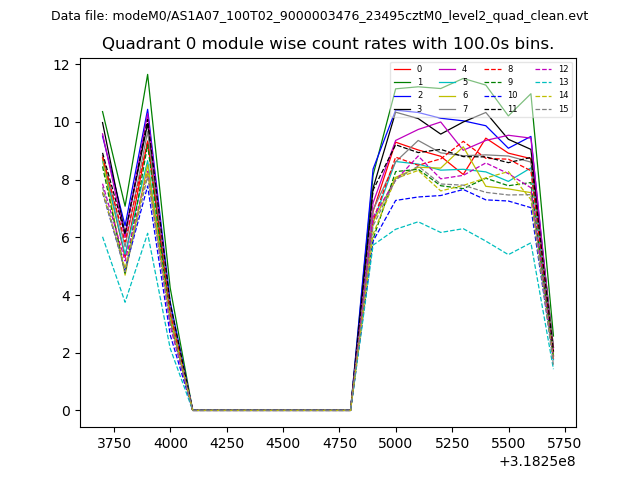 |
 |
| Module-wise count rates for Quadrant B Data is divided into 100 sec bins |
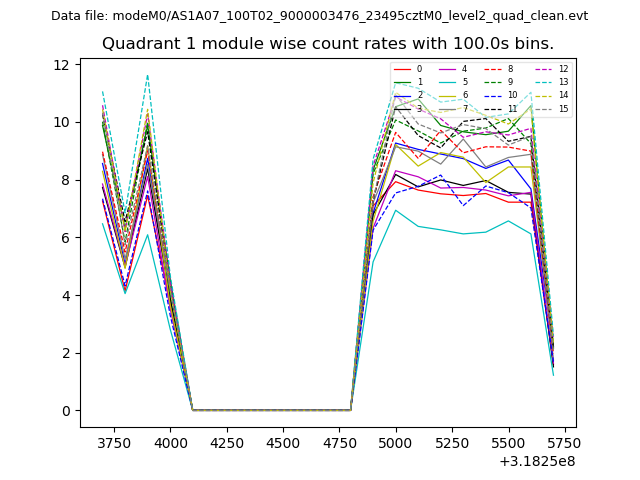 |
 |
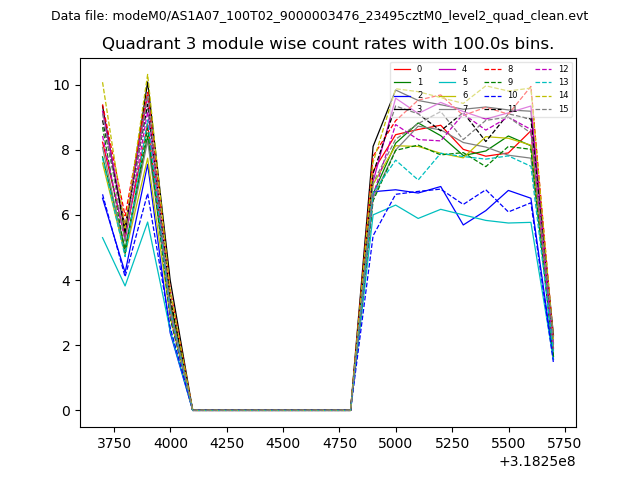
| Module-wise count rates for Quadrant C Data is divided into 100 sec bins |
 |
 |
| Module-wise count rates for Quadrant D Data is divided into 100 sec bins |
 |
 |
| Parameter | Plot |
|---|---|
| CZT HV Monitor | 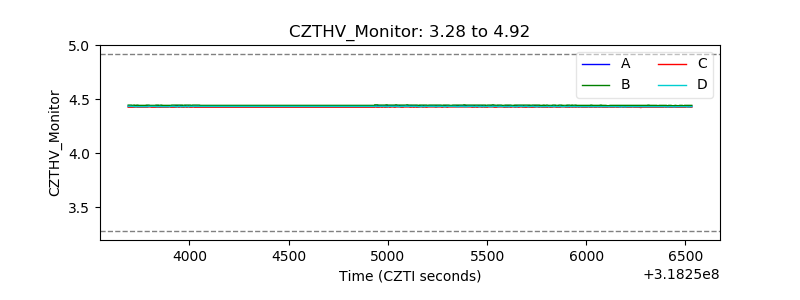 |
| D_VDD | 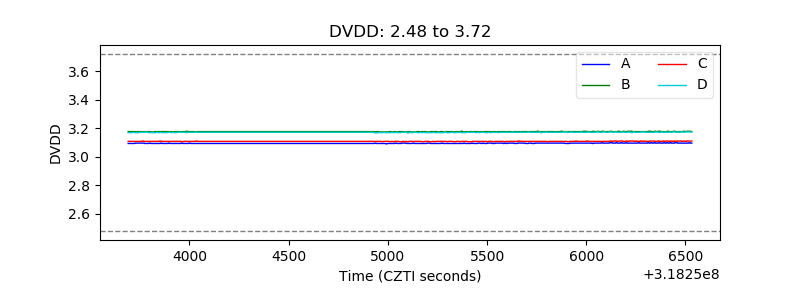 |
| Temperature 1 | 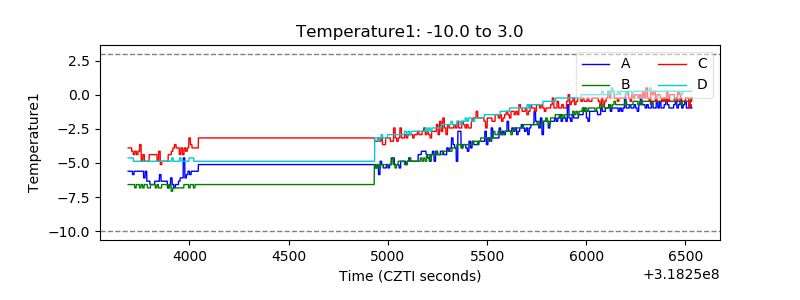 |
| Veto HV Monitor | 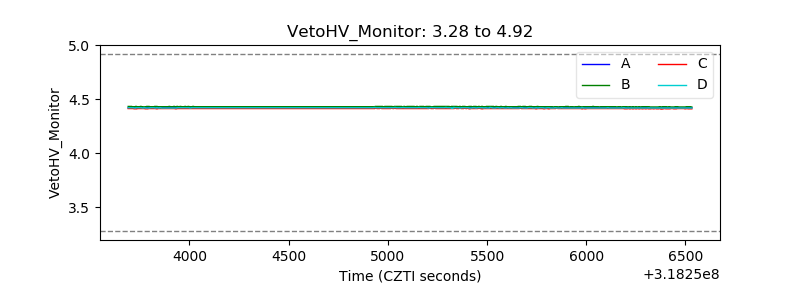 |
| Veto LLD | 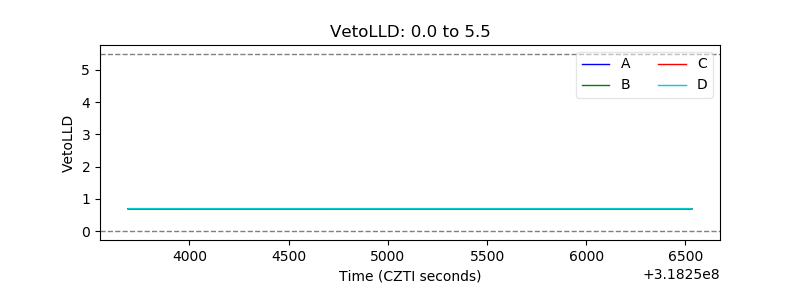 |
| Alpha Counter | 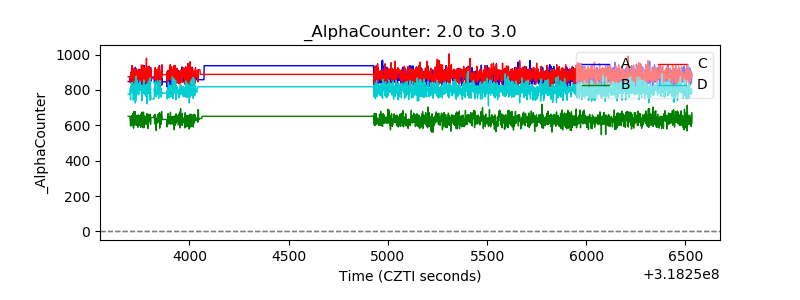 |
| _CPM_Rate | 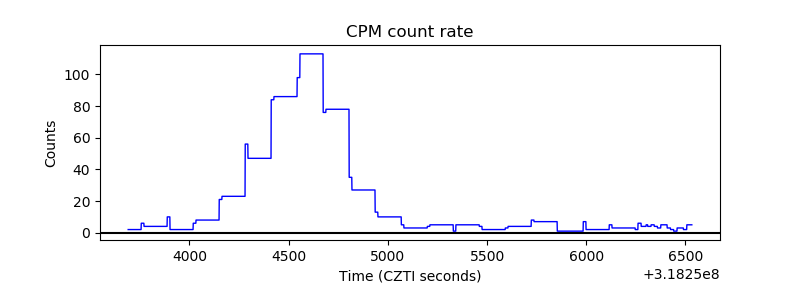 |
| CZT Counter | 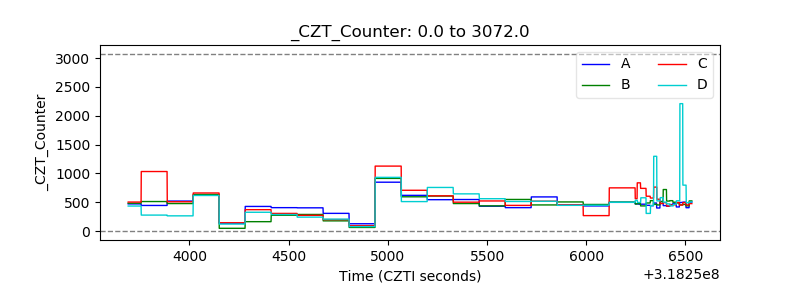 |
| +2.5 Volts monitor | 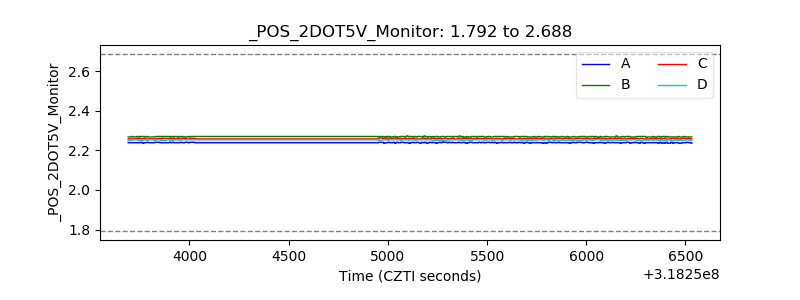 |
| +5 Volts monitor |  |
| _ROLL_ROT | 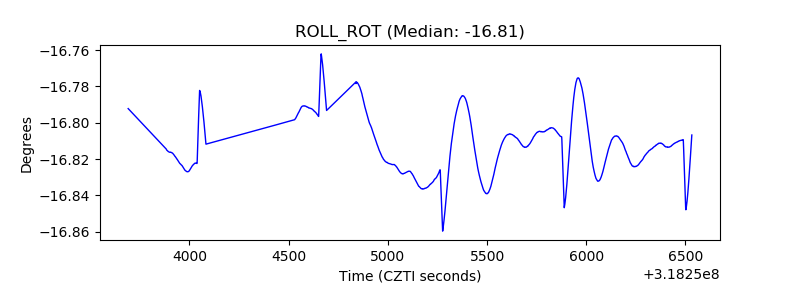 |
| _Roll_DEC | 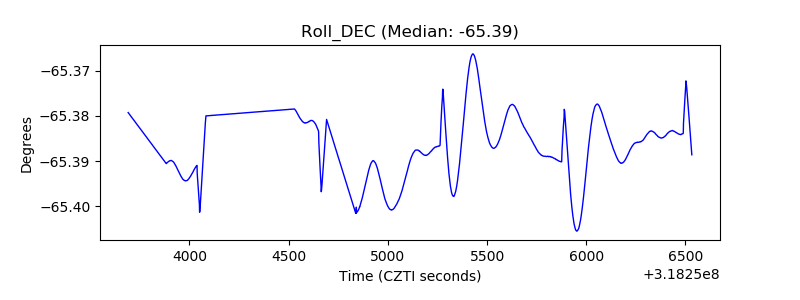 |
| _Roll_RA | 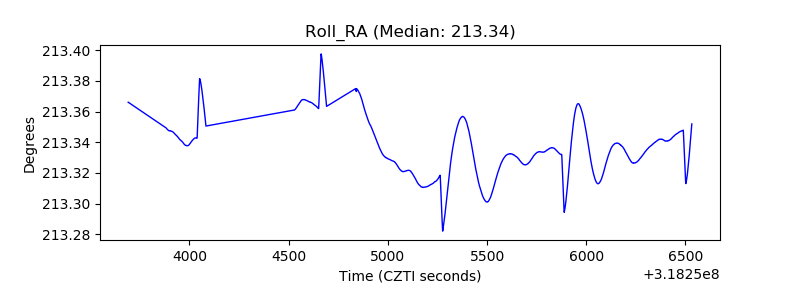 |
| Veto Counter | 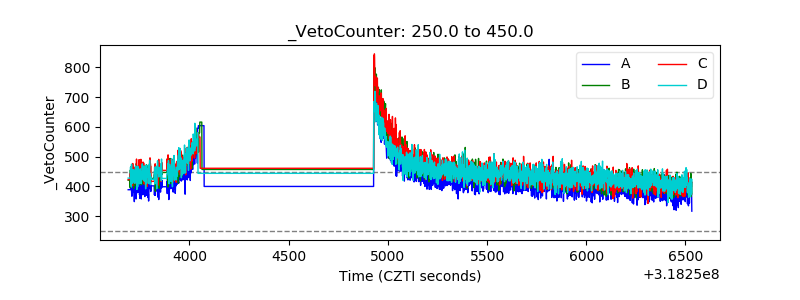 |