| Param | Original file | Final file |
|---|---|---|
| Filename | modeM0/AS1A07_100T02_9000003476_23496cztM0_level2.evt | modeM0/AS1A07_100T02_9000003476_23496cztM0_level2_quad_clean.evt |
| Size (bytes) | 855,887,040 | 160,562,880 |
| Size | 816.2 MB | 153.1 MB |
| Events in quadrant A | 5,592,982 | 1,030,297 |
| Events in quadrant B | 6,319,018 | 1,037,559 |
| Events in quadrant C | 6,878,586 | 992,956 |
| Events in quadrant D | 6,330,781 | 985,408 |
| Mode SS | |||
|---|---|---|---|
| Quadrant | BADHDUFLAG | Total packets | Discarded packets |
| A | 0 | 240 | 0 |
| B | 0 | 240 | 0 |
| C | 0 | 240 | 0 |
| D | 0 | 240 | 0 |
| Mode M9 | |||
|---|---|---|---|
| Quadrant | BADHDUFLAG | Total packets | Discarded packets |
| A | 0 | 12 | 0 |
| B | 0 | 12 | 0 |
| C | 0 | 12 | 0 |
| D | 0 | 12 | 0 |
| Mode M0 | |||
|---|---|---|---|
| Quadrant | BADHDUFLAG | Total packets | Discarded packets |
| A | 0 | 24260 | 2 |
| B | 0 | 26127 | 2 |
| C | 0 | 27875 | 2 |
| D | 0 | 26510 | 2 |
| Quadrant | Total seconds | Saturated seconds | Saturation percentage |
|---|---|---|---|
| A | 11803 | 246 | 2.084216% |
| B | 11804 | 299 | 2.533040% |
| C | 11804 | 406 | 3.439512% |
| D | 11804 | 277 | 2.346662% |
Noise dominated data is calculated using 1-second bins in cleaned event files. If a bin has >2000 counts, and if more than 50% of those come from <1% of pixels, then it is considered to be noise-dominated and hence unusable.
| Quadrant | # 1 sec bins | Bins with >0 counts | Bins with >2000 counts | High rate bins dominated by noise | Noise dominated (total time) | Noise dominated (detector-on time) | Marked lightcurve |
|---|---|---|---|---|---|---|---|
| A | 13008 | 11803 | 0 | 0 | 0.00% | 0.00% | 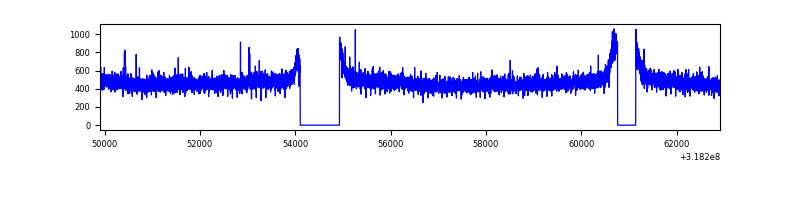 |
| B | 13009 | 11804 | 15 | 15 | 0.12% | 0.13% | 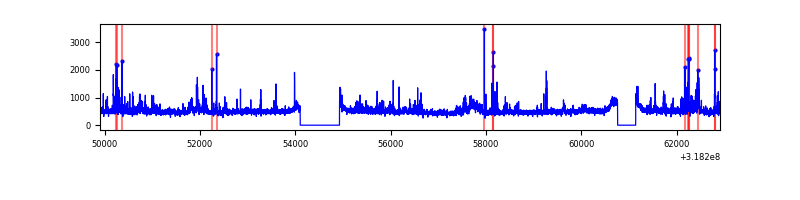 |
| C | 13009 | 11804 | 39 | 39 | 0.30% | 0.33% | 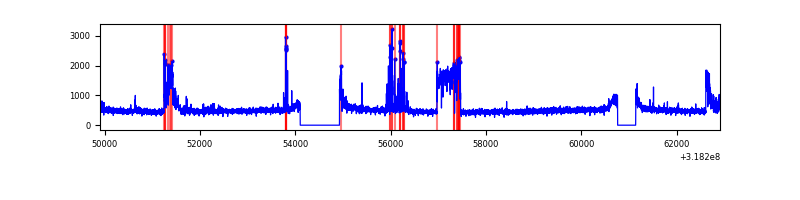 |
| D | 13009 | 11804 | 90 | 90 | 0.69% | 0.76% | 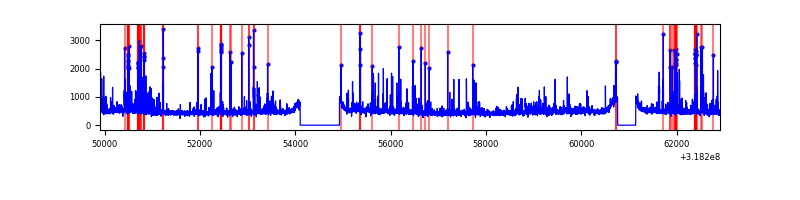 |
Top three noisy pixels from each quadrant. If the there are fewer than three noisy pixels in the level2.evt file, extra rows are filled as -1
| Pixel properties | Quadrant properties | ||||||
|---|---|---|---|---|---|---|---|
| Quadrant | DetID | PixID | Counts | Sigma | Mean | Median | Sigma |
| A | 13 | 254 | 20856 | 67.17 | 1443 | 1413 | 289.4 |
| A | 0 | 226 | 12573 | 38.56 | 1443 | 1413 | 289.4 |
| A | 3 | 137 | 12033 | 36.69 | 1443 | 1413 | 289.4 |
| B | 0 | 189 | 420902 | 1570.15 | 1432 | 1398 | 267.2 |
| B | 0 | 229 | 71256 | 261.47 | 1432 | 1398 | 267.2 |
| B | 0 | 228 | 50385 | 183.35 | 1432 | 1398 | 267.2 |
| C | 8 | 208 | 937854 | 2930.17 | 1384 | 1392 | 319.6 |
| C | 14 | 238 | 217049 | 674.79 | 1384 | 1392 | 319.6 |
| C | 0 | 207 | 135162 | 418.56 | 1384 | 1392 | 319.6 |
| D | 1 | 52 | 516619 | 1523.6 | 1411 | 1374 | 338.2 |
| D | 13 | 174 | 198156 | 581.89 | 1411 | 1374 | 338.2 |
| D | 12 | 233 | 163496 | 479.4 | 1411 | 1374 | 338.2 |
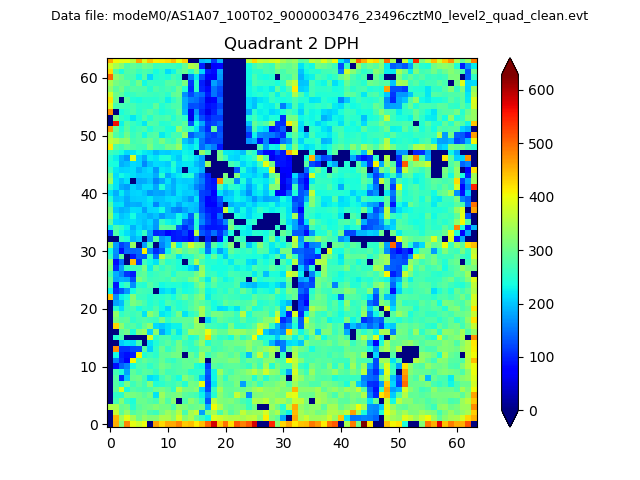
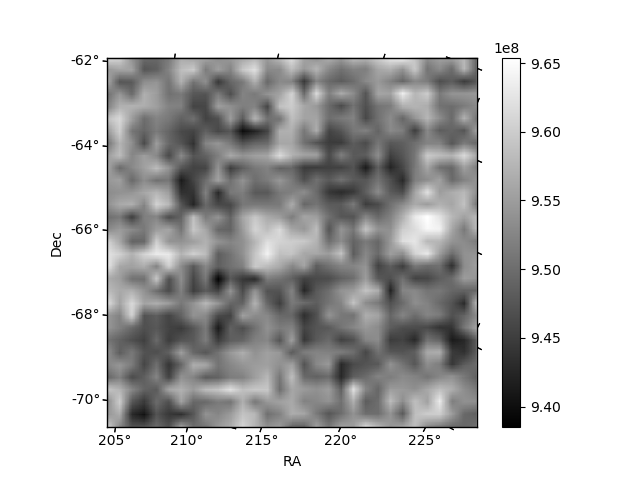
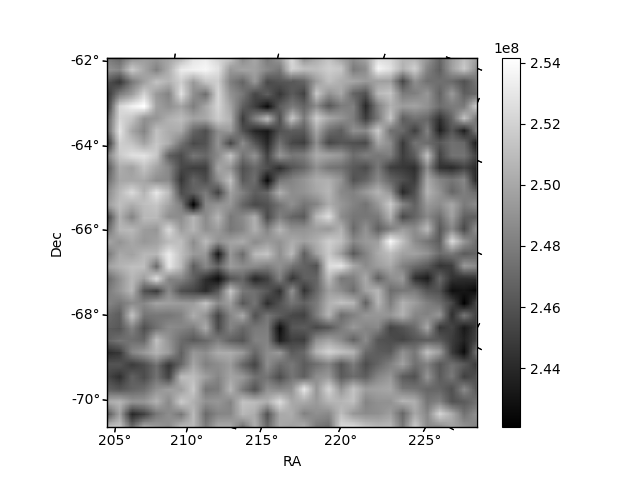
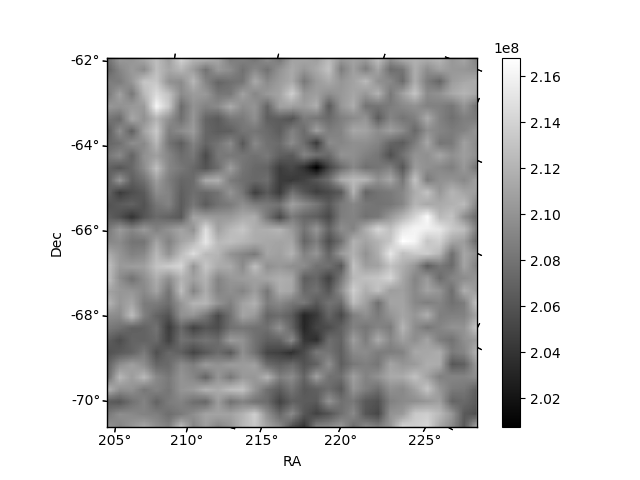
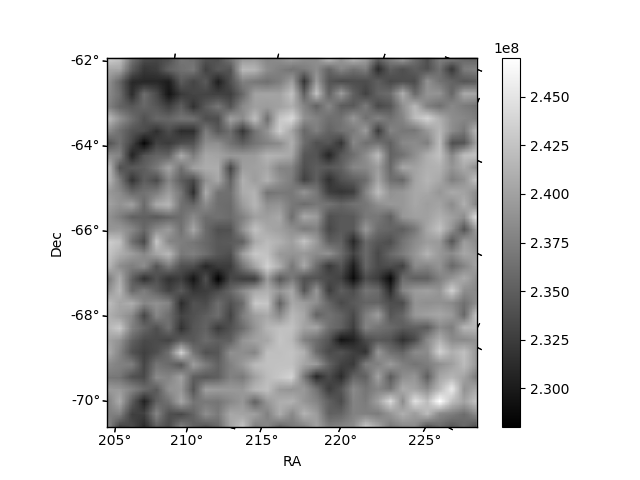
Histogram calculated using DETX and DETY for each event in the final _common_clean file
| Quadrant A | 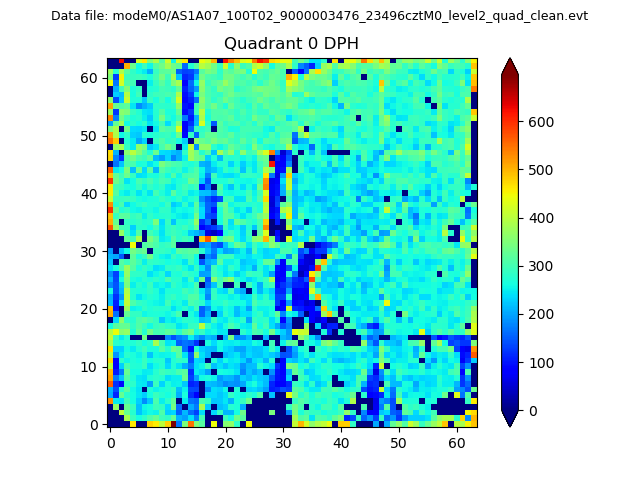 |
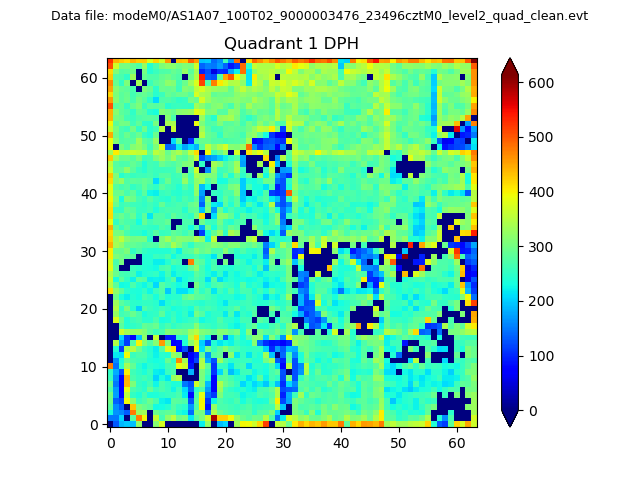 |
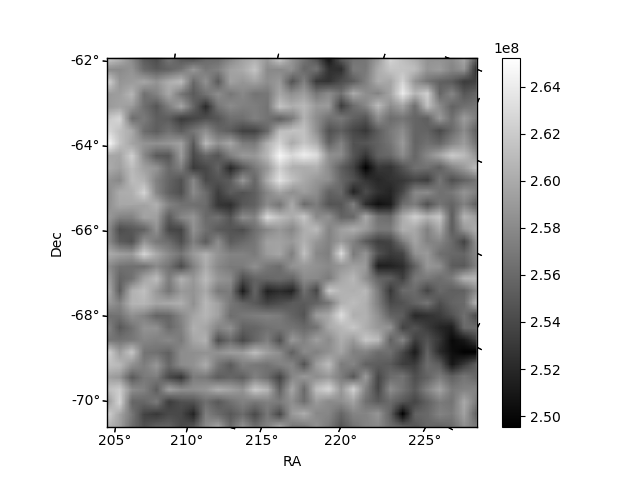
Quadrant B |
|---|---|---|---|
| Quadrant D | 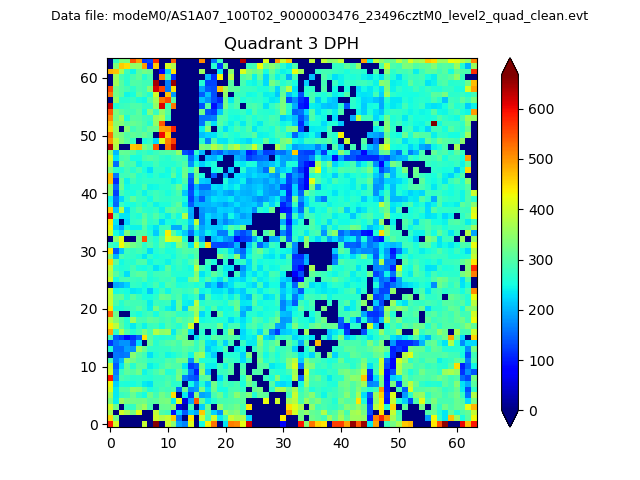 |
 |
Quadrant C |
| Plot type | Count rate plots | Images |
|---|---|---|
| Comparison with Poisson distribution Blue bars denote a histogram of data divided into 1 sec bins. Red curve is a Poisson curve with rate = median count rate of data. |
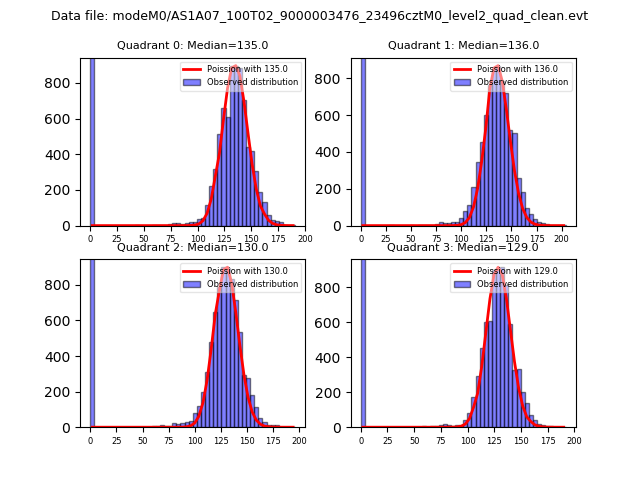 |
 |
| Quadrant-wise count rates Data is divided into 100 sec bins |
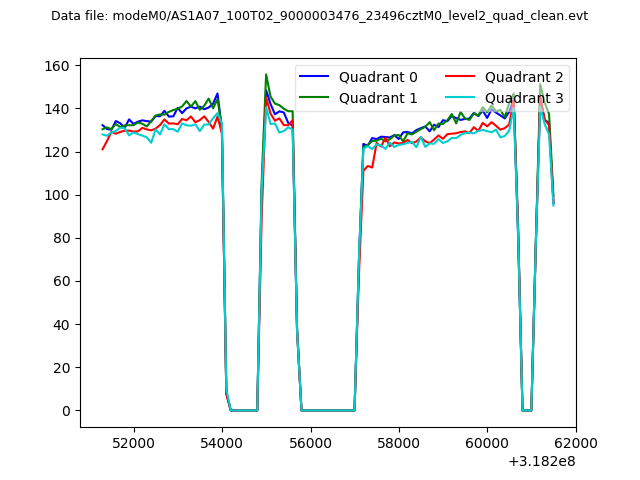 |
|
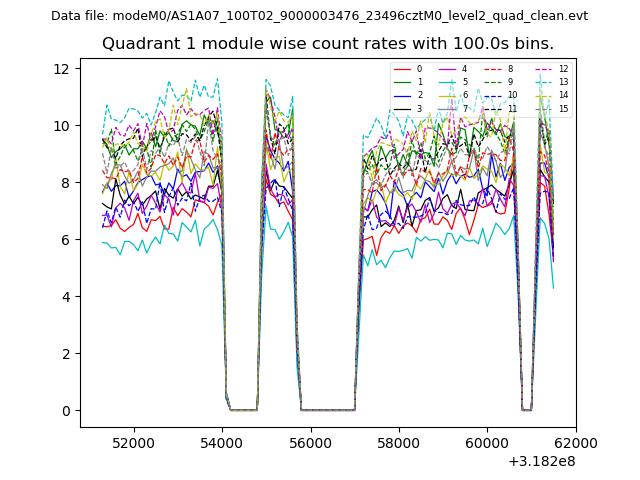
| Module-wise count rates for Quadrant A Data is divided into 100 sec bins |
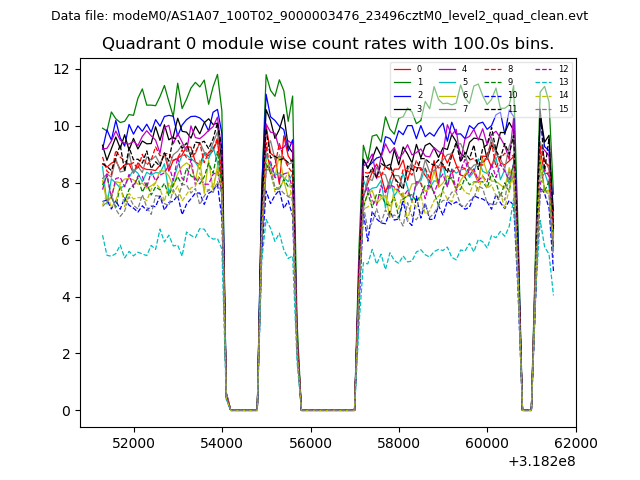 |
 |
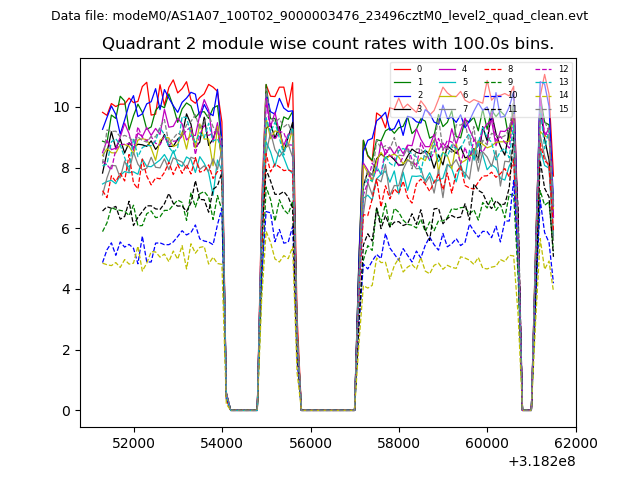
| Module-wise count rates for Quadrant B Data is divided into 100 sec bins |
 |
 |
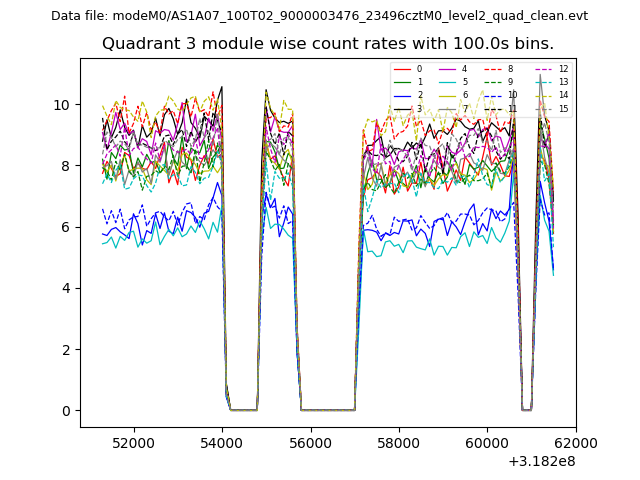
| Module-wise count rates for Quadrant C Data is divided into 100 sec bins |
 |
 |
| Module-wise count rates for Quadrant D Data is divided into 100 sec bins |
 |
 |
| Parameter | Plot |
|---|---|
| CZT HV Monitor | 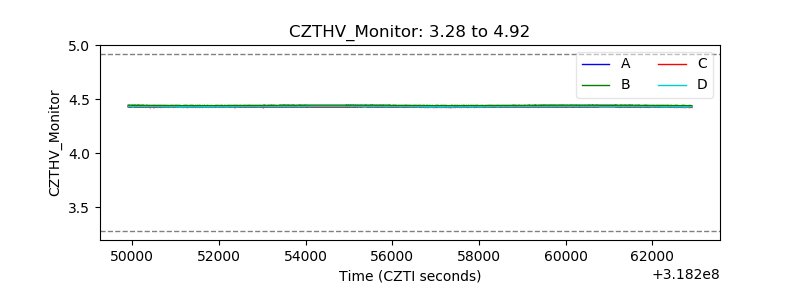 |
| D_VDD | 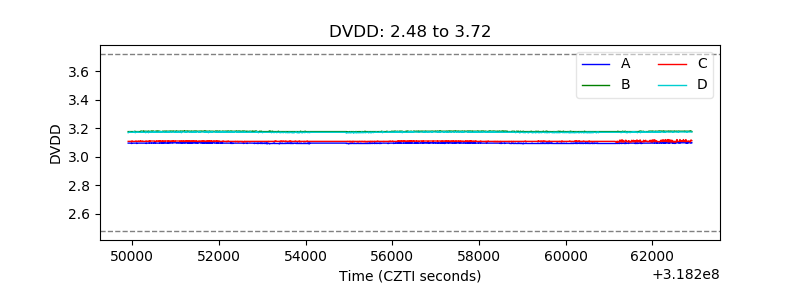 |
| Temperature 1 | 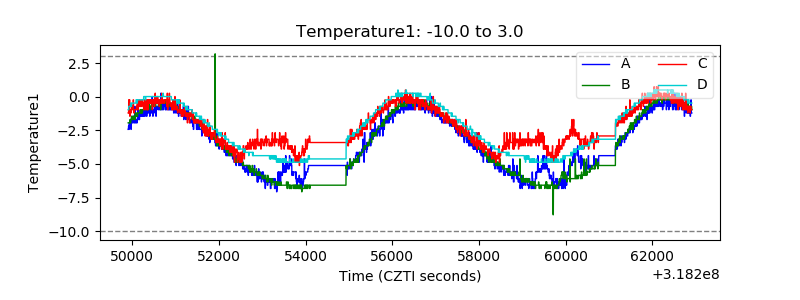 |
| Veto HV Monitor | 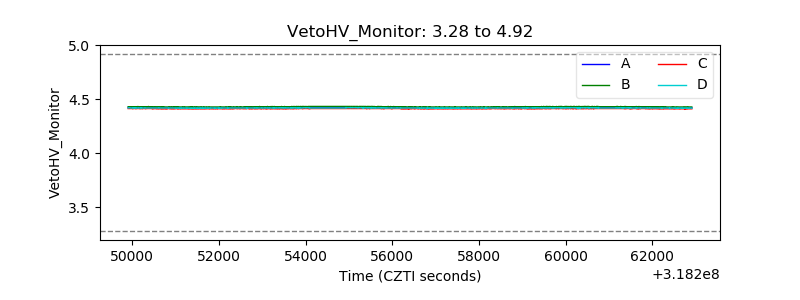 |
| Veto LLD | 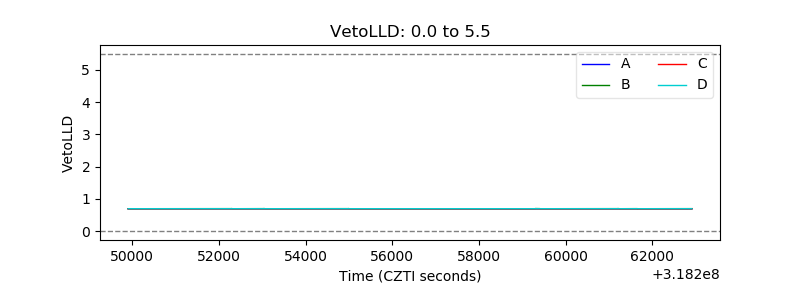 |
| Alpha Counter | 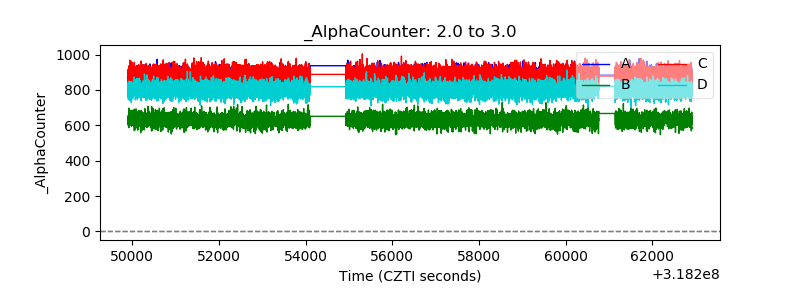 |
| _CPM_Rate | 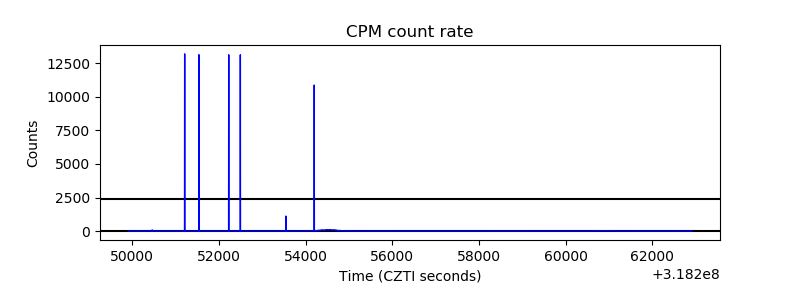 |
| CZT Counter |  |
| +2.5 Volts monitor |  |
| +5 Volts monitor | 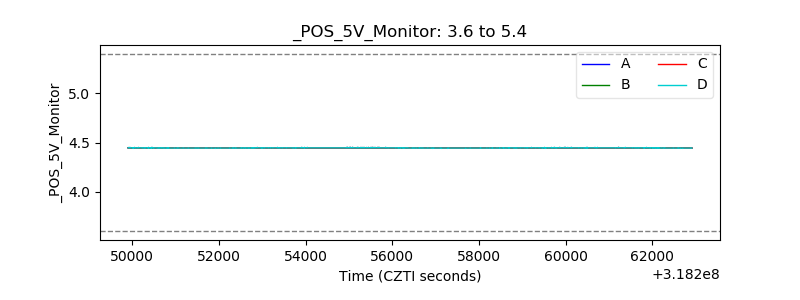 |
| _ROLL_ROT | 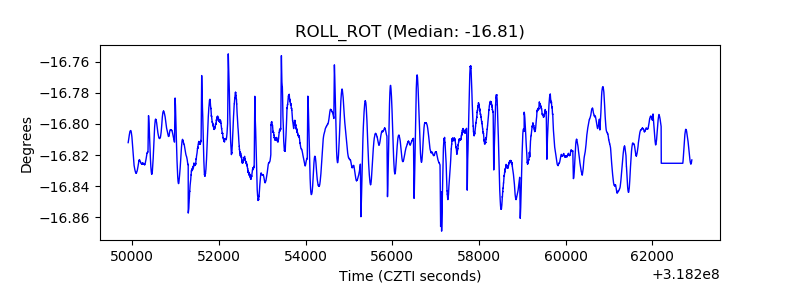 |
| _Roll_DEC | 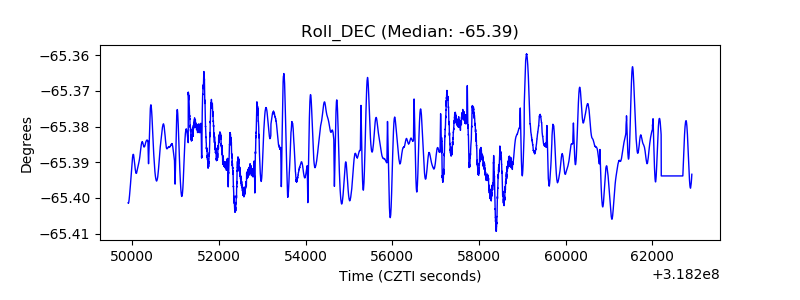 |
| _Roll_RA | 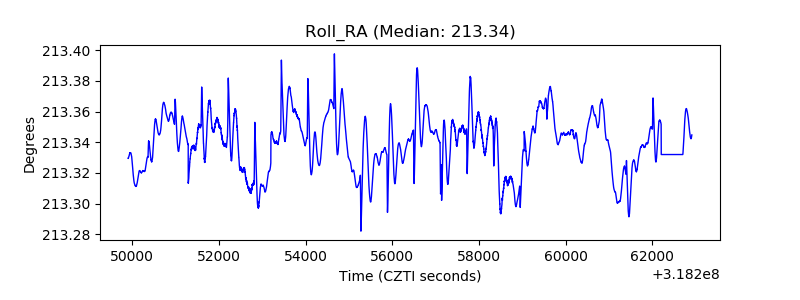 |
| Veto Counter | 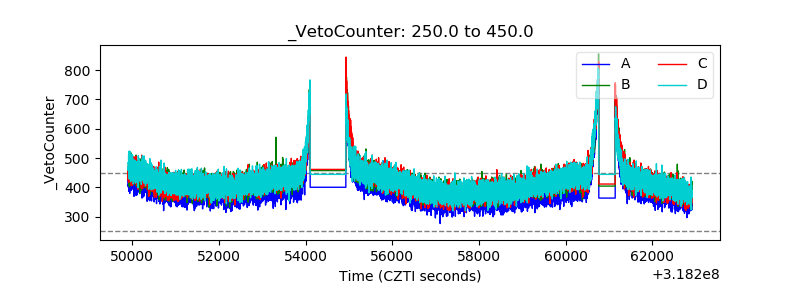 |