| Param | Original file | Final file |
|---|---|---|
| Filename | modeM0/AS1A07_100T02_9000003476_23498cztM0_level2.evt | modeM0/AS1A07_100T02_9000003476_23498cztM0_level2_quad_clean.evt |
| Size (bytes) | 791,398,080 | 120,191,040 |
| Size | 754.7 MB | 114.6 MB |
| Events in quadrant A | 4,530,931 | 766,117 |
| Events in quadrant B | 5,406,403 | 766,633 |
| Events in quadrant C | 5,955,583 | 735,758 |
| Events in quadrant D | 7,416,937 | 697,418 |
| Mode SS | |||
|---|---|---|---|
| Quadrant | BADHDUFLAG | Total packets | Discarded packets |
| A | 0 | 222 | 22 |
| B | 0 | 221 | 21 |
| C | 0 | 221 | 21 |
| D | 0 | 222 | 22 |
| Mode M9 | |||
|---|---|---|---|
| Quadrant | BADHDUFLAG | Total packets | Discarded packets |
| A | 0 | 8 | 1 |
| B | 0 | 7 | 0 |
| C | 0 | 7 | 0 |
| D | 0 | 9 | 2 |
| Mode M0 | |||
|---|---|---|---|
| Quadrant | BADHDUFLAG | Total packets | Discarded packets |
| A | 0 | 22203 | 2178 |
| B | 0 | 24561 | 2284 |
| C | 0 | 26599 | 2481 |
| D | 0 | 31929 | 3258 |
| Quadrant | Total seconds | Saturated seconds | Saturation percentage |
|---|---|---|---|
| A | 9726 | 129 | 1.326342% |
| B | 9711 | 241 | 2.481722% |
| C | 9705 | 362 | 3.730036% |
| D | 9682 | 1014 | 10.473043% |
Noise dominated data is calculated using 1-second bins in cleaned event files. If a bin has >2000 counts, and if more than 50% of those come from <1% of pixels, then it is considered to be noise-dominated and hence unusable.
| Quadrant | # 1 sec bins | Bins with >0 counts | Bins with >2000 counts | High rate bins dominated by noise | Noise dominated (total time) | Noise dominated (detector-on time) | Marked lightcurve |
|---|---|---|---|---|---|---|---|
| A | 18458 | 9860 | 0 | 0 | 0.00% | 0.00% | 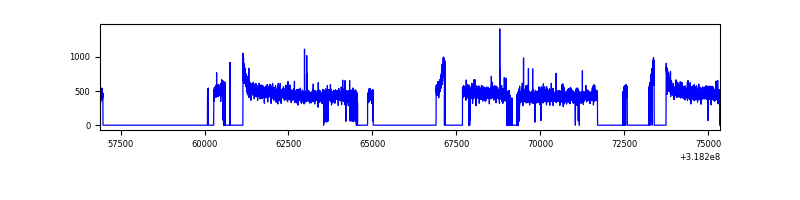 |
| B | 18460 | 9842 | 29 | 29 | 0.16% | 0.29% | 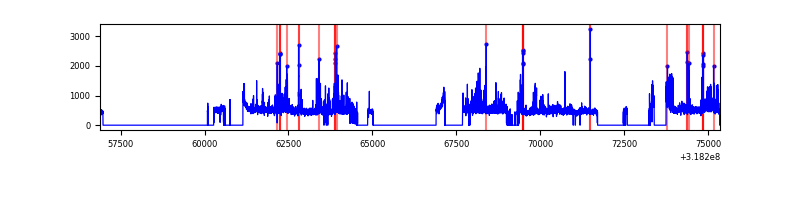 |
| C | 18455 | 9867 | 166 | 166 | 0.90% | 1.68% | 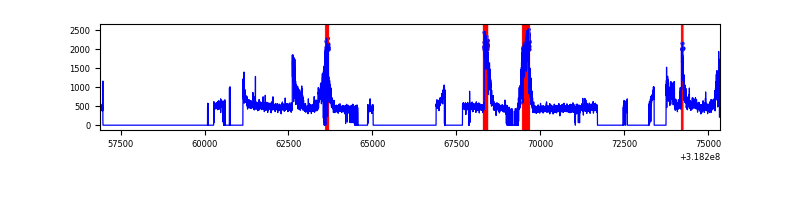 |
| D | 18455 | 9829 | 947 | 947 | 5.13% | 9.63% | 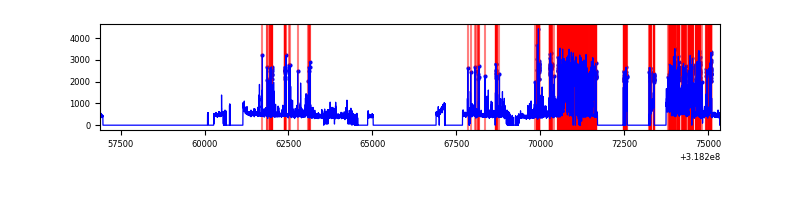 |
Top three noisy pixels from each quadrant. If the there are fewer than three noisy pixels in the level2.evt file, extra rows are filled as -1
| Pixel properties | Quadrant properties | ||||||
|---|---|---|---|---|---|---|---|
| Quadrant | DetID | PixID | Counts | Sigma | Mean | Median | Sigma |
| A | 13 | 254 | 18046 | 71.48 | 1167 | 1141 | 236.5 |
| A | 2 | 79 | 11817 | 45.14 | 1167 | 1141 | 236.5 |
| A | 3 | 1 | 10487 | 39.52 | 1167 | 1141 | 236.5 |
| B | 0 | 189 | 423959 | 1952.82 | 1151 | 1122 | 216.5 |
| B | 0 | 230 | 145919 | 668.73 | 1151 | 1122 | 216.5 |
| B | 15 | 32 | 91021 | 415.19 | 1151 | 1122 | 216.5 |
| C | 8 | 208 | 1287090 | 5020.61 | 1103 | 1109 | 256.1 |
| C | 14 | 238 | 171735 | 666.14 | 1103 | 1109 | 256.1 |
| C | 10 | 9 | 91393 | 352.48 | 1103 | 1109 | 256.1 |
| D | 1 | 52 | 2504200 | 9464.74 | 1089 | 1059 | 264.5 |
| D | 12 | 233 | 221532 | 833.64 | 1089 | 1059 | 264.5 |
| D | 15 | 0 | 216901 | 816.13 | 1089 | 1059 | 264.5 |
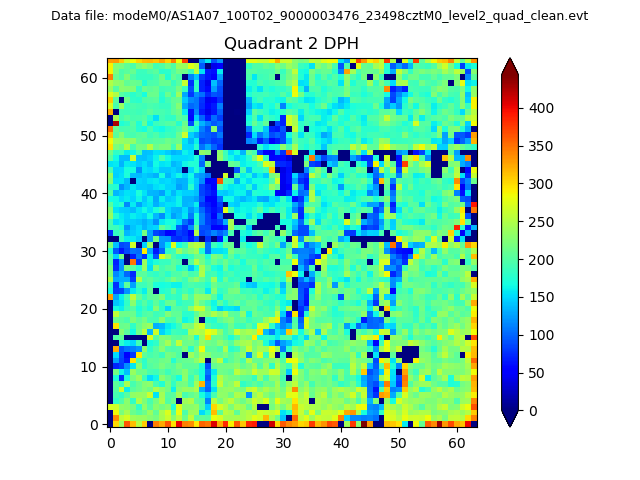
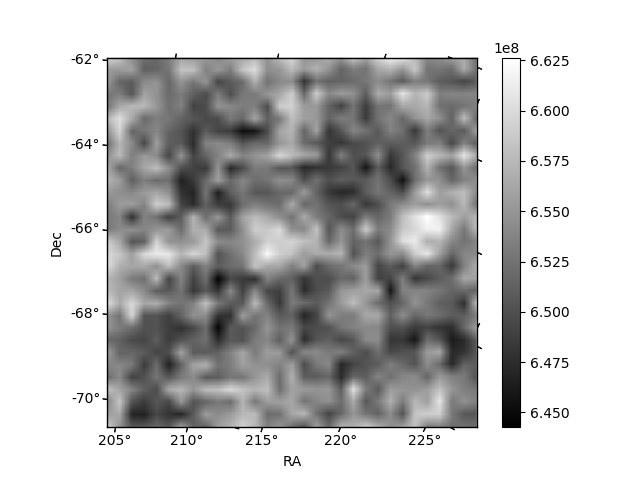
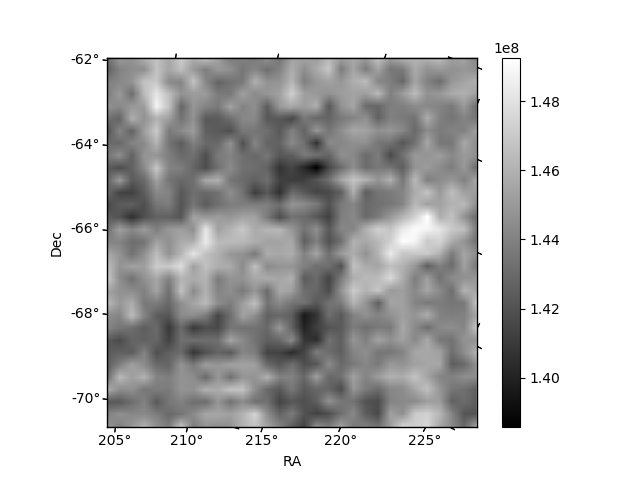
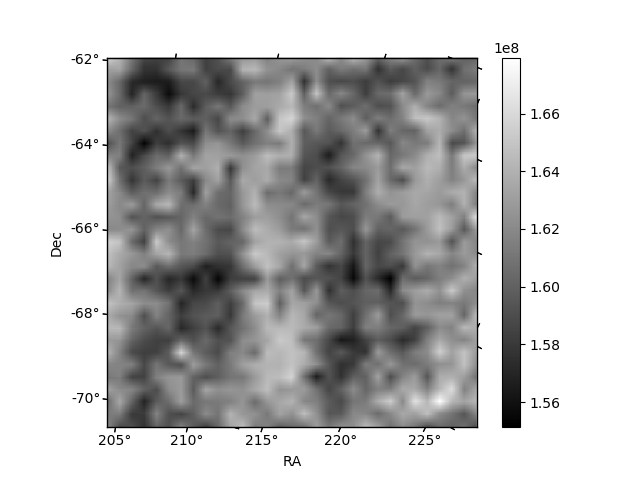
Histogram calculated using DETX and DETY for each event in the final _common_clean file
| Quadrant A | 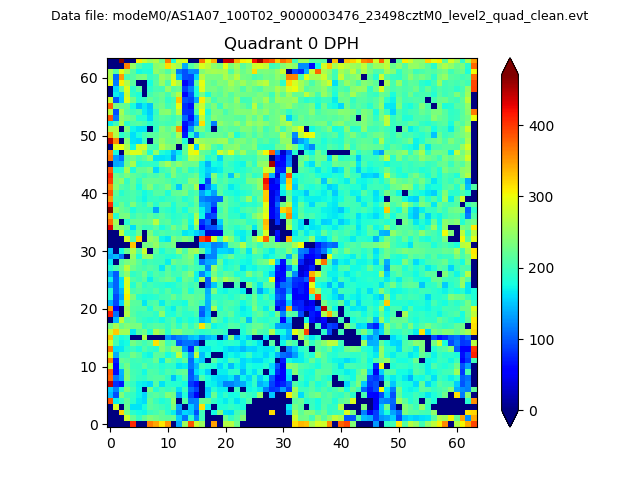 |
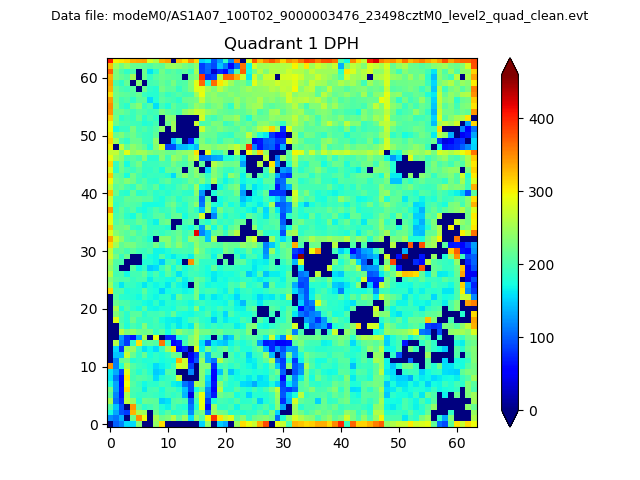 |
Quadrant B |
|---|---|---|---|
| Quadrant D | 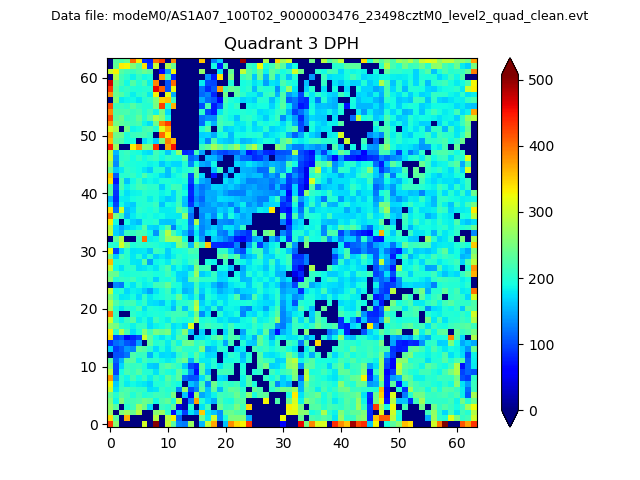 |
 |
Quadrant C |
| Plot type | Count rate plots | Images |
|---|---|---|
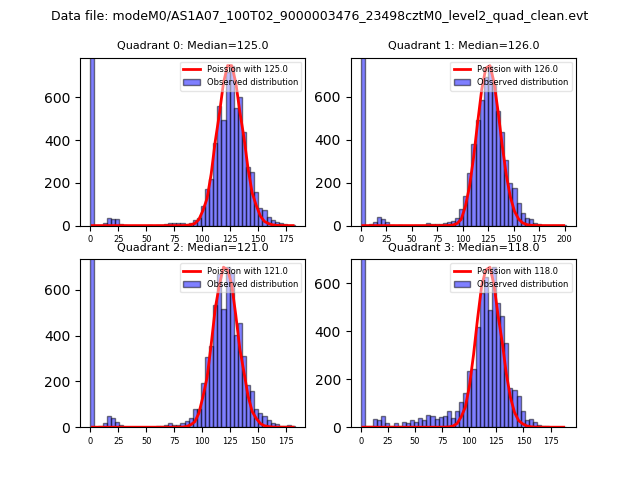
| Comparison with Poisson distribution Blue bars denote a histogram of data divided into 1 sec bins. Red curve is a Poisson curve with rate = median count rate of data. |
 |
 |
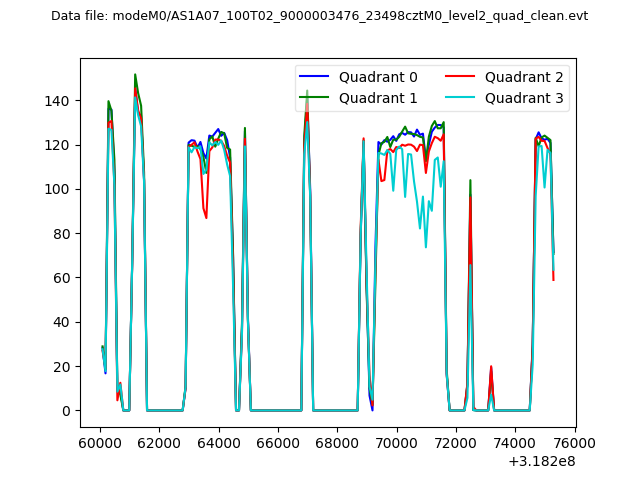
| Quadrant-wise count rates Data is divided into 100 sec bins |
 |
|
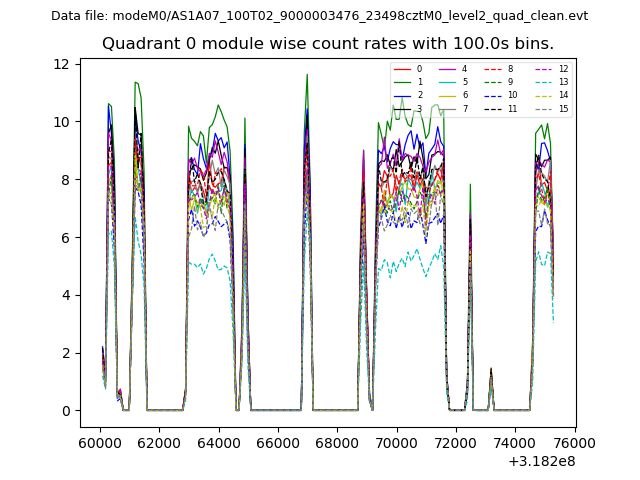
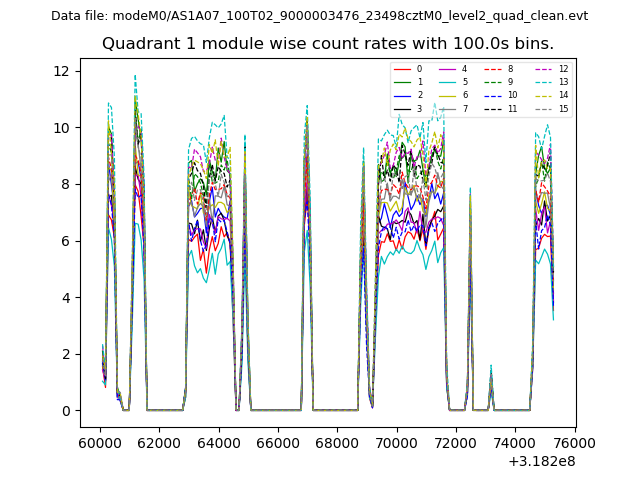
| Module-wise count rates for Quadrant A Data is divided into 100 sec bins |
 |
 |
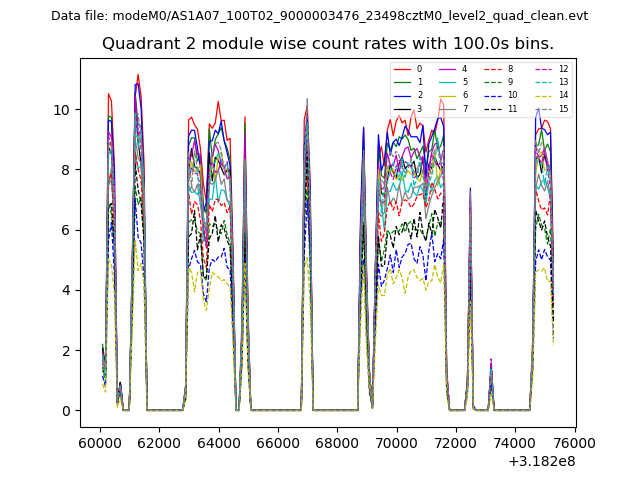
| Module-wise count rates for Quadrant B Data is divided into 100 sec bins |
 |
 |
| Module-wise count rates for Quadrant C Data is divided into 100 sec bins |
 |
 |
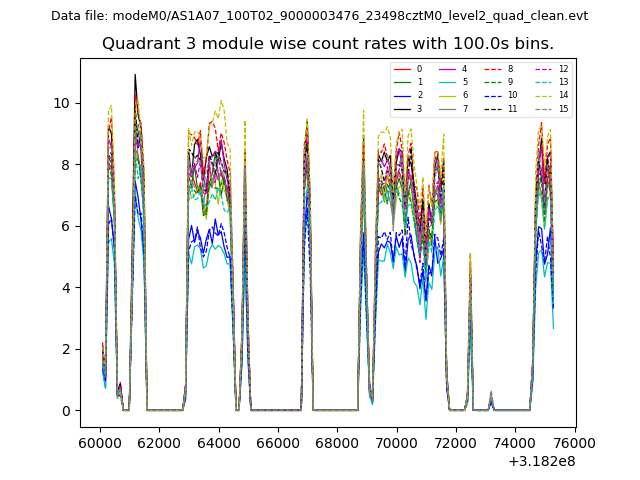
| Module-wise count rates for Quadrant D Data is divided into 100 sec bins |
 |
 |
| Parameter | Plot |
|---|---|
| CZT HV Monitor | 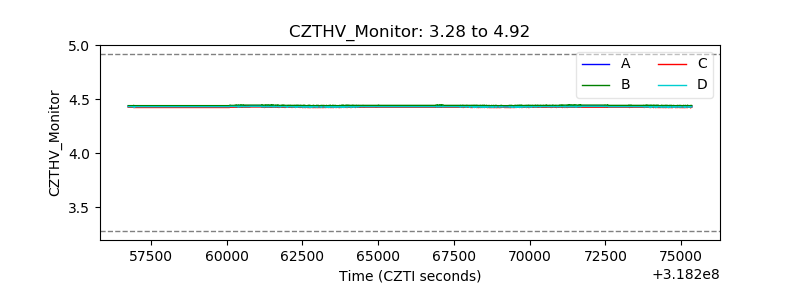 |
| D_VDD | 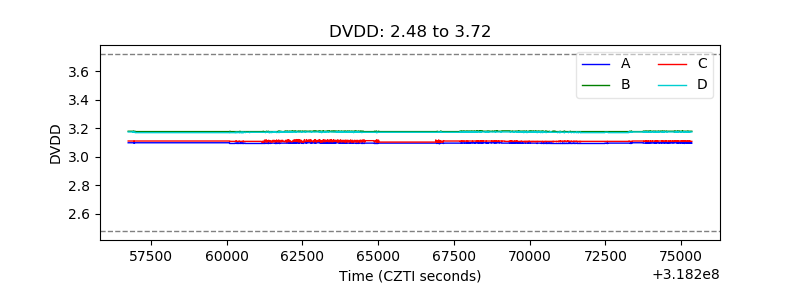 |
| Temperature 1 | 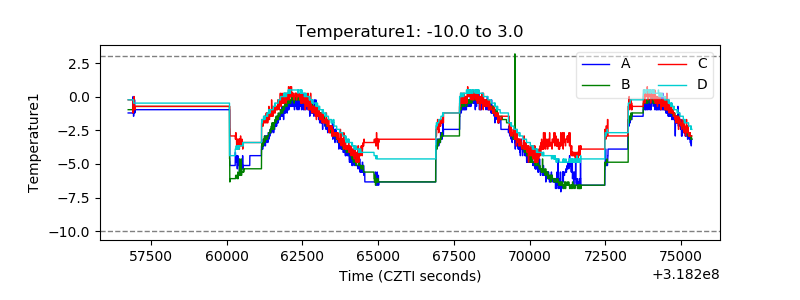 |
| Veto HV Monitor | 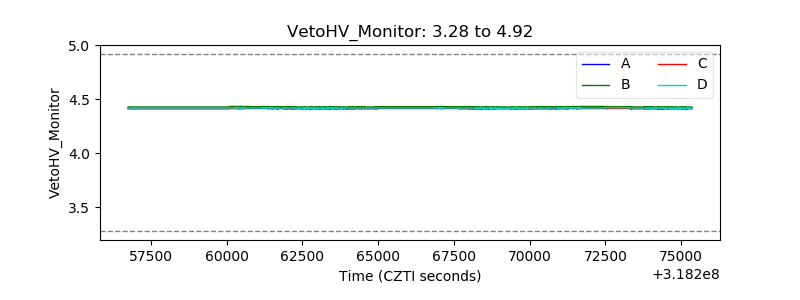 |
| Veto LLD | 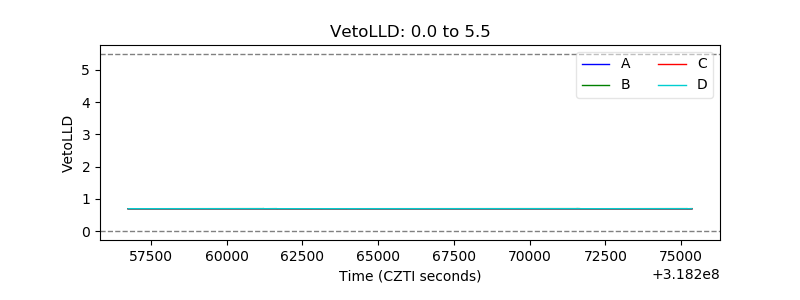 |
| Alpha Counter | 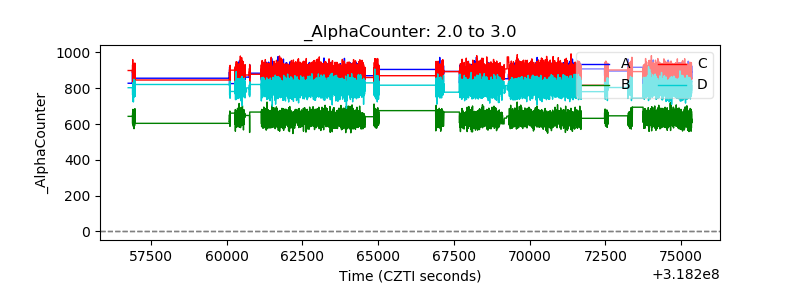 |
| _CPM_Rate | 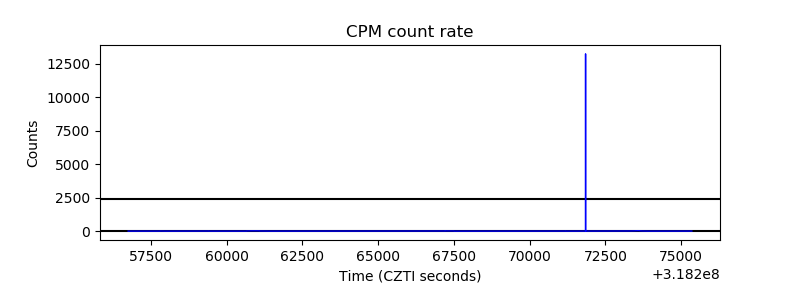 |
| CZT Counter | 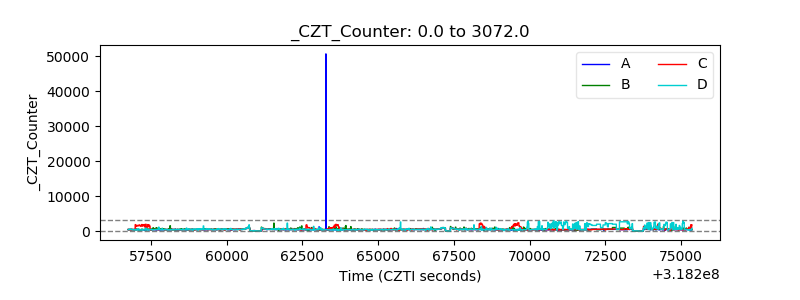 |
| +2.5 Volts monitor |  |
| +5 Volts monitor |  |
| _ROLL_ROT | 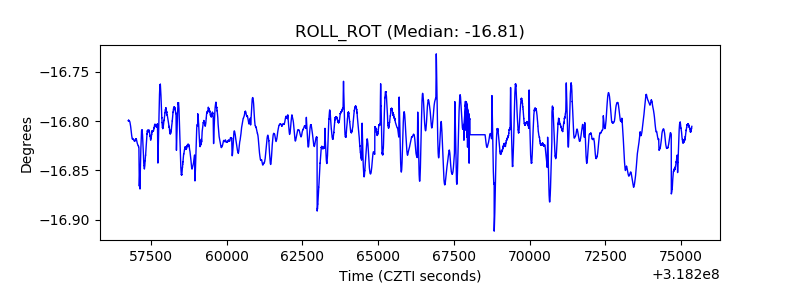 |
| _Roll_DEC | 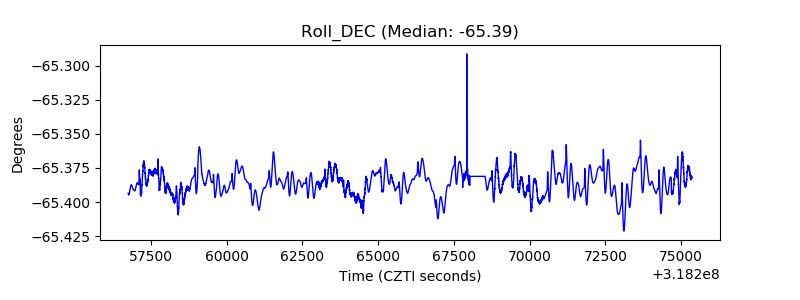 |
| _Roll_RA | 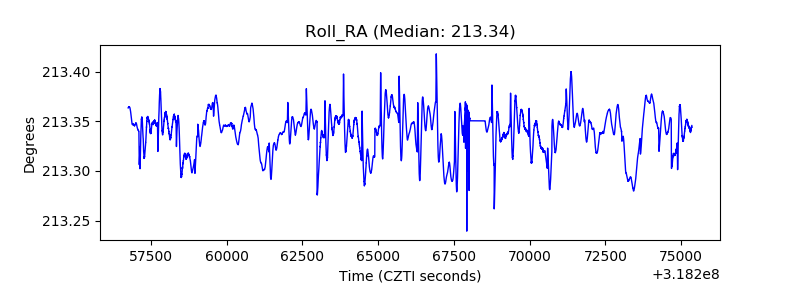 |
| Veto Counter | 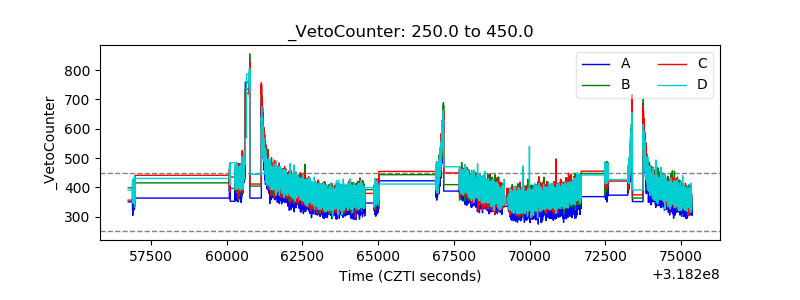 |