| Param | Original file | Final file |
|---|---|---|
| Filename | modeM0/AS1A07_100T02_9000003476_23500cztM0_level2.evt | modeM0/AS1A07_100T02_9000003476_23500cztM0_level2_quad_clean.evt |
| Size (bytes) | 864,587,520 | 149,860,800 |
| Size | 824.5 MB | 142.9 MB |
| Events in quadrant A | 4,615,691 | 1,010,888 |
| Events in quadrant B | 5,210,812 | 1,020,437 |
| Events in quadrant C | 5,714,613 | 971,174 |
| Events in quadrant D | 9,960,635 | 837,206 |
| Mode SS | |||
|---|---|---|---|
| Quadrant | BADHDUFLAG | Total packets | Discarded packets |
| A | 0 | 208 | 0 |
| B | 0 | 208 | 0 |
| C | 0 | 208 | 0 |
| D | 0 | 208 | 0 |
| Mode M9 | |||
|---|---|---|---|
| Quadrant | BADHDUFLAG | Total packets | Discarded packets |
| A | 0 | 8 | 0 |
| B | 0 | 8 | 0 |
| C | 0 | 8 | 0 |
| D | 0 | 8 | 0 |
| Mode M0 | |||
|---|---|---|---|
| Quadrant | BADHDUFLAG | Total packets | Discarded packets |
| A | 0 | 20660 | 3 |
| B | 0 | 22114 | 2 |
| C | 0 | 23685 | 2 |
| D | 0 | 36361 | 2 |
| Quadrant | Total seconds | Saturated seconds | Saturation percentage |
|---|---|---|---|
| A | 10070 | 82 | 0.814300% |
| B | 10071 | 174 | 1.727733% |
| C | 10071 | 278 | 2.760401% |
| D | 10071 | 2139 | 21.239202% |
Noise dominated data is calculated using 1-second bins in cleaned event files. If a bin has >2000 counts, and if more than 50% of those come from <1% of pixels, then it is considered to be noise-dominated and hence unusable.
| Quadrant | # 1 sec bins | Bins with >0 counts | Bins with >2000 counts | High rate bins dominated by noise | Noise dominated (total time) | Noise dominated (detector-on time) | Marked lightcurve |
|---|---|---|---|---|---|---|---|
| A | 10940 | 10071 | 2 | 2 | 0.02% | 0.02% | 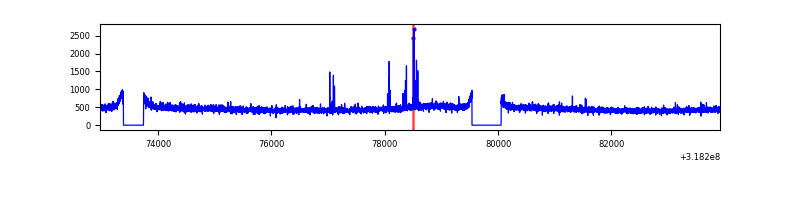 |
| B | 10941 | 10071 | 15 | 15 | 0.14% | 0.15% | 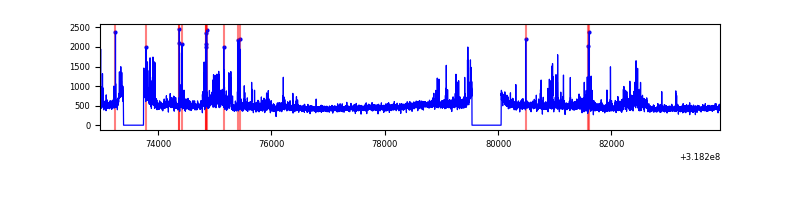 |
| C | 10941 | 10073 | 97 | 97 | 0.89% | 0.96% | 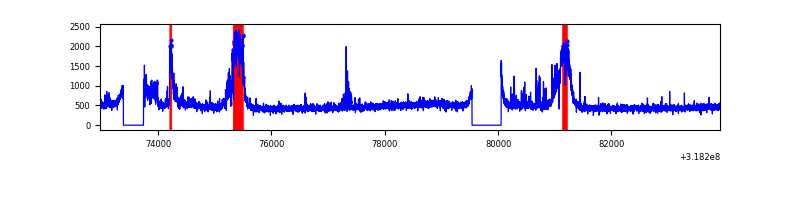 |
| D | 10941 | 10072 | 2021 | 2021 | 18.47% | 20.07% | 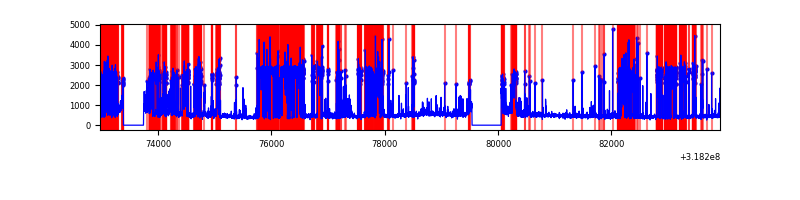 |
Top three noisy pixels from each quadrant. If the there are fewer than three noisy pixels in the level2.evt file, extra rows are filled as -1
| Pixel properties | Quadrant properties | ||||||
|---|---|---|---|---|---|---|---|
| Quadrant | DetID | PixID | Counts | Sigma | Mean | Median | Sigma |
| A | 10 | 253 | 37730 | 151.47 | 1185 | 1157 | 241.5 |
| A | 13 | 254 | 17975 | 69.65 | 1185 | 1157 | 241.5 |
| A | 0 | 226 | 10393 | 38.25 | 1185 | 1157 | 241.5 |
| B | 0 | 189 | 293390 | 1296.71 | 1181 | 1150 | 225.4 |
| B | 0 | 230 | 157448 | 693.52 | 1181 | 1150 | 225.4 |
| B | 7 | 202 | 39939 | 172.11 | 1181 | 1150 | 225.4 |
| C | 8 | 208 | 845195 | 3179.18 | 1134 | 1137 | 265.5 |
| C | 14 | 238 | 178285 | 667.24 | 1134 | 1137 | 265.5 |
| C | 2 | 16 | 101062 | 376.37 | 1134 | 1137 | 265.5 |
| D | 1 | 52 | 5568746 | 22162.63 | 1035 | 1003 | 251.2 |
| D | 7 | 38 | 177751 | 703.55 | 1035 | 1003 | 251.2 |
| D | 7 | 238 | 66758 | 261.74 | 1035 | 1003 | 251.2 |
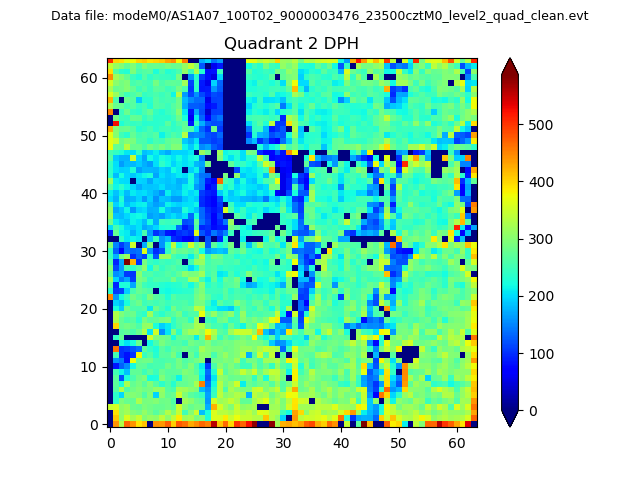
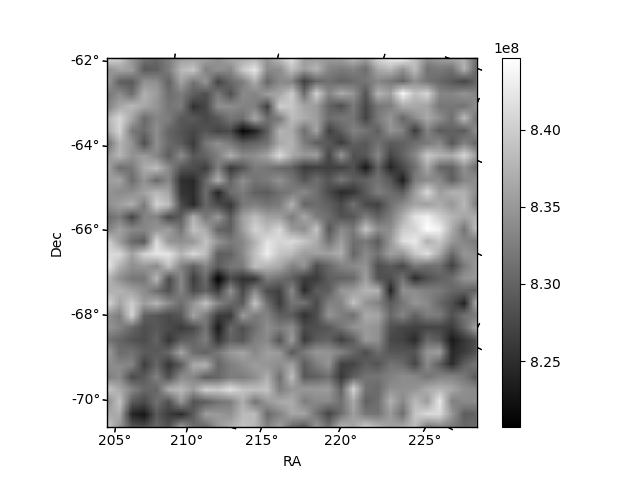
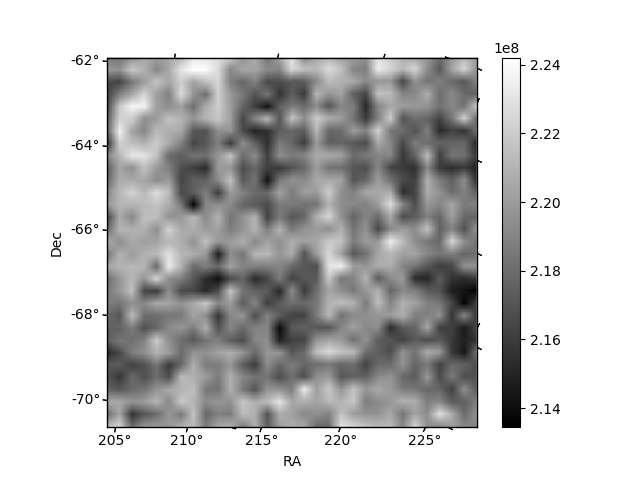
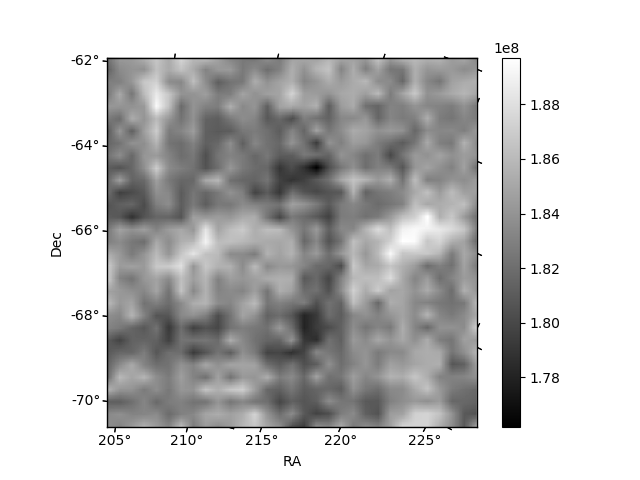
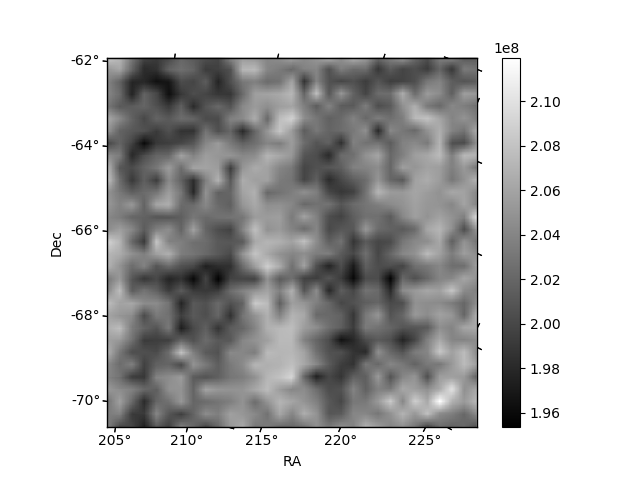
Histogram calculated using DETX and DETY for each event in the final _common_clean file
| Quadrant A | 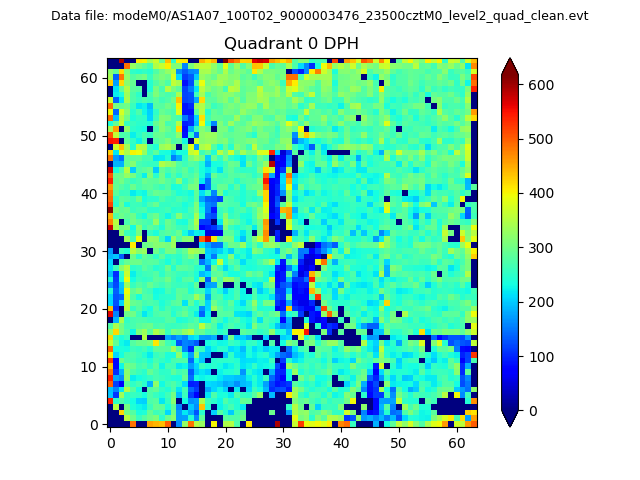 |
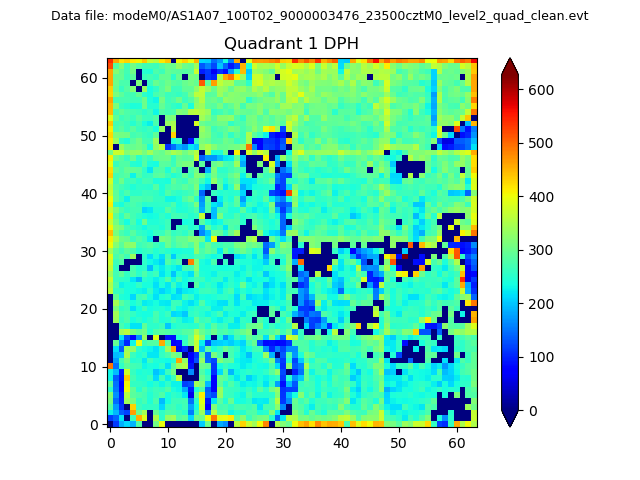 |
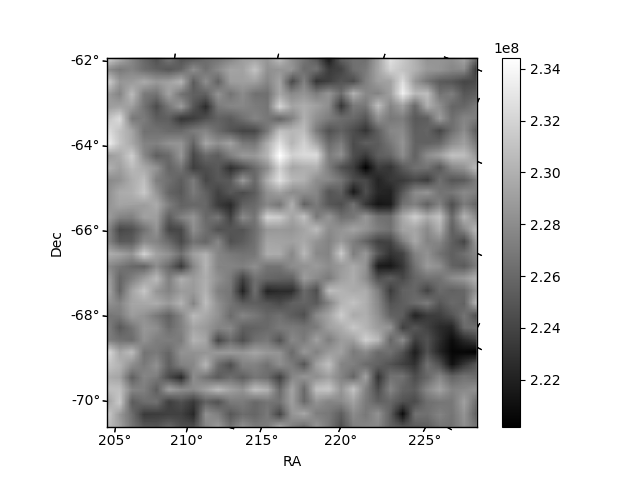
Quadrant B |
|---|---|---|---|
| Quadrant D | 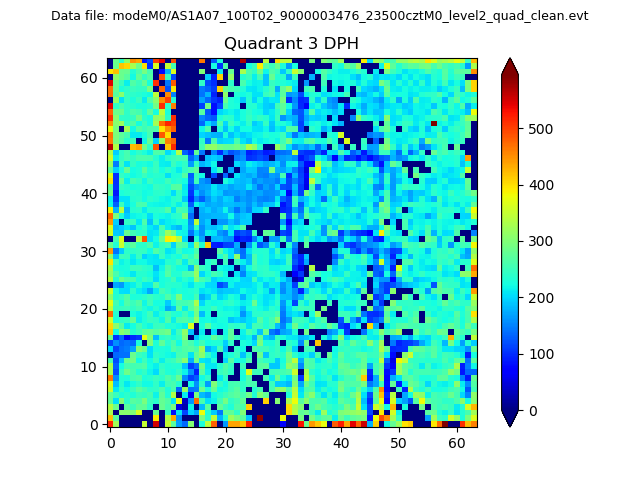 |
 |
Quadrant C |
| Plot type | Count rate plots | Images |
|---|---|---|
| Comparison with Poisson distribution Blue bars denote a histogram of data divided into 1 sec bins. Red curve is a Poisson curve with rate = median count rate of data. |
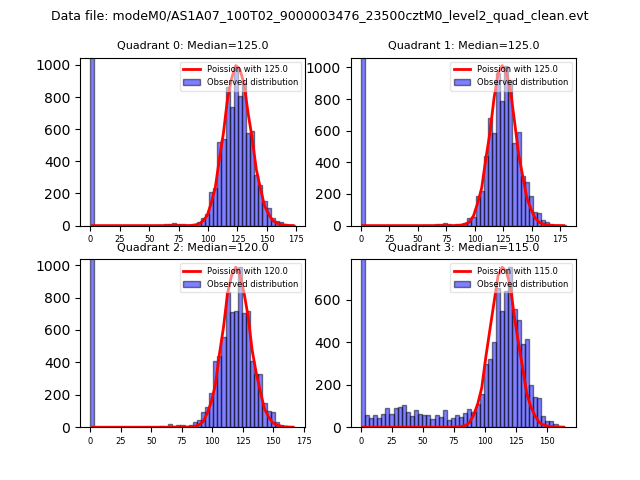 |
 |
| Quadrant-wise count rates Data is divided into 100 sec bins |
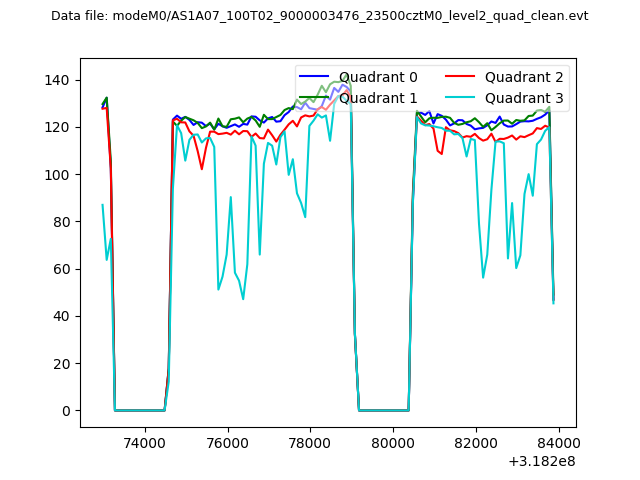 |
|
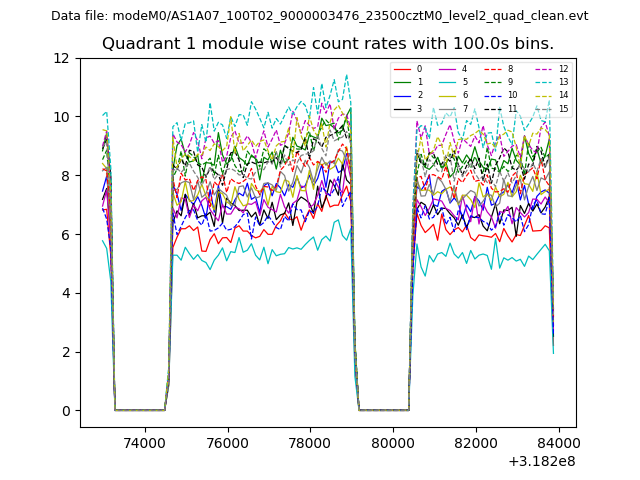
| Module-wise count rates for Quadrant A Data is divided into 100 sec bins |
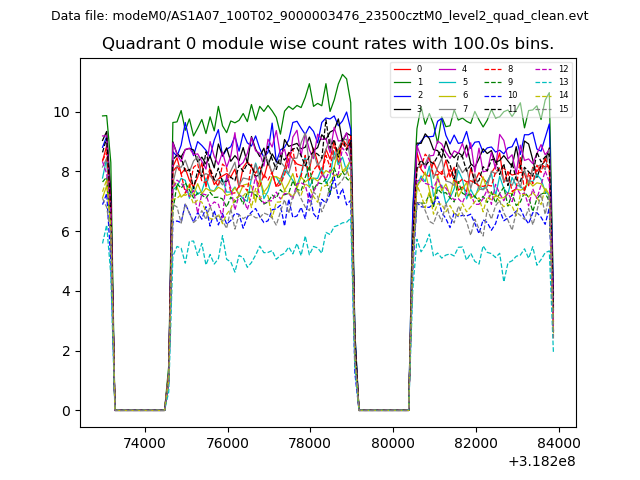 |
 |
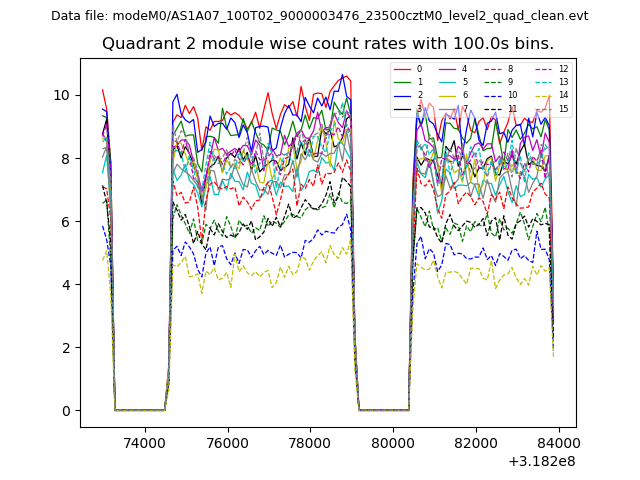
| Module-wise count rates for Quadrant B Data is divided into 100 sec bins |
 |
 |
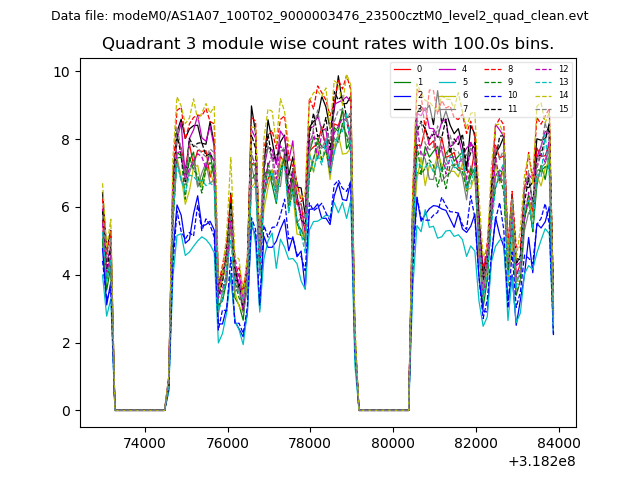
| Module-wise count rates for Quadrant C Data is divided into 100 sec bins |
 |
 |
| Module-wise count rates for Quadrant D Data is divided into 100 sec bins |
 |
 |
| Parameter | Plot |
|---|---|
| CZT HV Monitor | 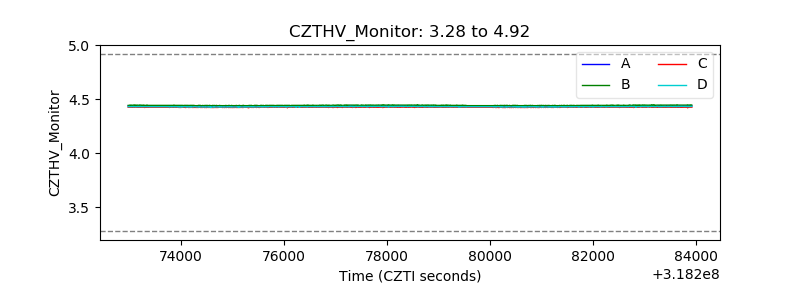 |
| D_VDD | 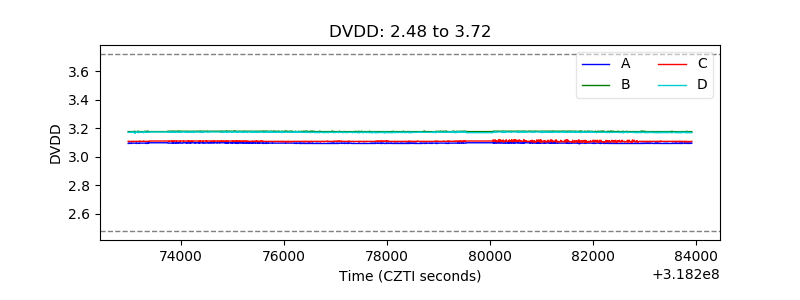 |
| Temperature 1 | 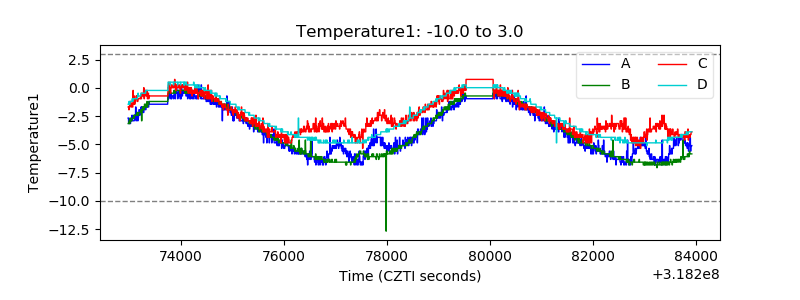 |
| Veto HV Monitor | 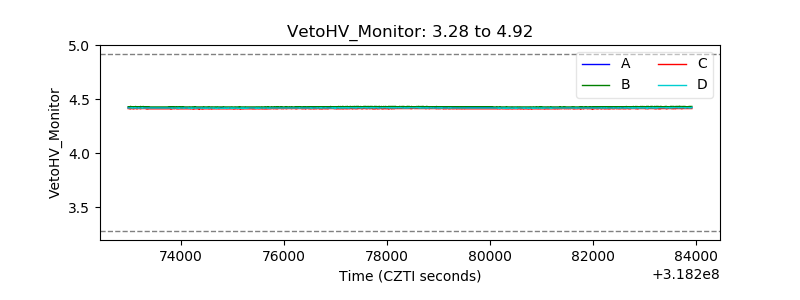 |
| Veto LLD | 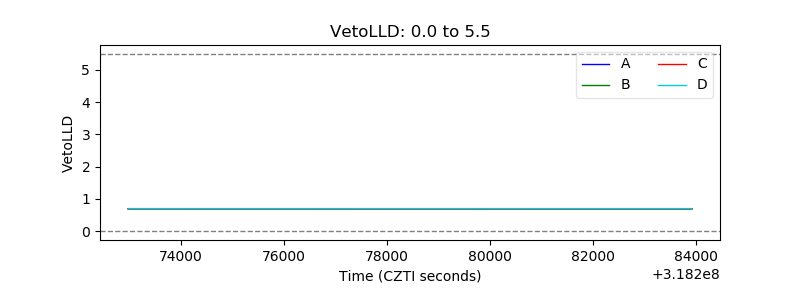 |
| Alpha Counter | 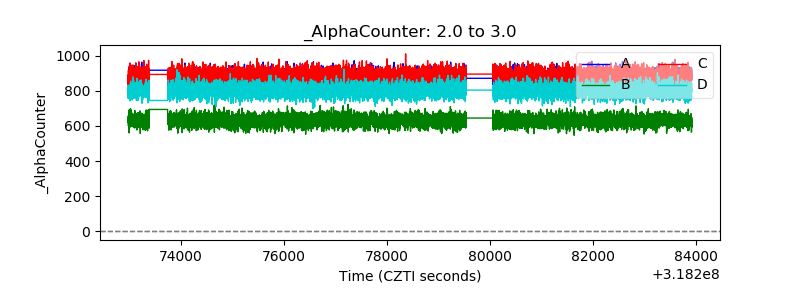 |
| _CPM_Rate | 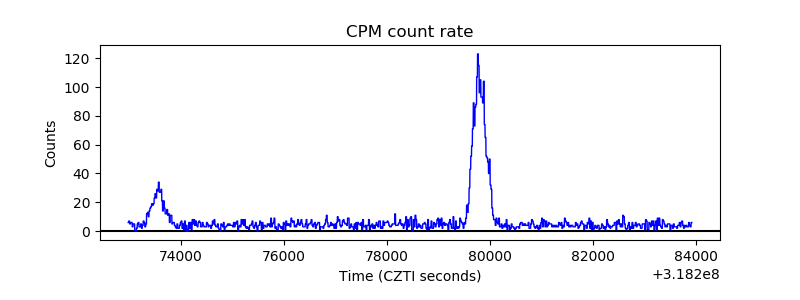 |
| CZT Counter | 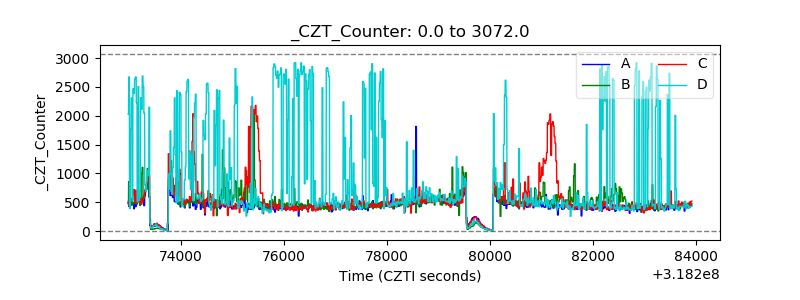 |
| +2.5 Volts monitor | 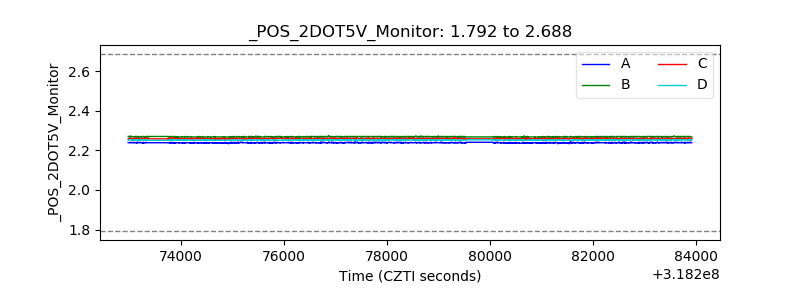 |
| +5 Volts monitor |  |
| _ROLL_ROT | 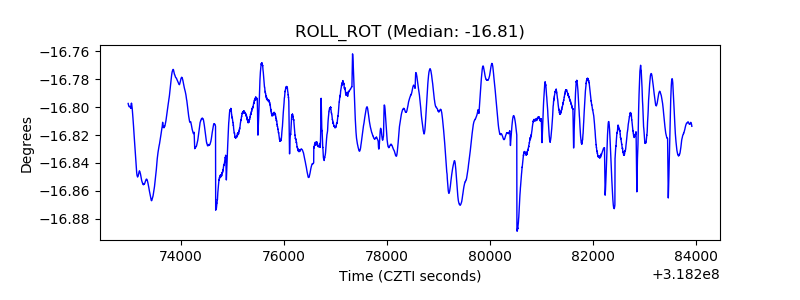 |
| _Roll_DEC | 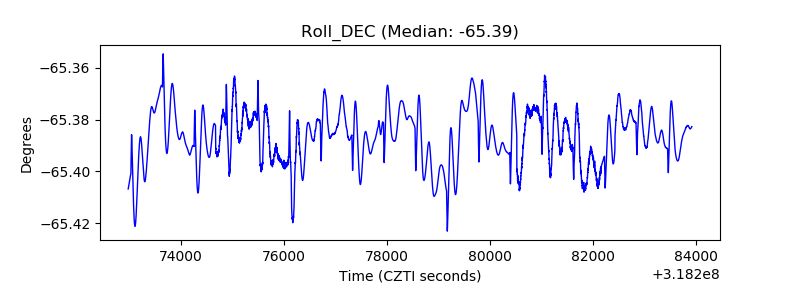 |
| _Roll_RA | 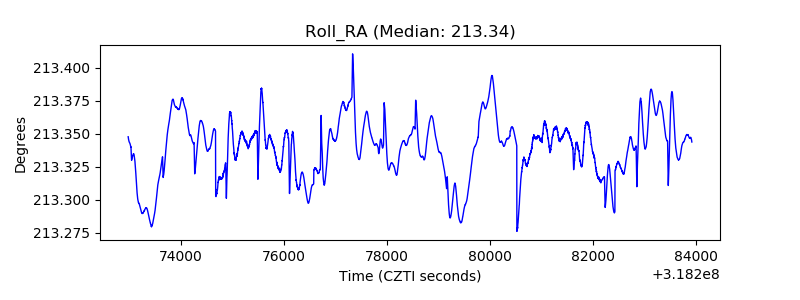 |
| Veto Counter | 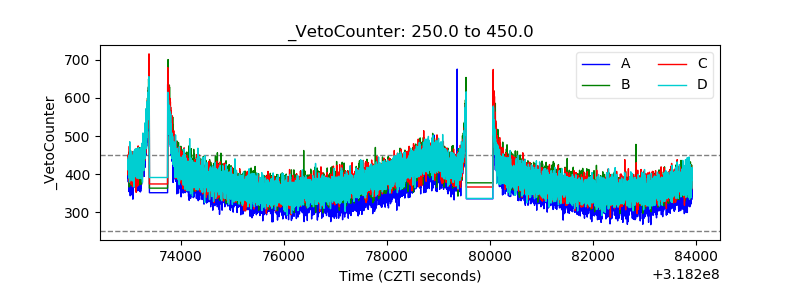 |