| Param | Original file | Final file |
|---|---|---|
| Filename | modeM0/AS1A07_100T02_9000003476_23501cztM0_level2.evt | modeM0/AS1A07_100T02_9000003476_23501cztM0_level2_quad_clean.evt |
| Size (bytes) | 104,952,960 | 18,722,880 |
| Size | 100.1 MB | 17.9 MB |
| Events in quadrant A | 684,601 | 119,064 |
| Events in quadrant B | 838,371 | 117,044 |
| Events in quadrant C | 699,018 | 113,629 |
| Events in quadrant D | 858,222 | 111,979 |
| Mode SS | |||
|---|---|---|---|
| Quadrant | BADHDUFLAG | Total packets | Discarded packets |
| A | 0 | 36 | 4 |
| B | 0 | 35 | 7 |
| C | 0 | 35 | 3 |
| D | 0 | 36 | 6 |
| Mode M9 | |||
|---|---|---|---|
| Quadrant | BADHDUFLAG | Total packets | Discarded packets |
| A | 0 | 4 | 0 |
| B | 0 | 4 | 0 |
| C | 0 | 4 | 0 |
| D | 0 | 4 | 0 |
| Mode M0 | |||
|---|---|---|---|
| Quadrant | BADHDUFLAG | Total packets | Discarded packets |
| A | 0 | 3318 | 402 |
| B | 0 | 3819 | 470 |
| C | 0 | 3387 | 435 |
| D | 0 | 3954 | 498 |
| Quadrant | Total seconds | Saturated seconds | Saturation percentage |
|---|---|---|---|
| A | 1414 | 35 | 2.475248% |
| B | 1395 | 60 | 4.301075% |
| C | 1405 | 35 | 2.491103% |
| D | 1396 | 47 | 3.366762% |
Noise dominated data is calculated using 1-second bins in cleaned event files. If a bin has >2000 counts, and if more than 50% of those come from <1% of pixels, then it is considered to be noise-dominated and hence unusable.
| Quadrant | # 1 sec bins | Bins with >0 counts | Bins with >2000 counts | High rate bins dominated by noise | Noise dominated (total time) | Noise dominated (detector-on time) | Marked lightcurve |
|---|---|---|---|---|---|---|---|
| A | 2703 | 1445 | 0 | 0 | 0.00% | 0.00% | 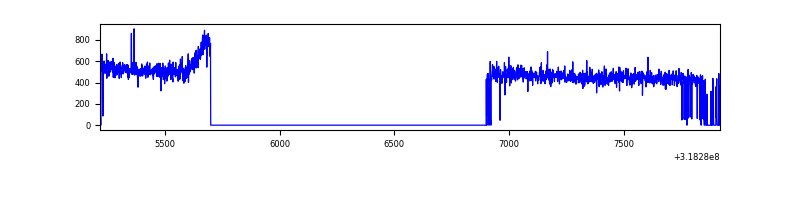 |
| B | 2680 | 1422 | 7 | 7 | 0.26% | 0.49% | 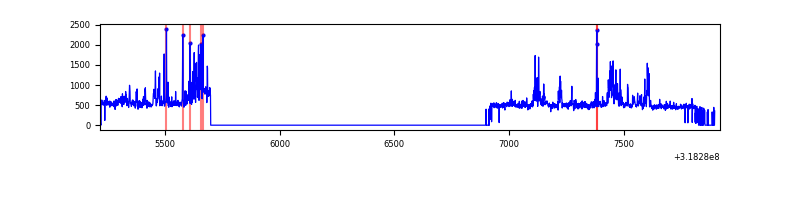 |
| C | 2690 | 1432 | 2 | 2 | 0.07% | 0.14% | 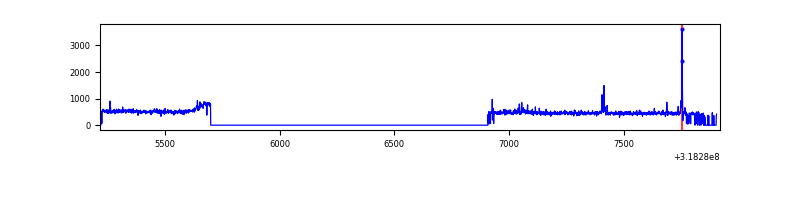 |
| D | 2695 | 1431 | 14 | 14 | 0.52% | 0.98% | 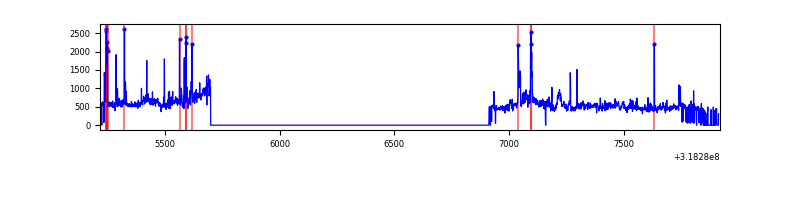 |
Top three noisy pixels from each quadrant. If the there are fewer than three noisy pixels in the level2.evt file, extra rows are filled as -1
| Pixel properties | Quadrant properties | ||||||
|---|---|---|---|---|---|---|---|
| Quadrant | DetID | PixID | Counts | Sigma | Mean | Median | Sigma |
| A | 13 | 254 | 2786 | 68.78 | 177 | 173 | 38.0 |
| A | 3 | 137 | 1646 | 38.77 | 177 | 173 | 38.0 |
| A | 0 | 226 | 1542 | 36.03 | 177 | 173 | 38.0 |
| B | 0 | 189 | 105336 | 2912.12 | 173 | 170 | 36.1 |
| B | 0 | 229 | 16828 | 461.27 | 173 | 170 | 36.1 |
| B | 0 | 219 | 12372 | 337.88 | 173 | 170 | 36.1 |
| C | 14 | 238 | 25990 | 630.46 | 165 | 166 | 41.0 |
| C | 2 | 16 | 11598 | 279.1 | 165 | 166 | 41.0 |
| C | 0 | 207 | 9205 | 220.68 | 165 | 166 | 41.0 |
| D | 1 | 52 | 187979 | 4402.07 | 166 | 160 | 42.7 |
| D | 12 | 233 | 18260 | 424.22 | 166 | 160 | 42.7 |
| D | 13 | 138 | 9401 | 216.59 | 166 | 160 | 42.7 |
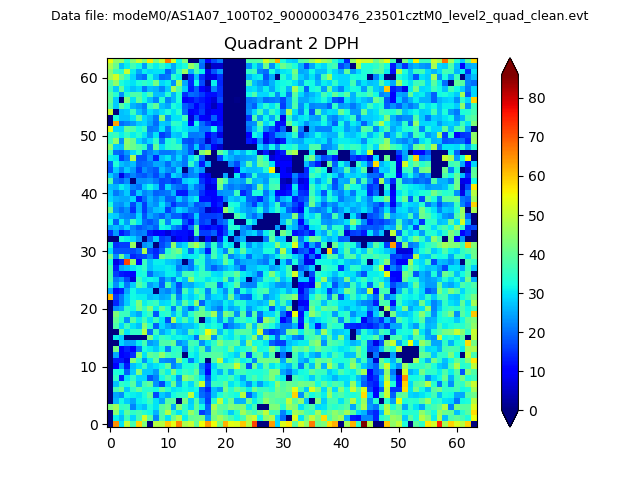
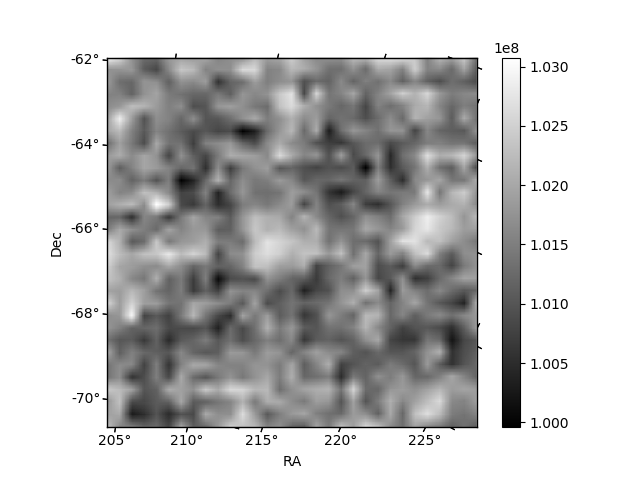
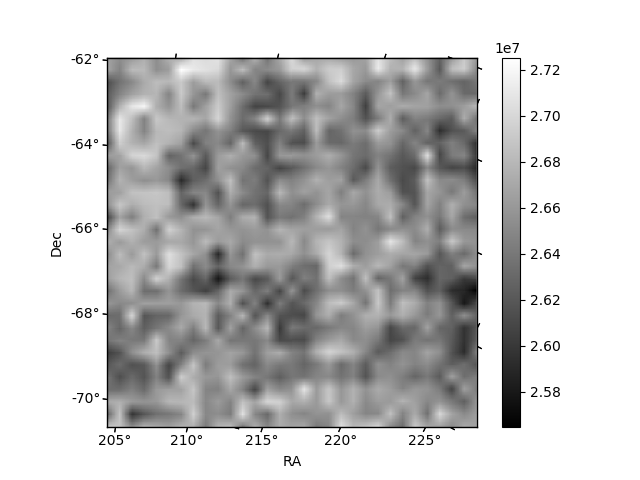
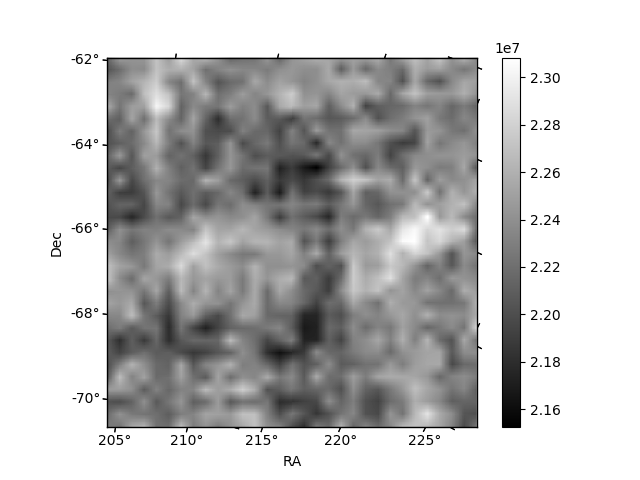
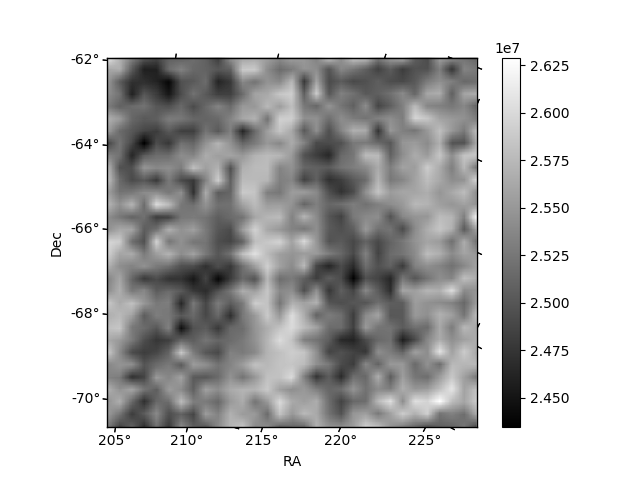
Histogram calculated using DETX and DETY for each event in the final _common_clean file
| Quadrant A | 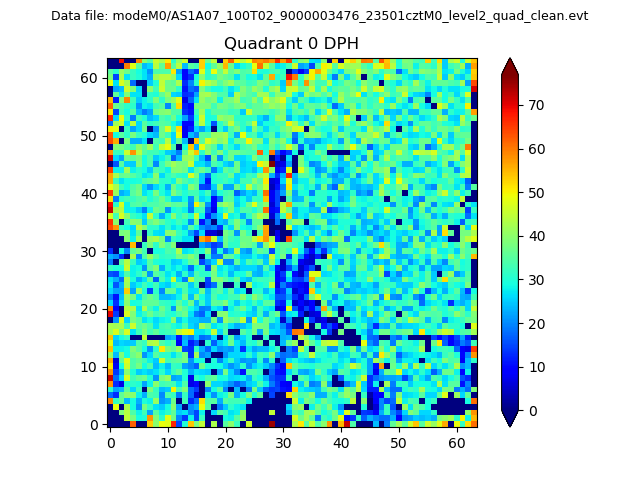 |
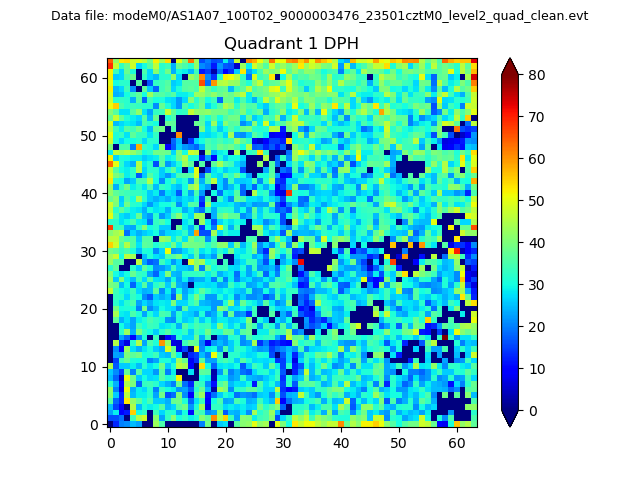 |
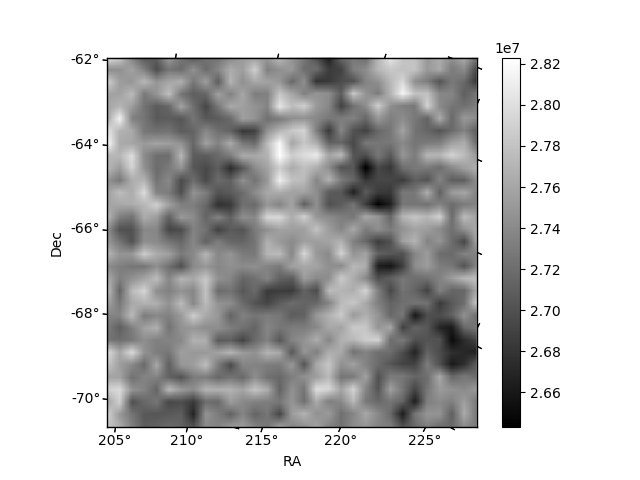
Quadrant B |
|---|---|---|---|
| Quadrant D | 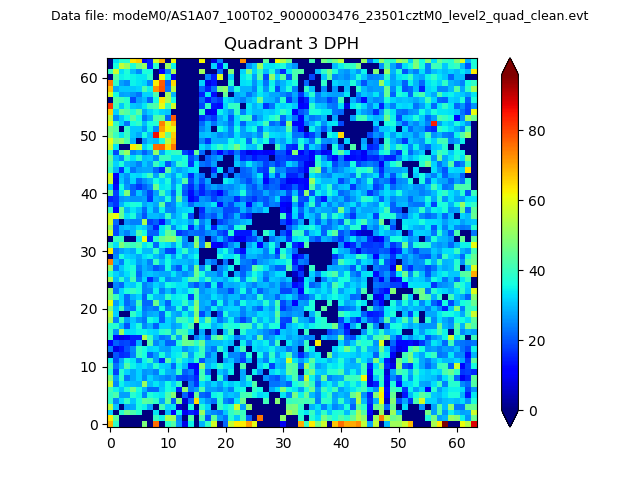 |
 |
Quadrant C |
| Plot type | Count rate plots | Images |
|---|---|---|
| Comparison with Poisson distribution Blue bars denote a histogram of data divided into 1 sec bins. Red curve is a Poisson curve with rate = median count rate of data. |
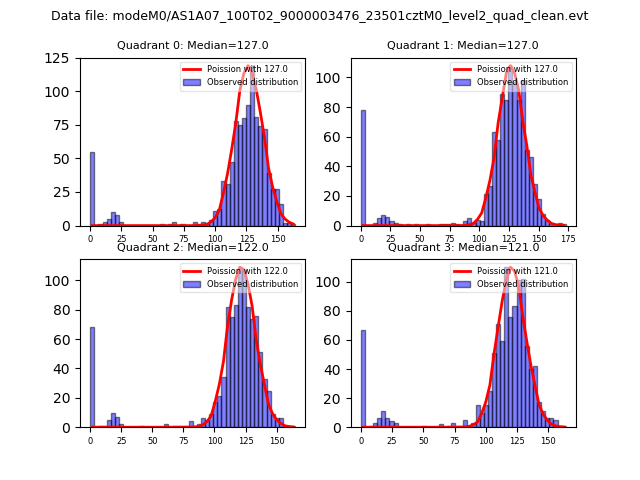 |
 |
| Quadrant-wise count rates Data is divided into 100 sec bins |
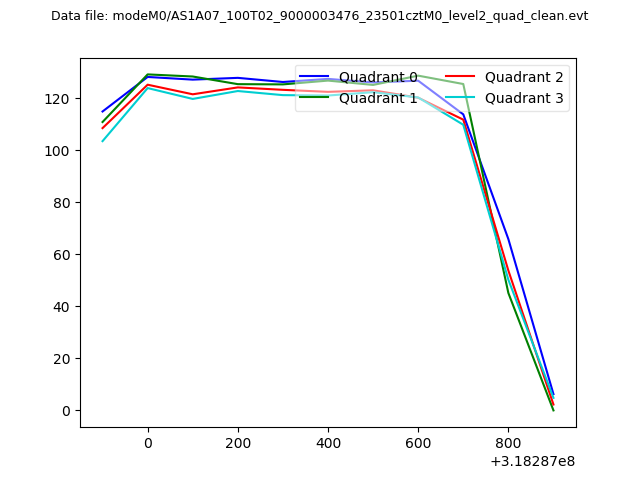 |
|
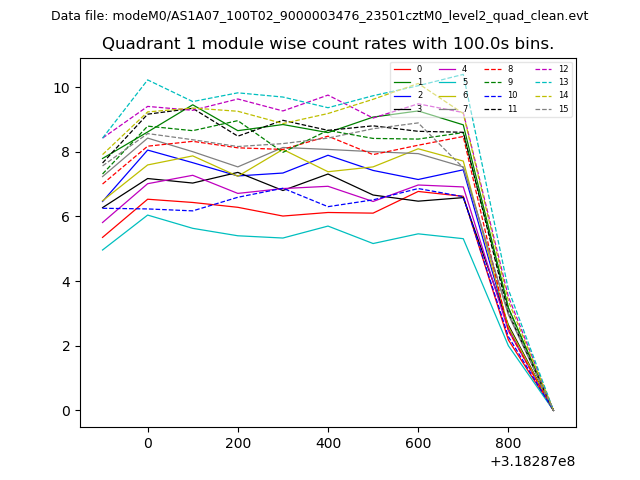
| Module-wise count rates for Quadrant A Data is divided into 100 sec bins |
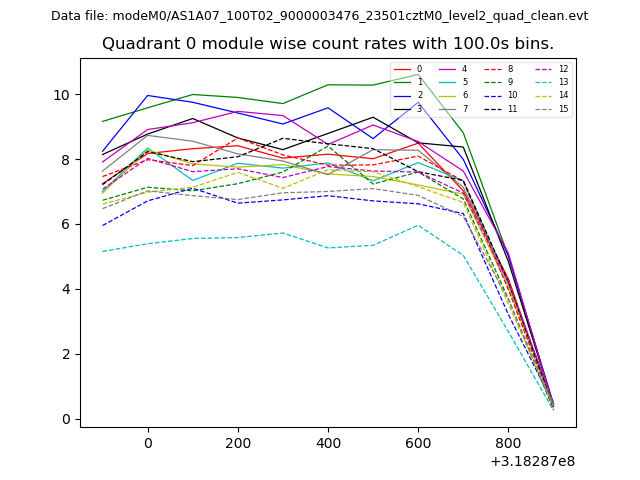 |
 |
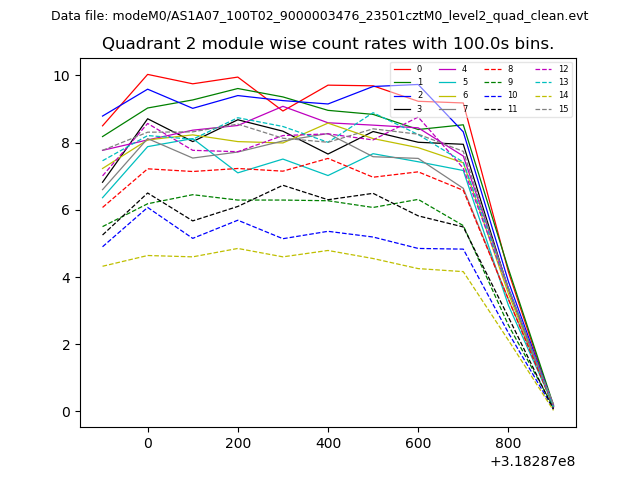
| Module-wise count rates for Quadrant B Data is divided into 100 sec bins |
 |
 |
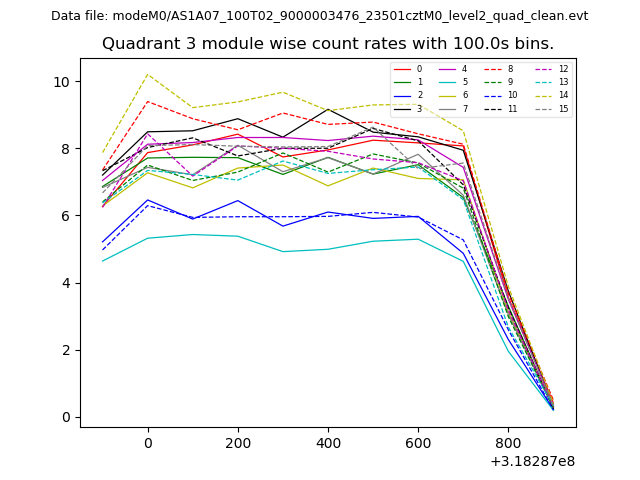
| Module-wise count rates for Quadrant C Data is divided into 100 sec bins |
 |
 |
| Module-wise count rates for Quadrant D Data is divided into 100 sec bins |
 |
 |
| Parameter | Plot |
|---|---|
| CZT HV Monitor | 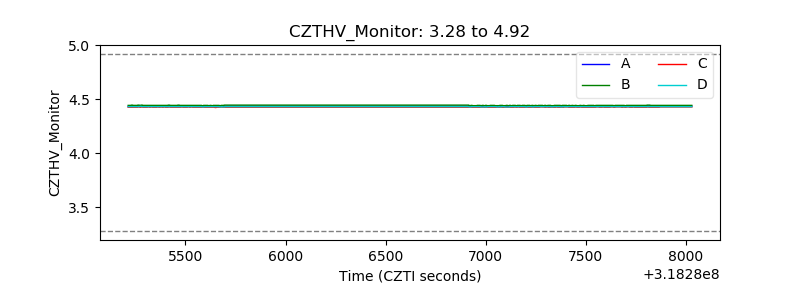 |
| D_VDD | 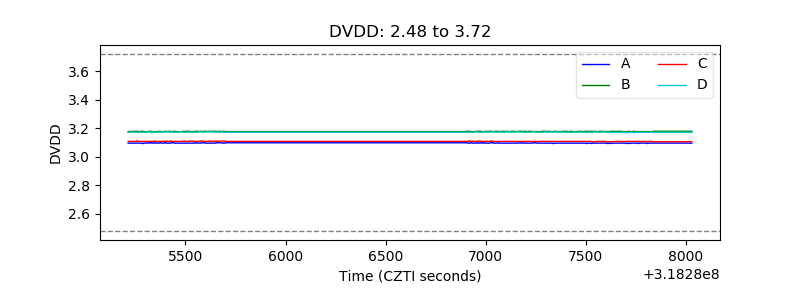 |
| Temperature 1 | 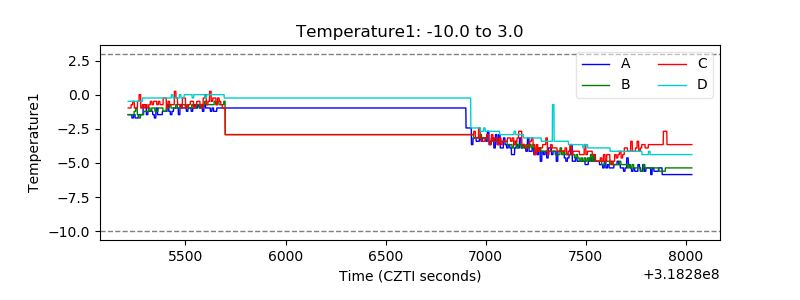 |
| Veto HV Monitor | 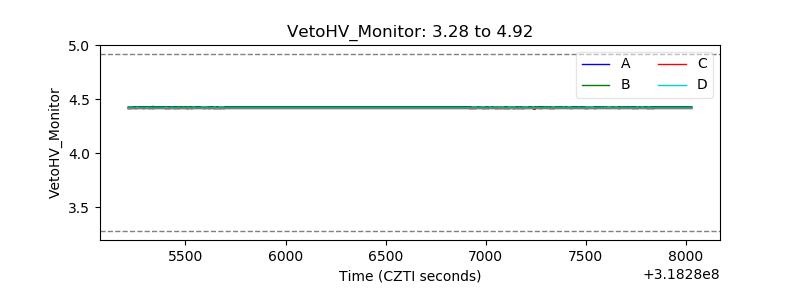 |
| Veto LLD | 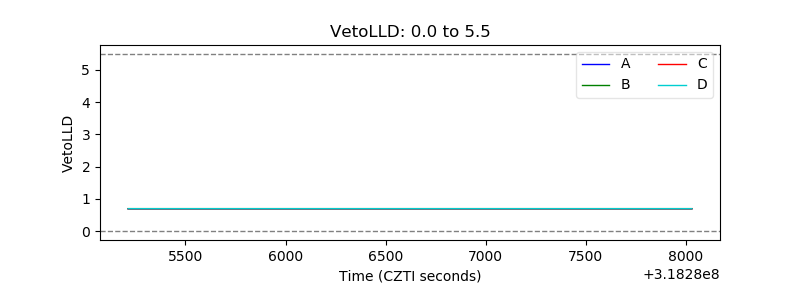 |
| Alpha Counter | 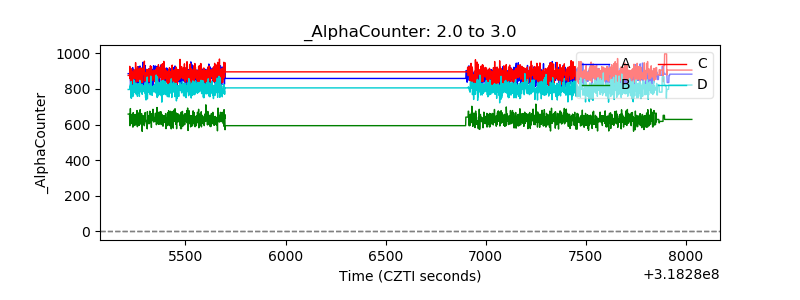 |
| _CPM_Rate | 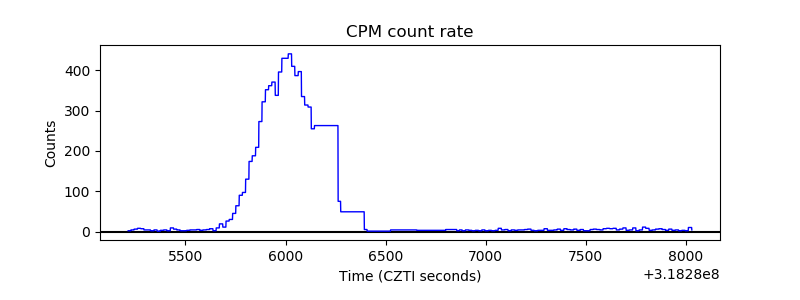 |
| CZT Counter | 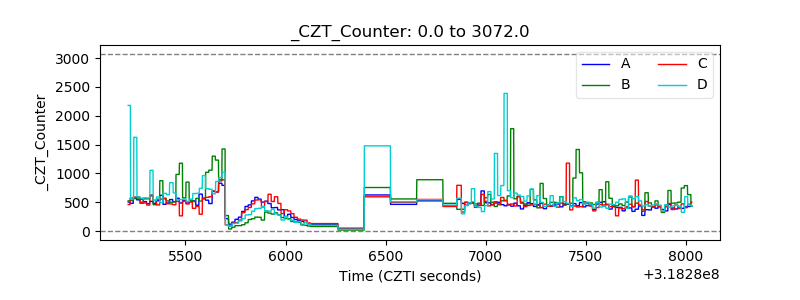 |
| +2.5 Volts monitor |  |
| +5 Volts monitor | 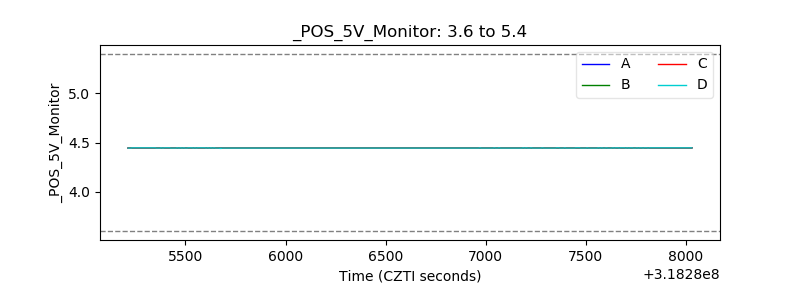 |
| _ROLL_ROT | 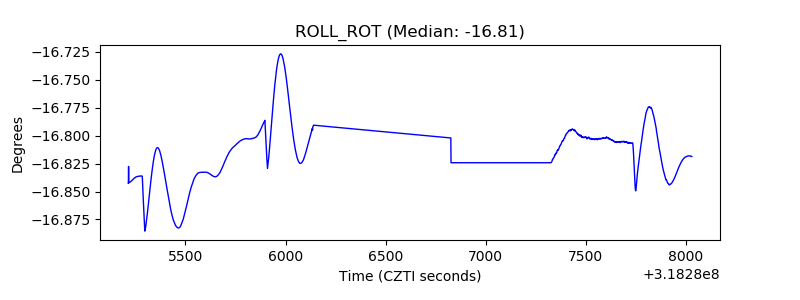 |
| _Roll_DEC | 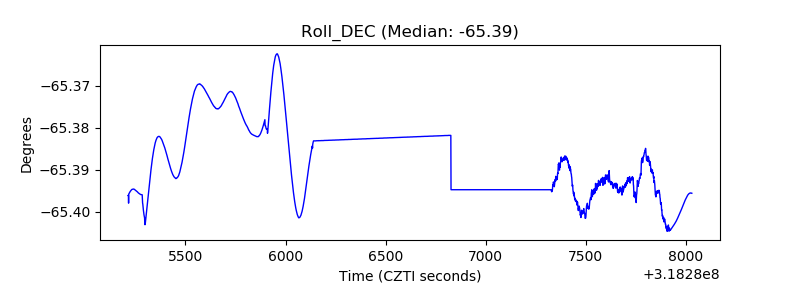 |
| _Roll_RA | 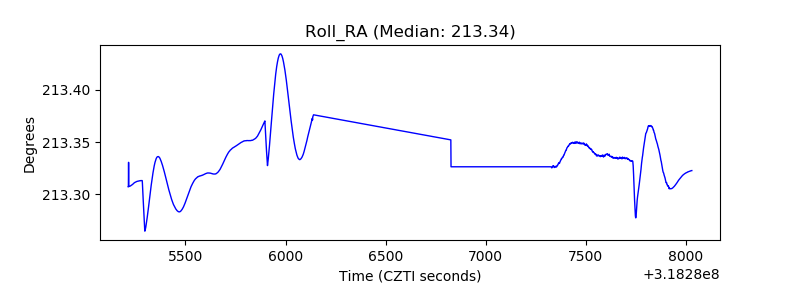 |
| Veto Counter | 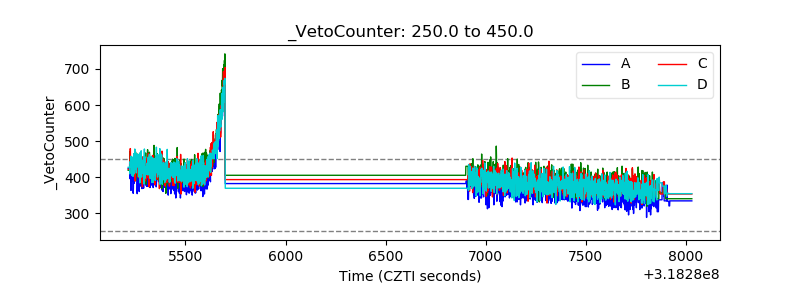 |