| Param | Original file | Final file |
|---|---|---|
| Filename | modeM0/AS1A07_100T02_9000003476_23502cztM0_level2.evt | modeM0/AS1A07_100T02_9000003476_23502cztM0_level2_quad_clean.evt |
| Size (bytes) | 47,111,040 | 13,322,880 |
| Size | 44.9 MB | 12.7 MB |
| Events in quadrant A | 308,364 | 88,509 |
| Events in quadrant B | 386,433 | 88,964 |
| Events in quadrant C | 327,023 | 84,587 |
| Events in quadrant D | 353,383 | 83,824 |
| Mode SS | |||
|---|---|---|---|
| Quadrant | BADHDUFLAG | Total packets | Discarded packets |
| A | 0 | 14 | 0 |
| B | 0 | 14 | 0 |
| C | 0 | 14 | 0 |
| D | 0 | 14 | 0 |
| Mode M0 | |||
|---|---|---|---|
| Quadrant | BADHDUFLAG | Total packets | Discarded packets |
| A | 0 | 1415 | 0 |
| B | 0 | 1610 | 0 |
| C | 0 | 1464 | 0 |
| D | 0 | 1496 | 0 |
| Quadrant | Total seconds | Saturated seconds | Saturation percentage |
|---|---|---|---|
| A | 707 | 0 | 0.000000% |
| B | 707 | 7 | 0.990099% |
| C | 707 | 2 | 0.282885% |
| D | 707 | 1 | 0.141443% |
Noise dominated data is calculated using 1-second bins in cleaned event files. If a bin has >2000 counts, and if more than 50% of those come from <1% of pixels, then it is considered to be noise-dominated and hence unusable.
| Quadrant | # 1 sec bins | Bins with >0 counts | Bins with >2000 counts | High rate bins dominated by noise | Noise dominated (total time) | Noise dominated (detector-on time) | Marked lightcurve |
|---|---|---|---|---|---|---|---|
| A | 707 | 707 | 0 | 0 | 0.00% | 0.00% | 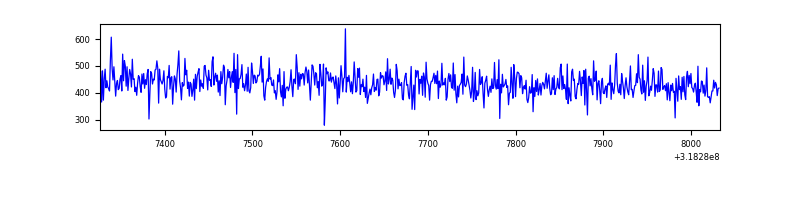 |
| B | 707 | 707 | 2 | 2 | 0.28% | 0.28% | 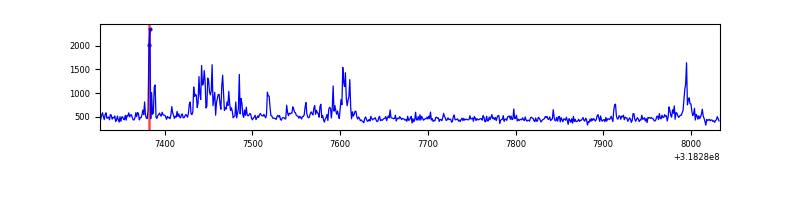 |
| C | 707 | 707 | 2 | 2 | 0.28% | 0.28% | 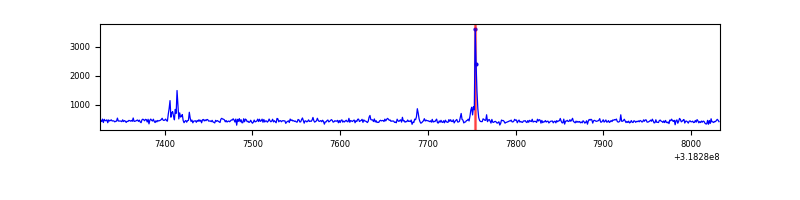 |
| D | 707 | 707 | 1 | 1 | 0.14% | 0.14% | 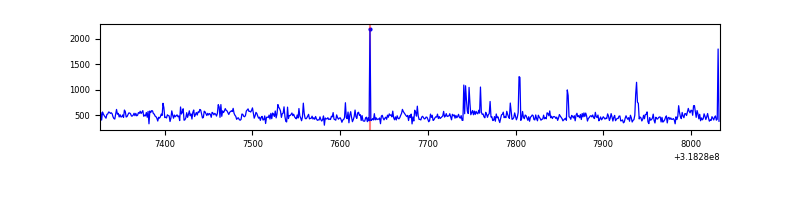 |
Top three noisy pixels from each quadrant. If the there are fewer than three noisy pixels in the level2.evt file, extra rows are filled as -1
| Pixel properties | Quadrant properties | ||||||
|---|---|---|---|---|---|---|---|
| Quadrant | DetID | PixID | Counts | Sigma | Mean | Median | Sigma |
| A | 13 | 254 | 1453 | 74.46 | 79 | 77 | 18.5 |
| A | 3 | 137 | 746 | 36.19 | 79 | 77 | 18.5 |
| A | 0 | 226 | 686 | 32.94 | 79 | 77 | 18.5 |
| B | 0 | 189 | 55502 | 3085.0 | 80 | 78 | 18.0 |
| B | 15 | 36 | 6571 | 361.41 | 80 | 78 | 18.0 |
| B | 0 | 219 | 4443 | 242.96 | 80 | 78 | 18.0 |
| C | 14 | 238 | 12093 | 617.43 | 75 | 75 | 19.5 |
| C | 2 | 16 | 10690 | 545.35 | 75 | 75 | 19.5 |
| C | 0 | 207 | 6234 | 316.42 | 75 | 75 | 19.5 |
| D | 1 | 52 | 47528 | 2359.51 | 75 | 73 | 20.1 |
| D | 13 | 138 | 5856 | 287.54 | 75 | 73 | 20.1 |
| D | 2 | 234 | 3129 | 151.95 | 75 | 73 | 20.1 |
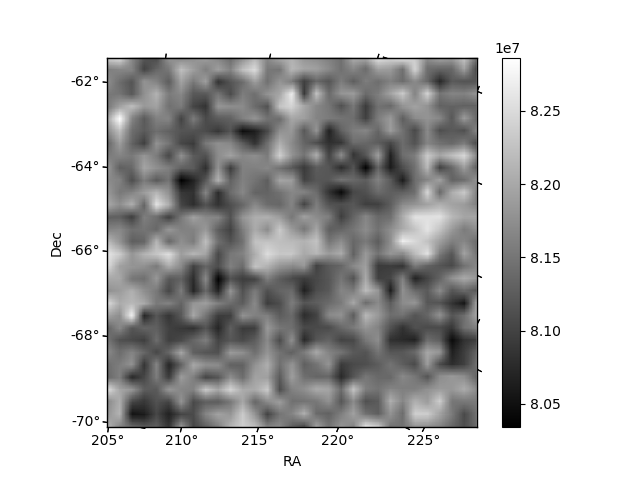
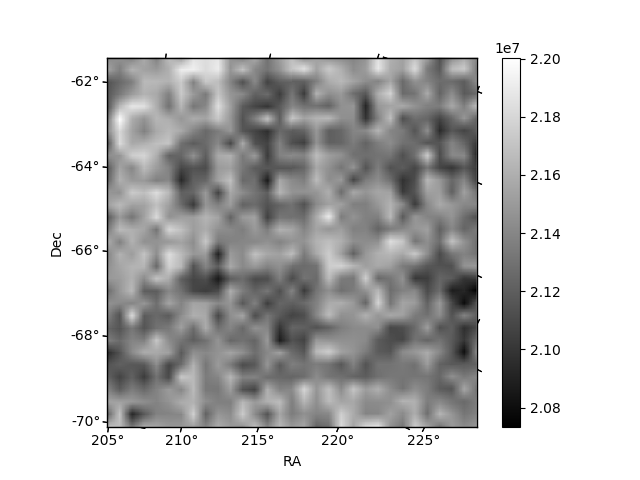
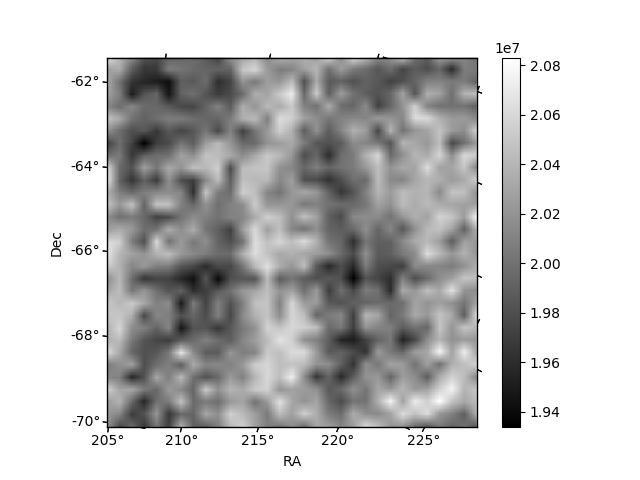
Histogram calculated using DETX and DETY for each event in the final _common_clean file
| Quadrant A | 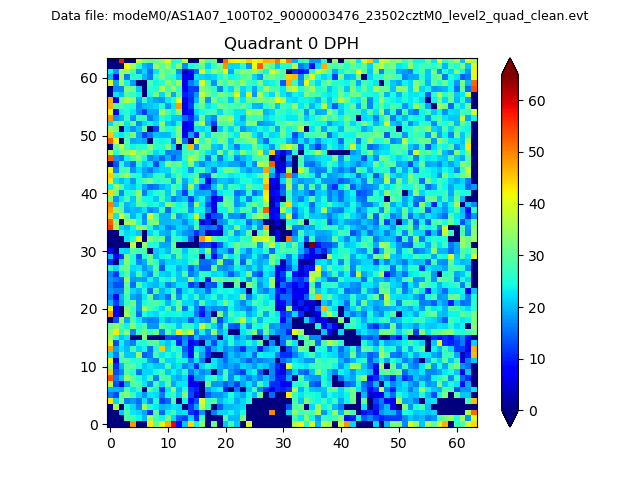 |
 |
Quadrant B |
|---|---|---|---|
| Quadrant D | 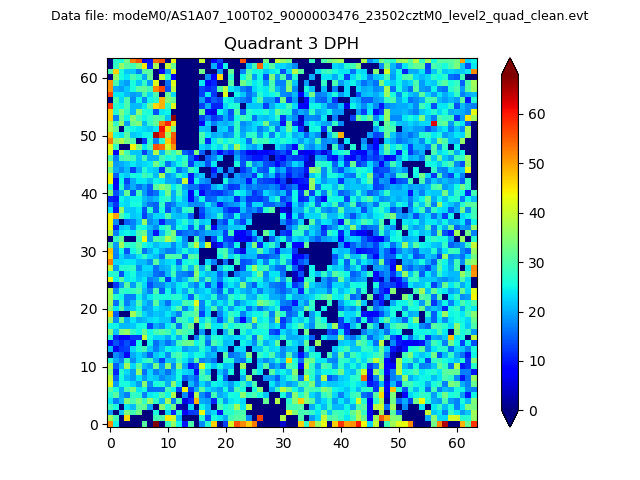 |
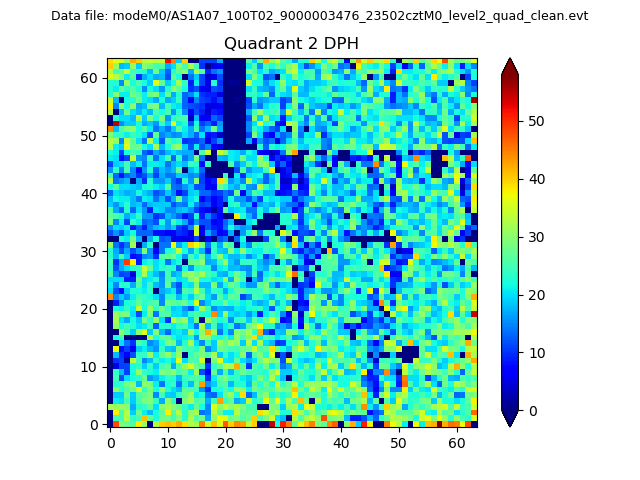 |
Quadrant C |
| Plot type | Count rate plots | Images |
|---|---|---|
| Comparison with Poisson distribution Blue bars denote a histogram of data divided into 1 sec bins. Red curve is a Poisson curve with rate = median count rate of data. |
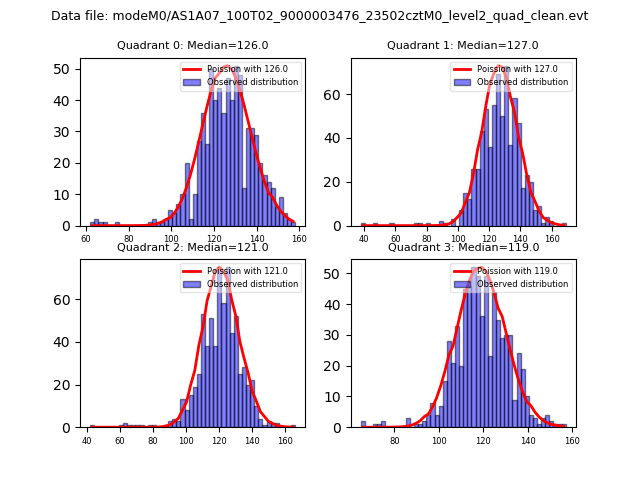 |
 |
| Quadrant-wise count rates Data is divided into 100 sec bins |
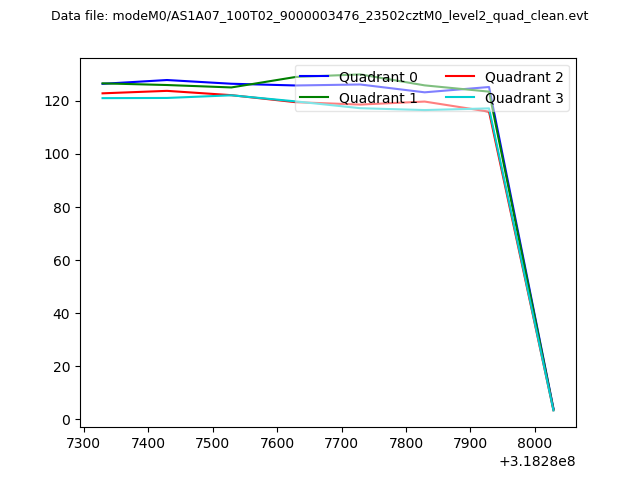 |
|
| Module-wise count rates for Quadrant A Data is divided into 100 sec bins |
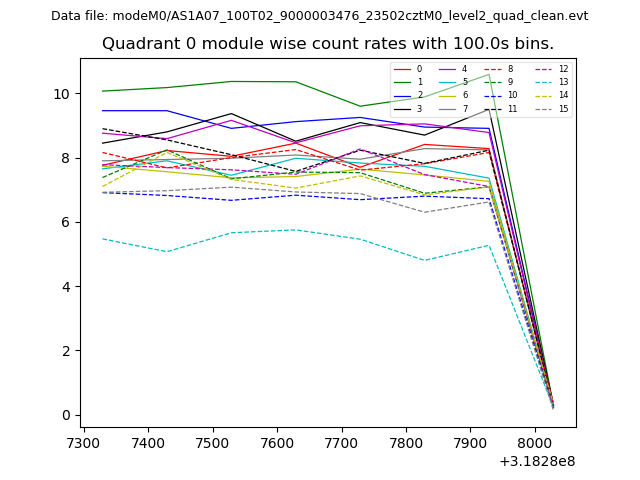 |
 |
| Module-wise count rates for Quadrant B Data is divided into 100 sec bins |
 |
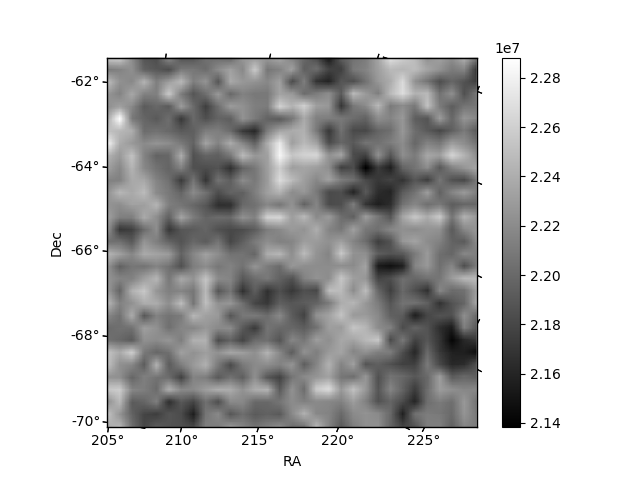 |
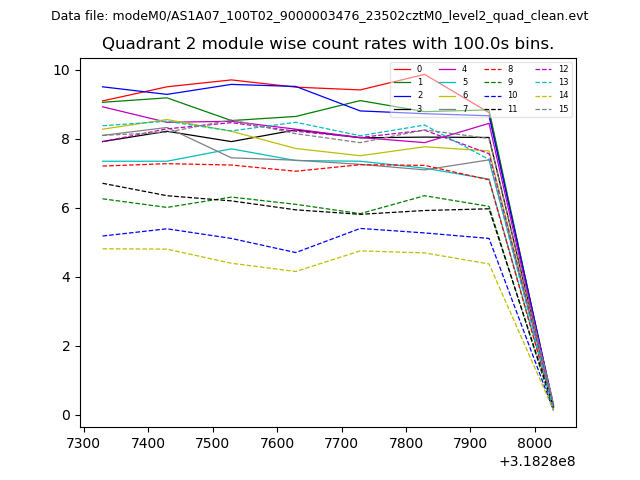
| Module-wise count rates for Quadrant C Data is divided into 100 sec bins |
 |
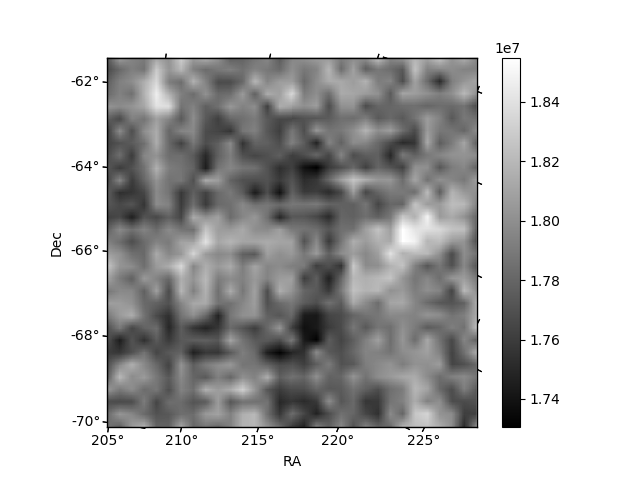 |
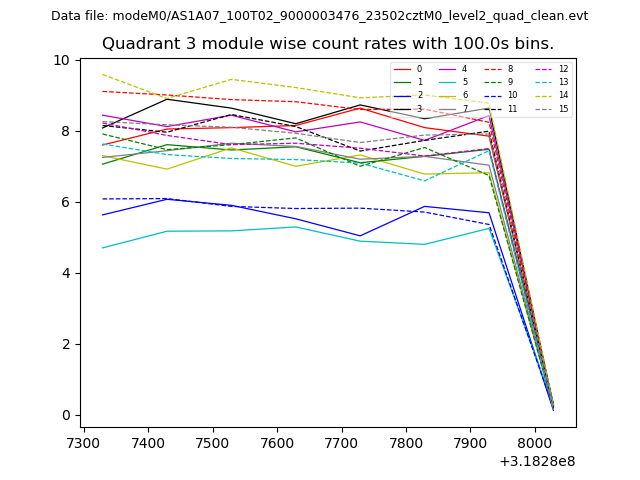
| Module-wise count rates for Quadrant D Data is divided into 100 sec bins |
 |
 |
| Parameter | Plot |
|---|---|
| CZT HV Monitor | 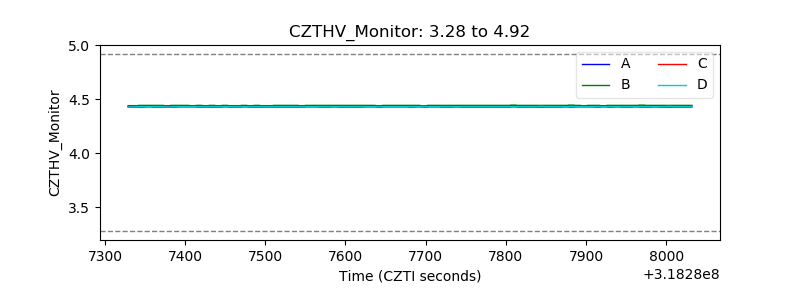 |
| D_VDD | 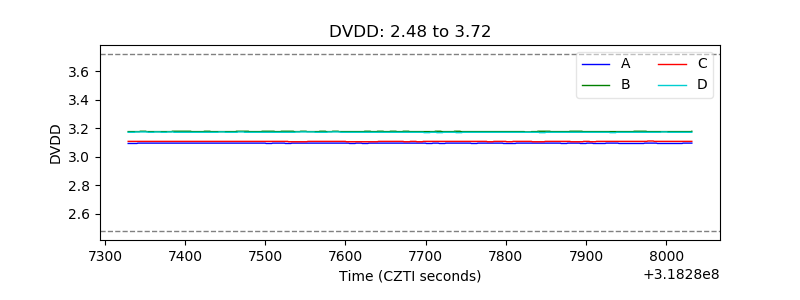 |
| Temperature 1 | 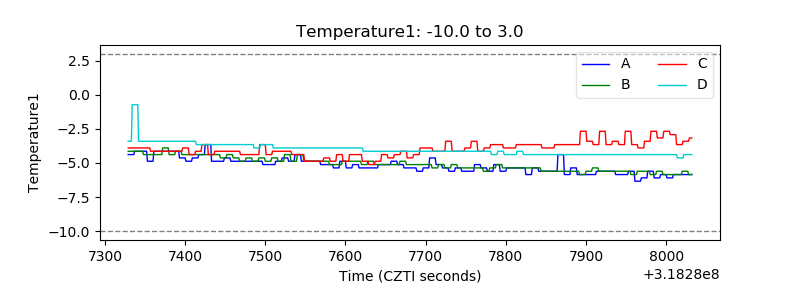 |
| Veto HV Monitor | 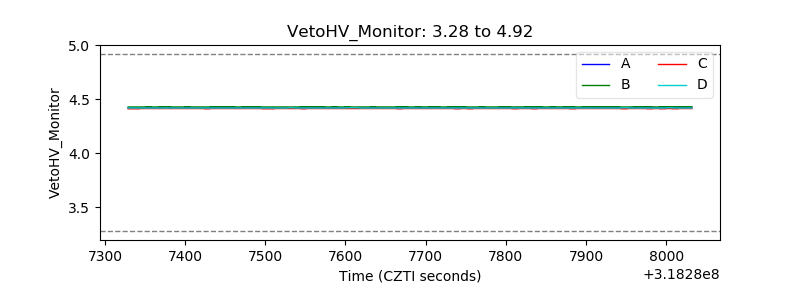 |
| Veto LLD | 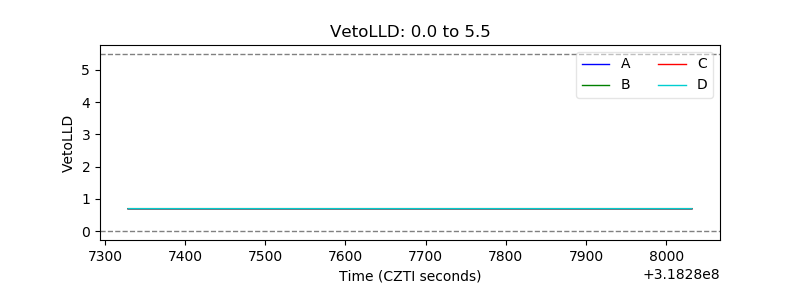 |
| Alpha Counter | 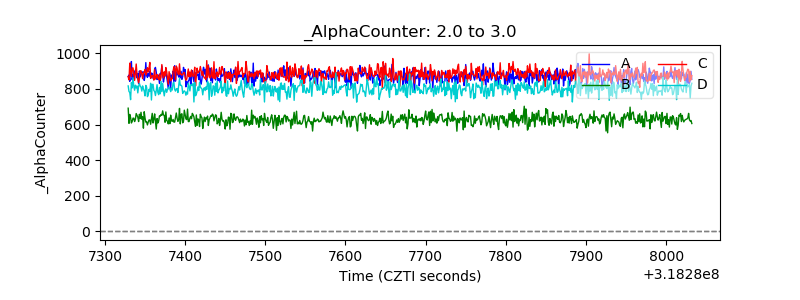 |
| _CPM_Rate | 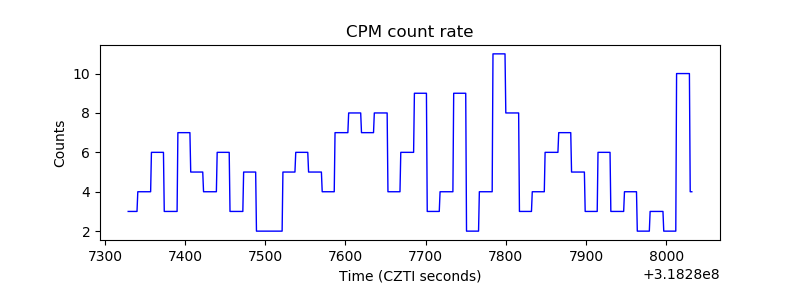 |
| CZT Counter | 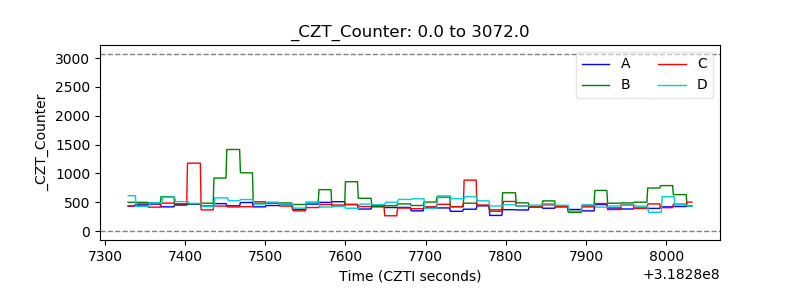 |
| +2.5 Volts monitor |  |
| +5 Volts monitor |  |
| _ROLL_ROT | 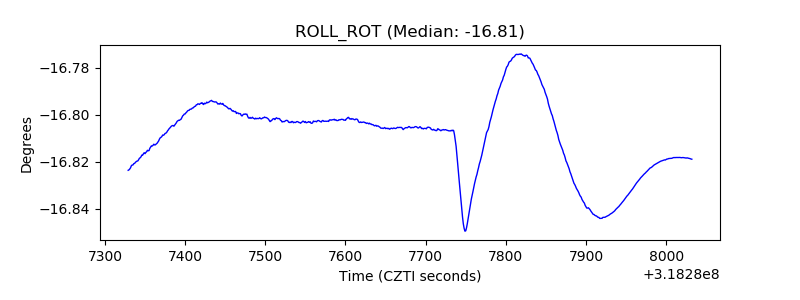 |
| _Roll_DEC | 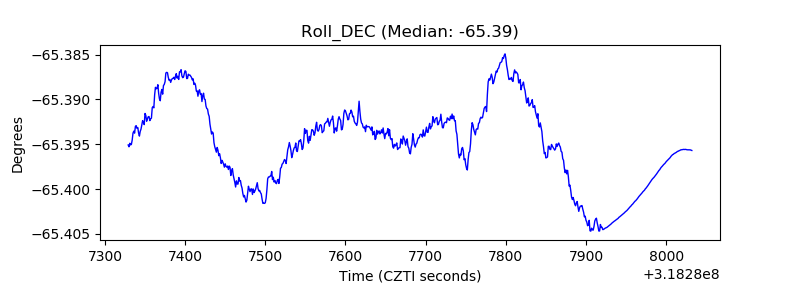 |
| _Roll_RA | 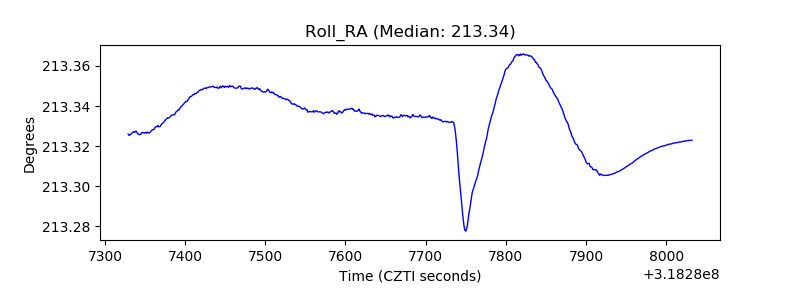 |
| Veto Counter | 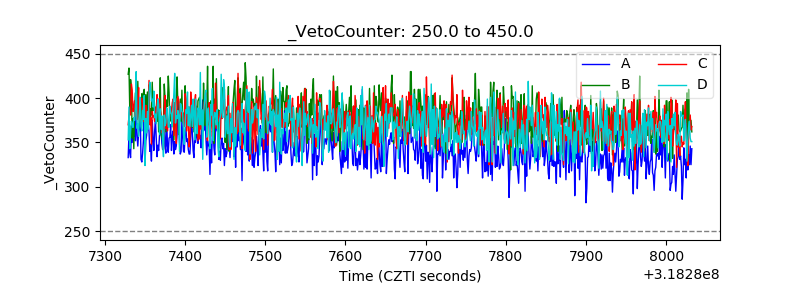 |