| Param | Original file | Final file |
|---|---|---|
| Filename | modeM0/AS1A07_100T02_9000003476_23505cztM0_level2.evt | modeM0/AS1A07_100T02_9000003476_23505cztM0_level2_quad_clean.evt |
| Size (bytes) | 314,357,760 | 66,582,720 |
| Size | 299.8 MB | 63.5 MB |
| Events in quadrant A | 1,992,695 | 440,789 |
| Events in quadrant B | 2,285,084 | 446,070 |
| Events in quadrant C | 2,075,160 | 427,196 |
| Events in quadrant D | 2,880,439 | 405,811 |
| Mode SS | |||
|---|---|---|---|
| Quadrant | BADHDUFLAG | Total packets | Discarded packets |
| A | 0 | 86 | 0 |
| B | 0 | 86 | 0 |
| C | 0 | 86 | 0 |
| D | 0 | 86 | 0 |
| Mode M9 | |||
|---|---|---|---|
| Quadrant | BADHDUFLAG | Total packets | Discarded packets |
| A | 0 | 7 | 0 |
| B | 0 | 7 | 0 |
| C | 0 | 7 | 0 |
| D | 0 | 7 | 0 |
| Mode M0 | |||
|---|---|---|---|
| Quadrant | BADHDUFLAG | Total packets | Discarded packets |
| A | 0 | 8577 | 1 |
| B | 0 | 9473 | 1 |
| C | 0 | 8743 | 1 |
| D | 0 | 11299 | 1 |
| Quadrant | Total seconds | Saturated seconds | Saturation percentage |
|---|---|---|---|
| A | 4206 | 39 | 0.927247% |
| B | 4207 | 85 | 2.020442% |
| C | 4207 | 57 | 1.354885% |
| D | 4207 | 289 | 6.869503% |
Noise dominated data is calculated using 1-second bins in cleaned event files. If a bin has >2000 counts, and if more than 50% of those come from <1% of pixels, then it is considered to be noise-dominated and hence unusable.
| Quadrant | # 1 sec bins | Bins with >0 counts | Bins with >2000 counts | High rate bins dominated by noise | Noise dominated (total time) | Noise dominated (detector-on time) | Marked lightcurve |
|---|---|---|---|---|---|---|---|
| A | 4891 | 4206 | 0 | 0 | 0.00% | 0.00% | 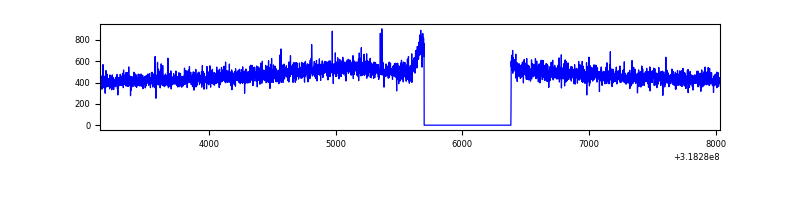 |
| B | 4892 | 4207 | 14 | 14 | 0.29% | 0.33% | 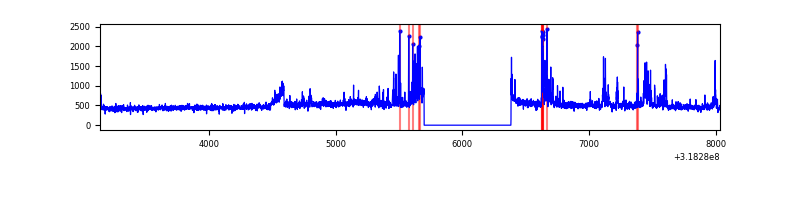 |
| C | 4892 | 4207 | 4 | 4 | 0.08% | 0.10% | 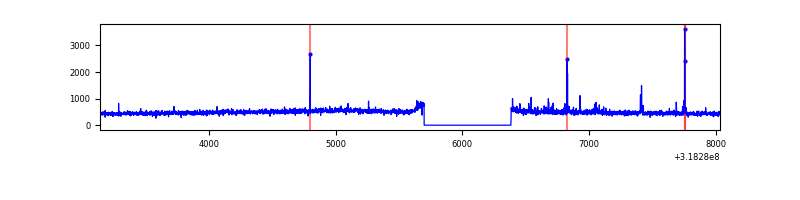 |
| D | 4892 | 4207 | 226 | 226 | 4.62% | 5.37% | 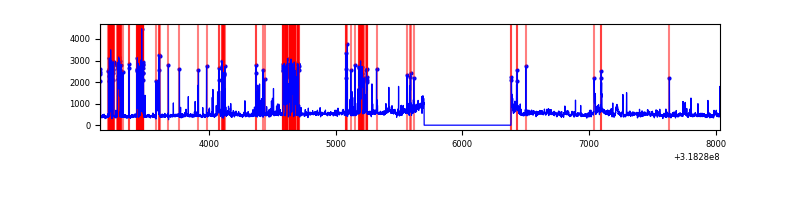 |
Top three noisy pixels from each quadrant. If the there are fewer than three noisy pixels in the level2.evt file, extra rows are filled as -1
| Pixel properties | Quadrant properties | ||||||
|---|---|---|---|---|---|---|---|
| Quadrant | DetID | PixID | Counts | Sigma | Mean | Median | Sigma |
| A | 13 | 254 | 7840 | 69.92 | 516 | 503 | 104.9 |
| A | 3 | 137 | 4547 | 38.54 | 516 | 503 | 104.9 |
| A | 0 | 226 | 4374 | 36.89 | 516 | 503 | 104.9 |
| B | 0 | 189 | 211752 | 2141.67 | 510 | 498 | 98.6 |
| B | 0 | 229 | 18889 | 186.45 | 510 | 498 | 98.6 |
| B | 0 | 219 | 15501 | 152.1 | 510 | 498 | 98.6 |
| C | 14 | 238 | 77272 | 657.83 | 494 | 497 | 116.7 |
| C | 0 | 207 | 34779 | 293.74 | 494 | 497 | 116.7 |
| C | 7 | 247 | 20938 | 175.14 | 494 | 497 | 116.7 |
| D | 1 | 52 | 949804 | 8025.33 | 486 | 470 | 118.3 |
| D | 7 | 38 | 23822 | 197.41 | 486 | 470 | 118.3 |
| D | 7 | 238 | 19392 | 159.96 | 486 | 470 | 118.3 |
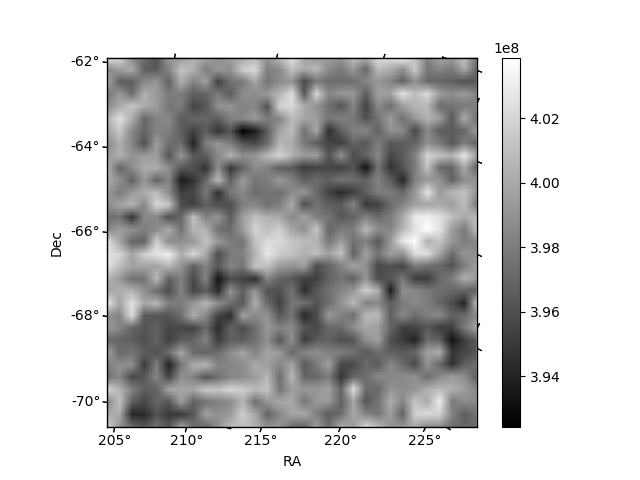
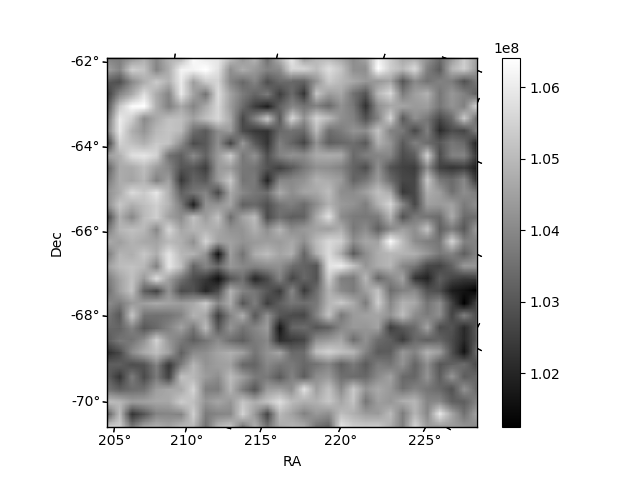
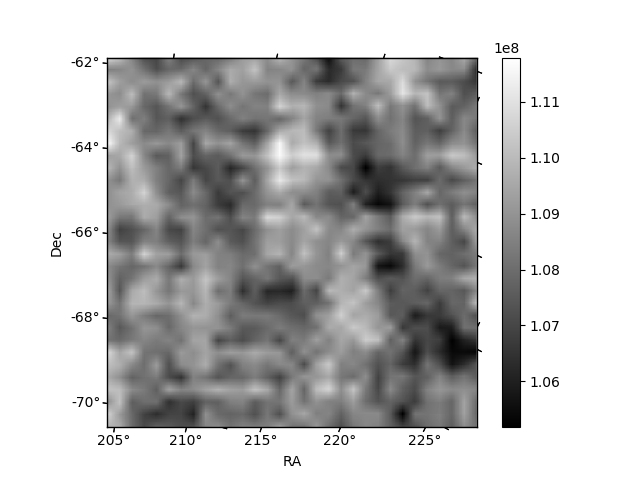
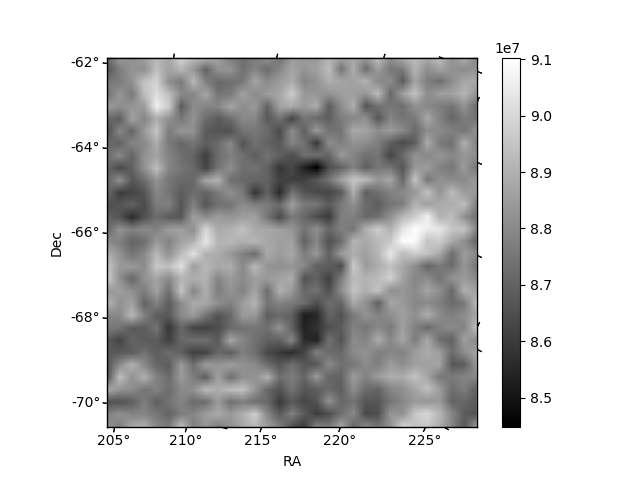
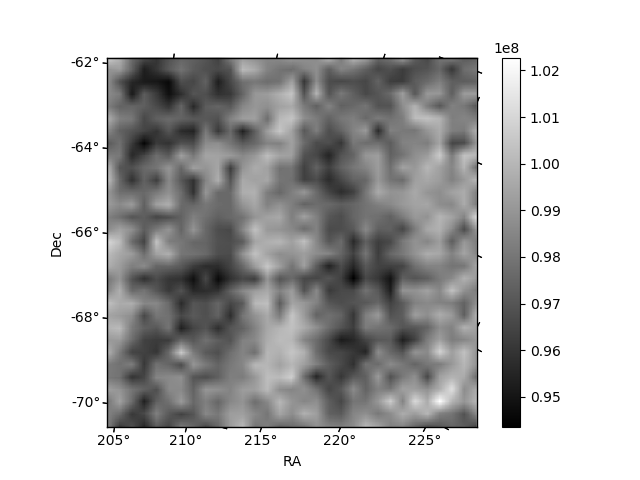
Histogram calculated using DETX and DETY for each event in the final _common_clean file
| Quadrant A | 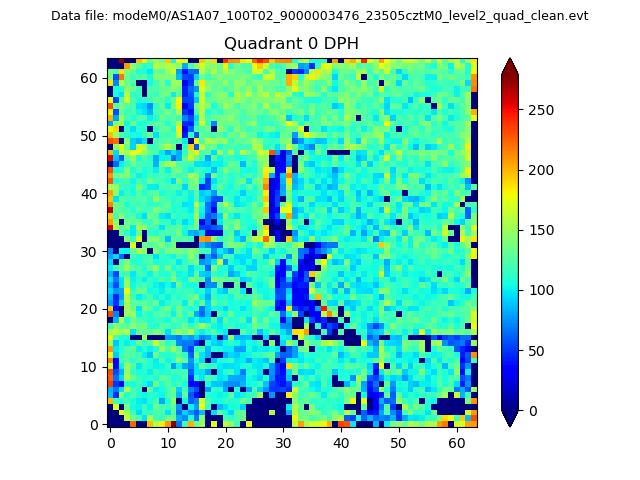 |
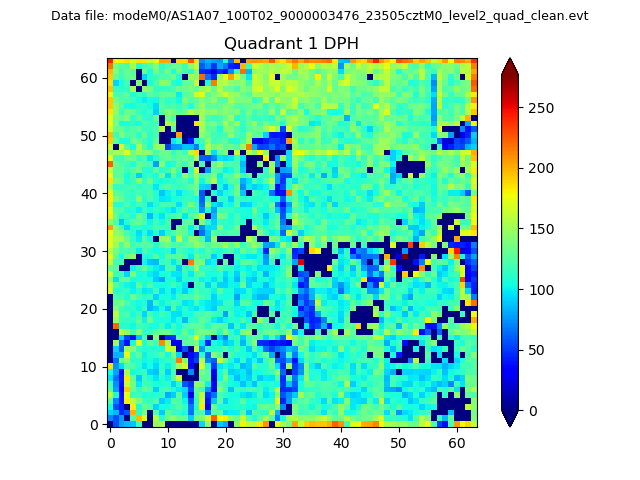 |
Quadrant B |
|---|---|---|---|
| Quadrant D | 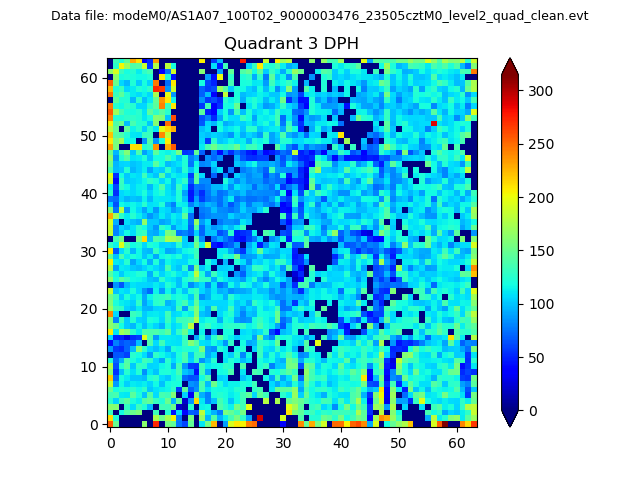 |
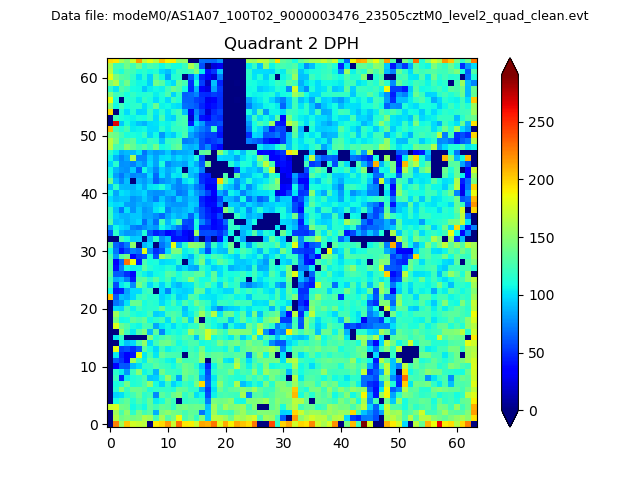 |
Quadrant C |
| Plot type | Count rate plots | Images |
|---|---|---|
| Comparison with Poisson distribution Blue bars denote a histogram of data divided into 1 sec bins. Red curve is a Poisson curve with rate = median count rate of data. |
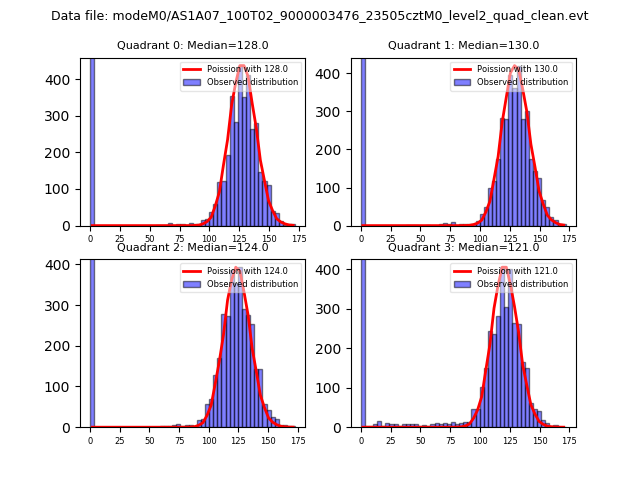 |
 |
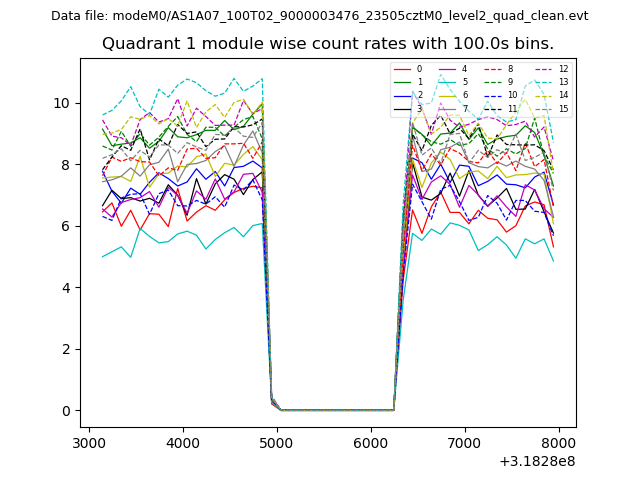
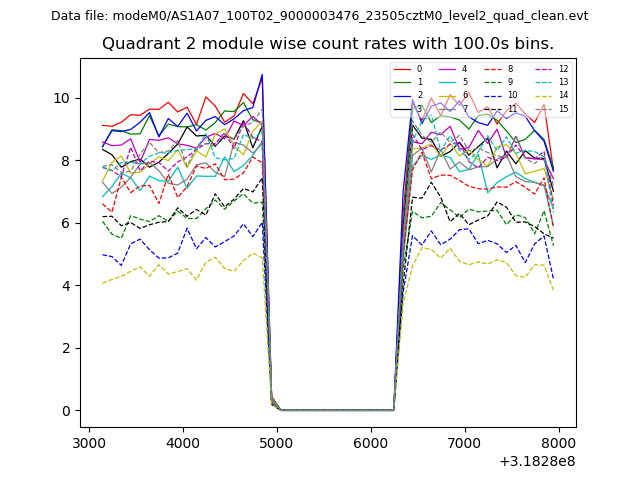
| Quadrant-wise count rates Data is divided into 100 sec bins |
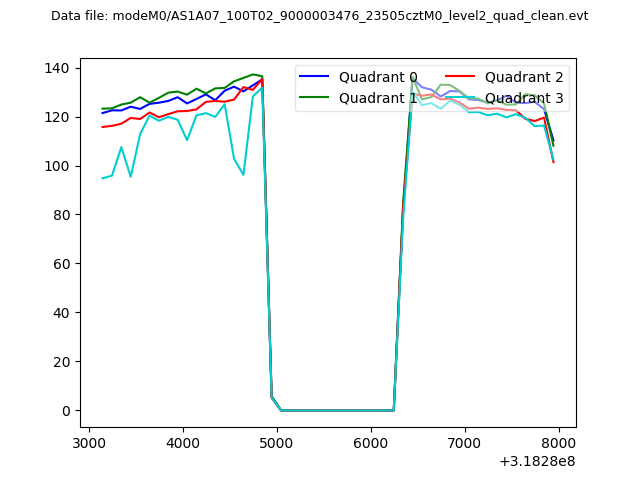 |
|
| Module-wise count rates for Quadrant A Data is divided into 100 sec bins |
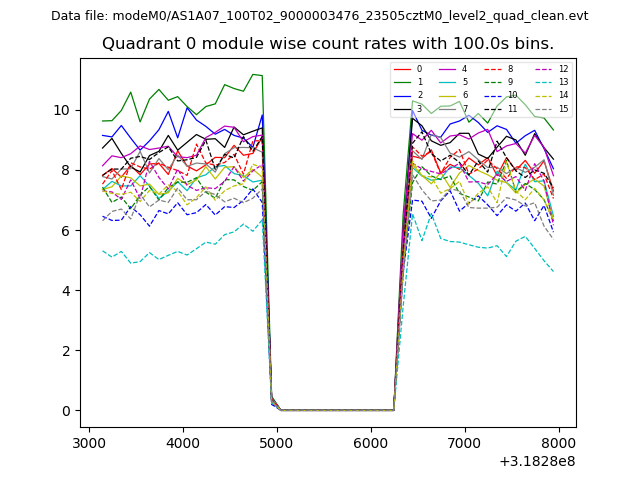 |
 |
| Module-wise count rates for Quadrant B Data is divided into 100 sec bins |
 |
 |
| Module-wise count rates for Quadrant C Data is divided into 100 sec bins |
 |
 |
| Module-wise count rates for Quadrant D Data is divided into 100 sec bins |
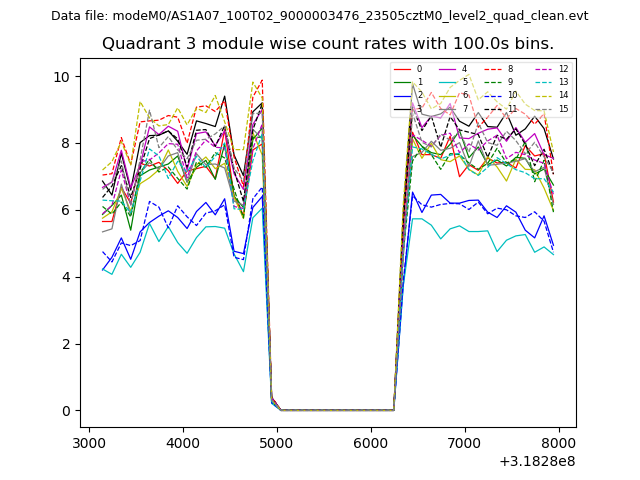 |
 |
| Parameter | Plot |
|---|---|
| CZT HV Monitor | 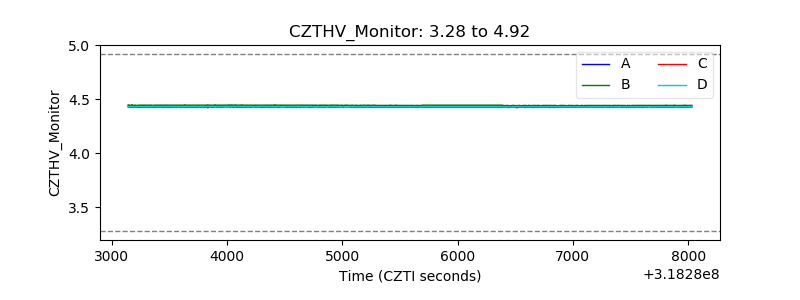 |
| D_VDD | 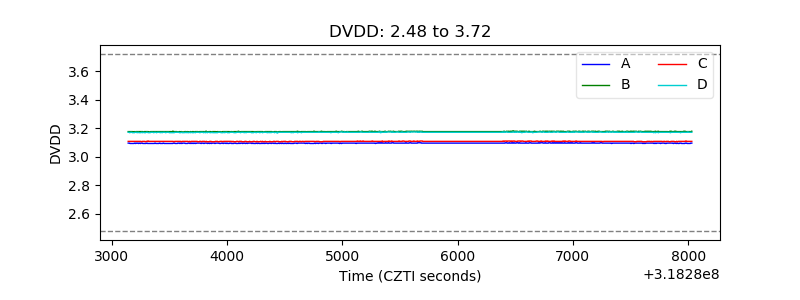 |
| Temperature 1 | 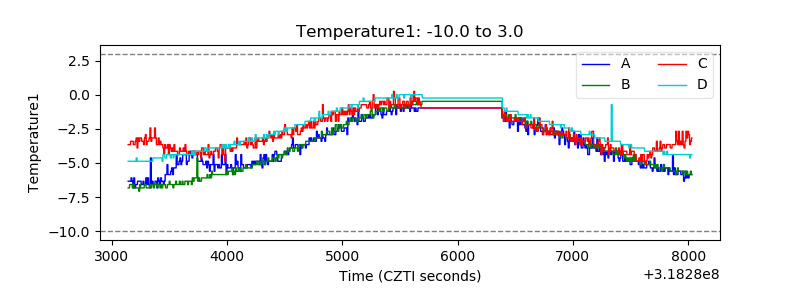 |
| Veto HV Monitor | 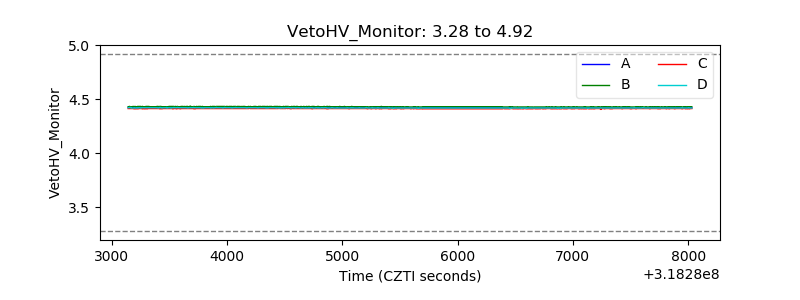 |
| Veto LLD | 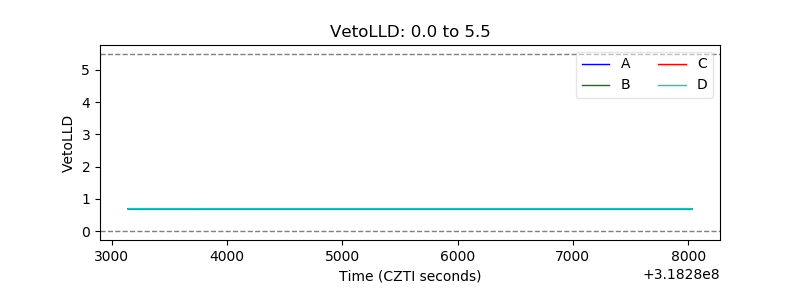 |
| Alpha Counter | 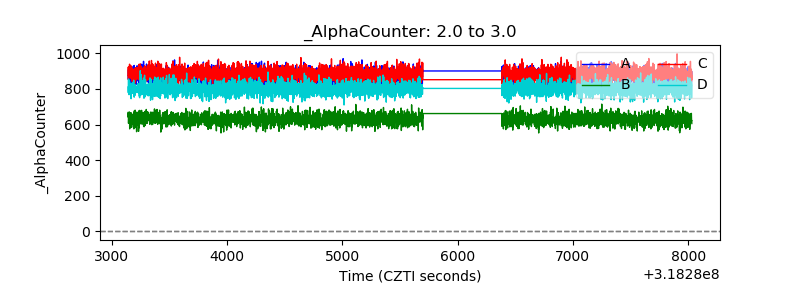 |
| _CPM_Rate | 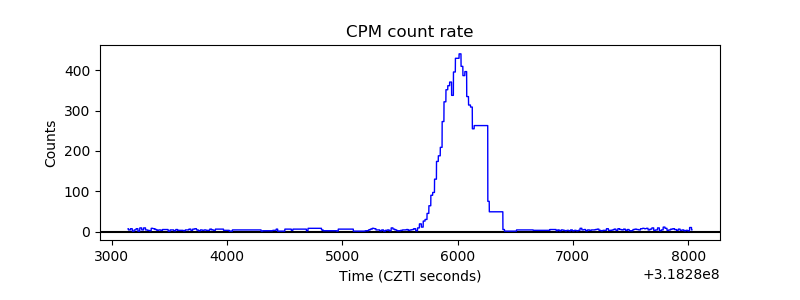 |
| CZT Counter | 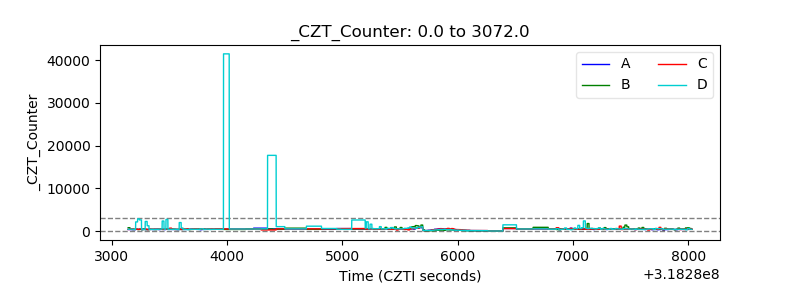 |
| +2.5 Volts monitor | 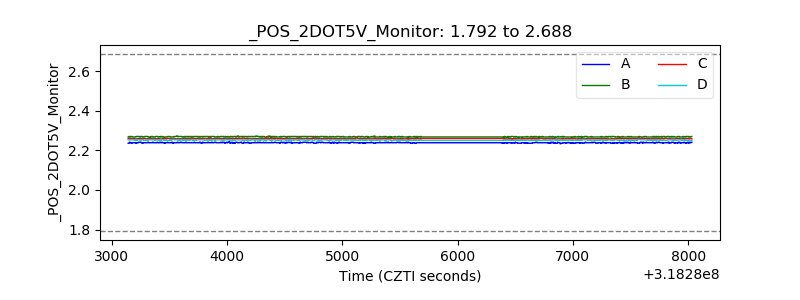 |
| +5 Volts monitor | 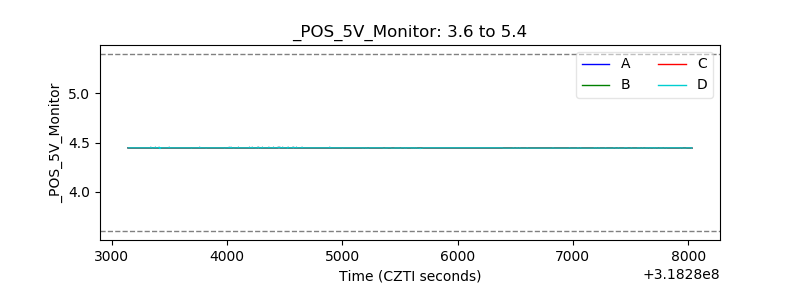 |
| _ROLL_ROT | 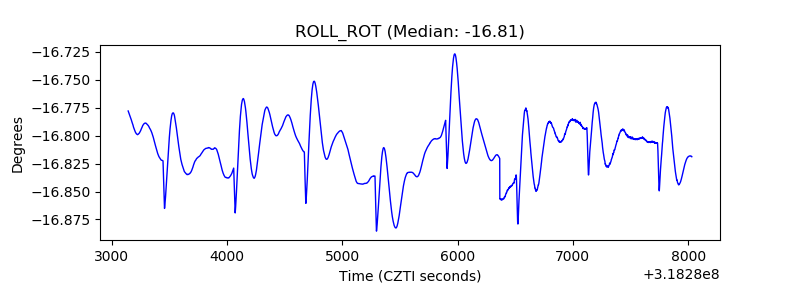 |
| _Roll_DEC | 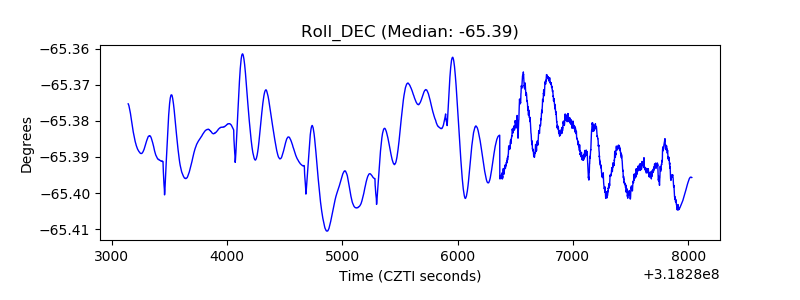 |
| _Roll_RA | 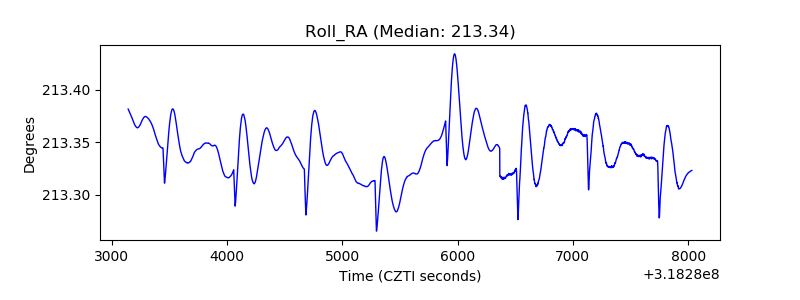 |
| Veto Counter | 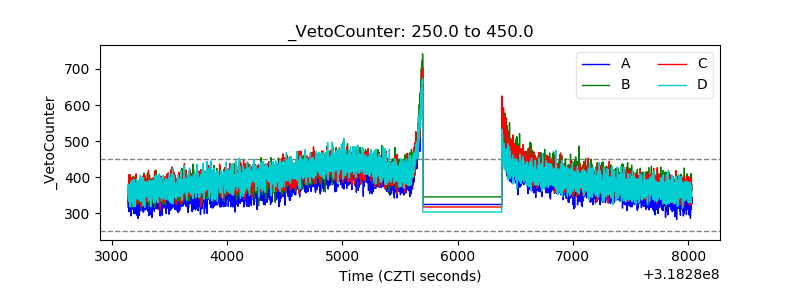 |