| Param | Original file | Final file |
|---|---|---|
| Filename | modeM0/AS1A07_100T02_9000003476_23670cztM0_level2.evt | modeM0/AS1A07_100T02_9000003476_23670cztM0_level2_quad_clean.evt |
| Size (bytes) | 32,961,600 | 2,341,440 |
| Size | 31.4 MB | 2.2 MB |
| Events in quadrant A | 209,156 | 7,603 |
| Events in quadrant B | 225,664 | 8,799 |
| Events in quadrant C | 219,320 | 8,915 |
| Events in quadrant D | 311,946 | 7,480 |
| Mode SS | |||
|---|---|---|---|
| Quadrant | BADHDUFLAG | Total packets | Discarded packets |
| A | 0 | 39 | 33 |
| B | 0 | 37 | 31 |
| C | 0 | 43 | 33 |
| D | 0 | 39 | 32 |
| Mode M9 | |||
|---|---|---|---|
| Quadrant | BADHDUFLAG | Total packets | Discarded packets |
| A | 0 | 5 | 4 |
| B | 0 | 4 | 2 |
| C | 0 | 4 | 3 |
| D | 0 | 5 | 4 |
| Mode M0 | |||
|---|---|---|---|
| Quadrant | BADHDUFLAG | Total packets | Discarded packets |
| A | 0 | 4104 | 3194 |
| B | 0 | 4199 | 3264 |
| C | 0 | 4170 | 3241 |
| D | 0 | 5593 | 4411 |
| Quadrant | Total seconds | Saturated seconds | Saturation percentage |
|---|---|---|---|
| A | 430 | 47 | 10.930233% |
| B | 433 | 58 | 13.394919% |
| C | 439 | 55 | 12.528474% |
| D | 397 | 74 | 18.639798% |
Noise dominated data is calculated using 1-second bins in cleaned event files. If a bin has >2000 counts, and if more than 50% of those come from <1% of pixels, then it is considered to be noise-dominated and hence unusable.
| Quadrant | # 1 sec bins | Bins with >0 counts | Bins with >2000 counts | High rate bins dominated by noise | Noise dominated (total time) | Noise dominated (detector-on time) | Marked lightcurve |
|---|---|---|---|---|---|---|---|
| A | 2493 | 516 | 0 | 0 | 0.00% | 0.00% | 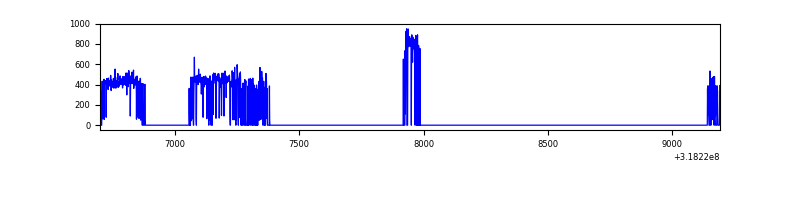 |
| B | 2484 | 514 | 0 | 0 | 0.00% | 0.00% | 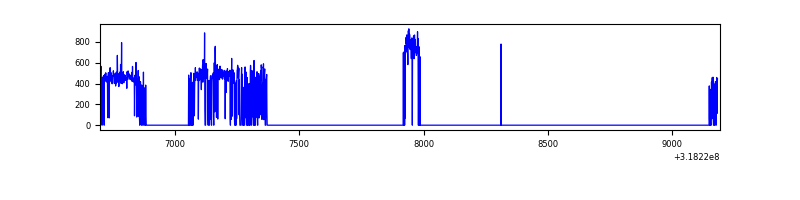 |
| C | 2490 | 520 | 0 | 0 | 0.00% | 0.00% | 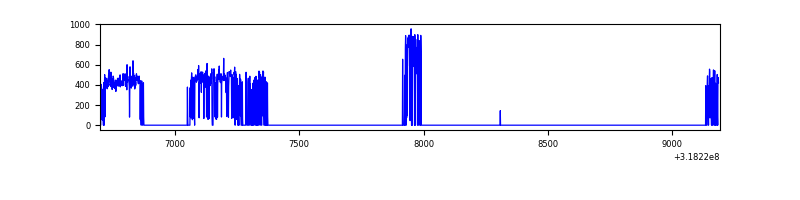 |
| D | 2481 | 492 | 31 | 31 | 1.25% | 6.30% | 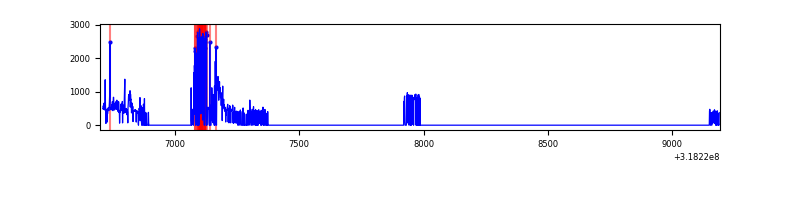 |
Top three noisy pixels from each quadrant. If the there are fewer than three noisy pixels in the level2.evt file, extra rows are filled as -1
| Pixel properties | Quadrant properties | ||||||
|---|---|---|---|---|---|---|---|
| Quadrant | DetID | PixID | Counts | Sigma | Mean | Median | Sigma |
| A | 13 | 254 | 826 | 57.83 | 54 | 52 | 13.4 |
| A | 3 | 137 | 539 | 36.39 | 54 | 52 | 13.4 |
| A | 0 | 226 | 460 | 30.49 | 54 | 52 | 13.4 |
| B | 12 | 17 | 2029 | 149.62 | 55 | 54 | 13.2 |
| B | 0 | 245 | 1858 | 136.67 | 55 | 54 | 13.2 |
| B | 0 | 229 | 1766 | 129.7 | 55 | 54 | 13.2 |
| C | 14 | 238 | 8430 | 572.69 | 53 | 53 | 14.6 |
| C | 10 | 9 | 1233 | 80.67 | 53 | 53 | 14.6 |
| C | 7 | 247 | 835 | 53.46 | 53 | 53 | 14.6 |
| D | 1 | 52 | 127011 | 9315.32 | 47 | 46 | 13.6 |
| D | 2 | 234 | 1889 | 135.22 | 47 | 46 | 13.6 |
| D | 10 | 199 | 1601 | 114.09 | 47 | 46 | 13.6 |
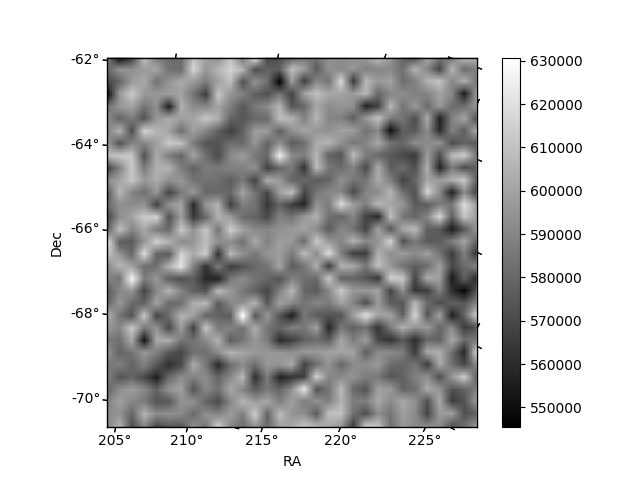
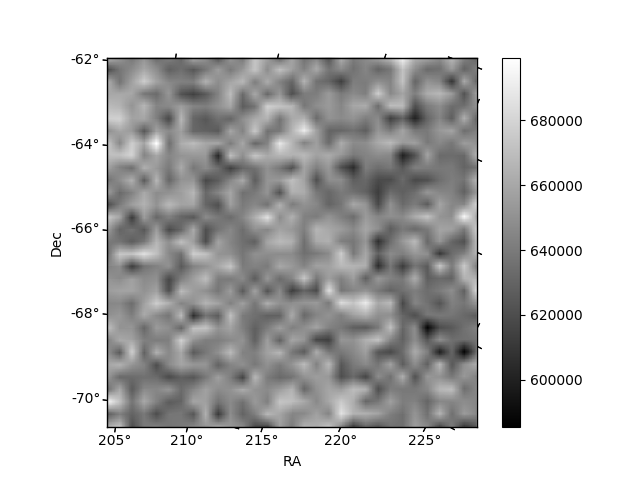
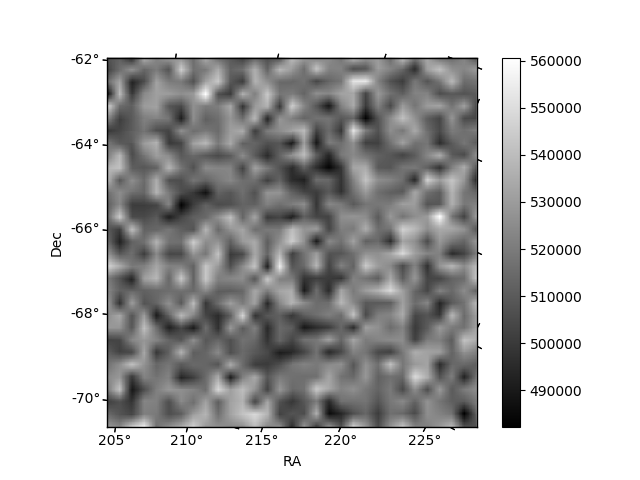
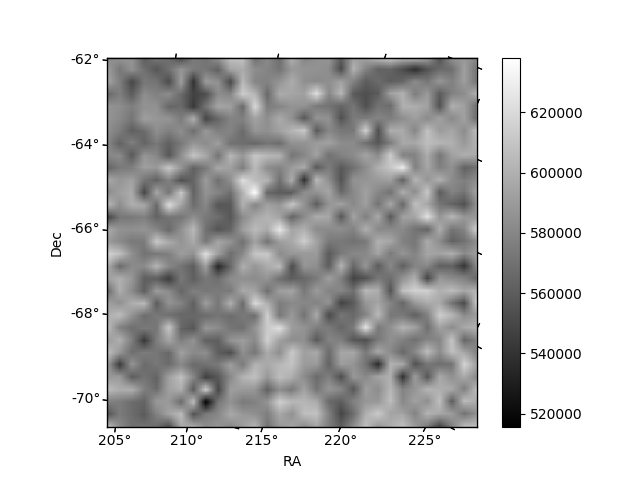
Histogram calculated using DETX and DETY for each event in the final _common_clean file
| Quadrant A | 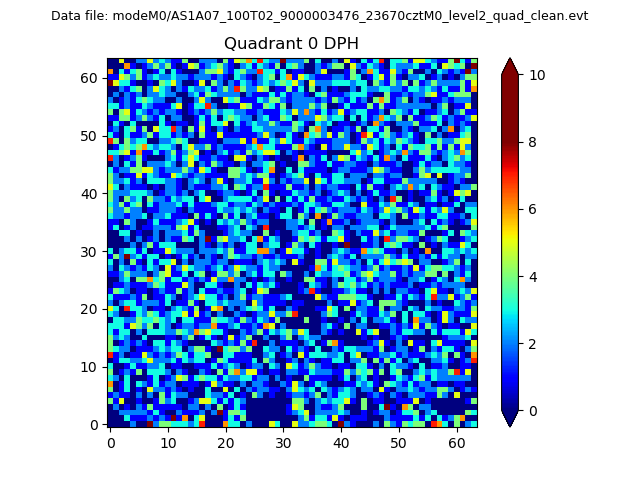 |
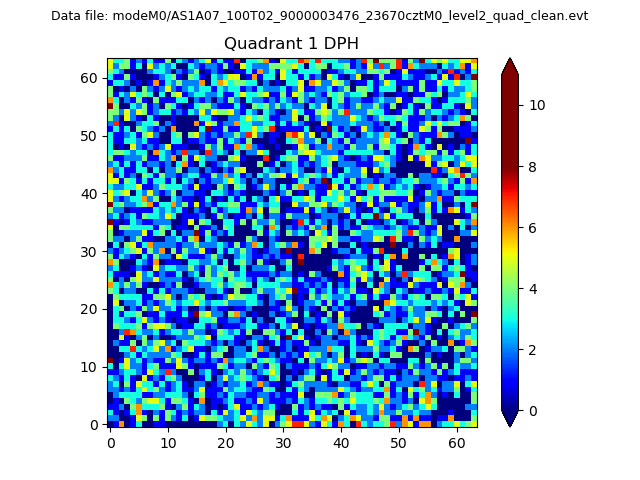 |
Quadrant B |
|---|---|---|---|
| Quadrant D | 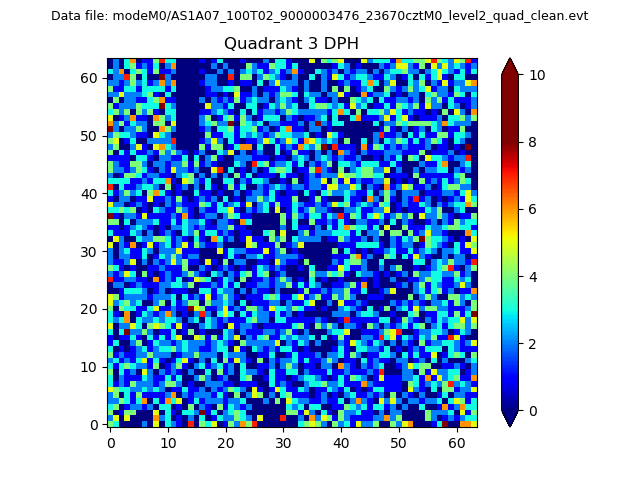 |
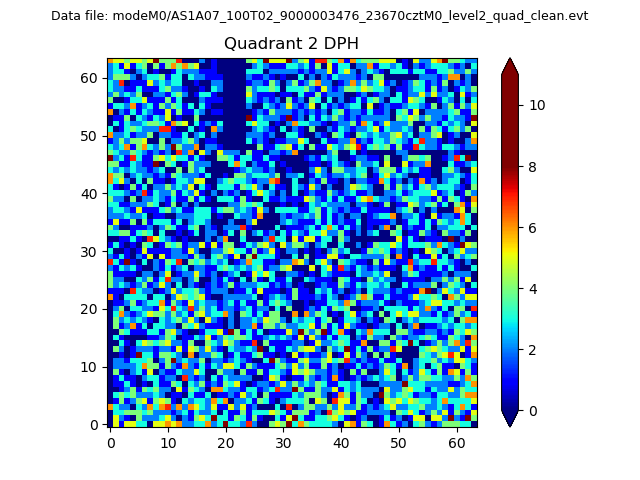 |
Quadrant C |
| Plot type | Count rate plots | Images |
|---|---|---|
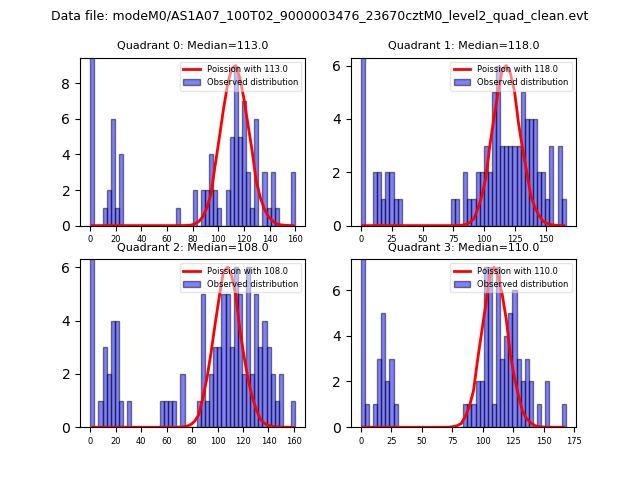
| Comparison with Poisson distribution Blue bars denote a histogram of data divided into 1 sec bins. Red curve is a Poisson curve with rate = median count rate of data. |
 |
 |
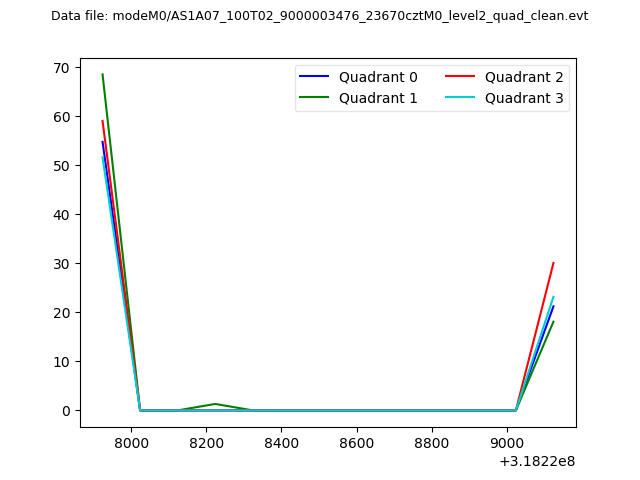
| Quadrant-wise count rates Data is divided into 100 sec bins |
 |
|
| Module-wise count rates for Quadrant A Data is divided into 100 sec bins |
 |
 |
| Module-wise count rates for Quadrant B Data is divided into 100 sec bins |
 |
 |
| Module-wise count rates for Quadrant C Data is divided into 100 sec bins |
 |
 |
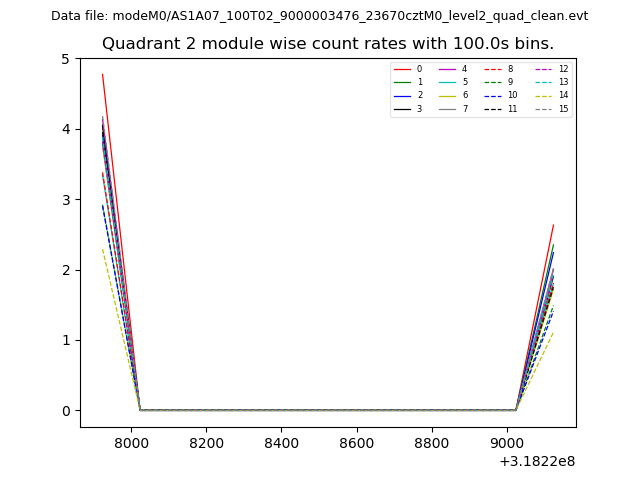
| Module-wise count rates for Quadrant D Data is divided into 100 sec bins |
 |
 |
| Parameter | Plot |
|---|---|
| CZT HV Monitor | 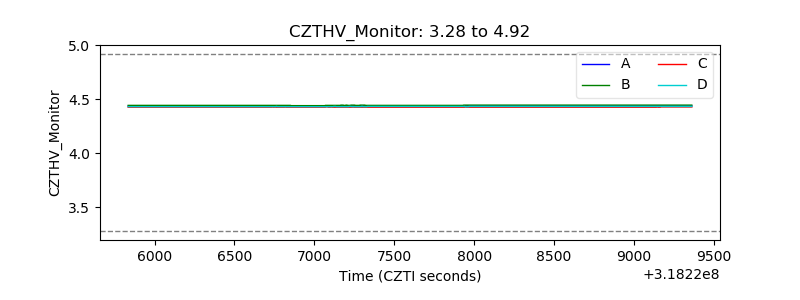 |
| D_VDD | 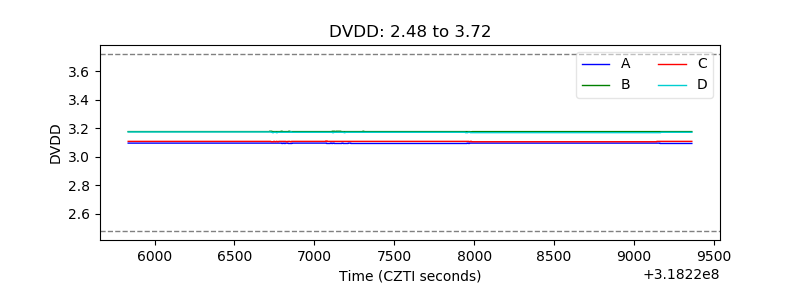 |
| Temperature 1 | 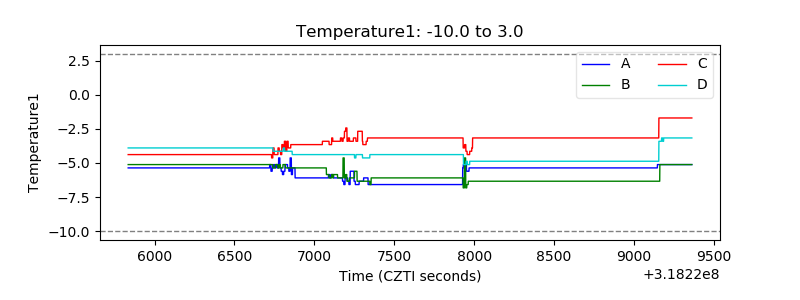 |
| Veto HV Monitor |  |
| Veto LLD | 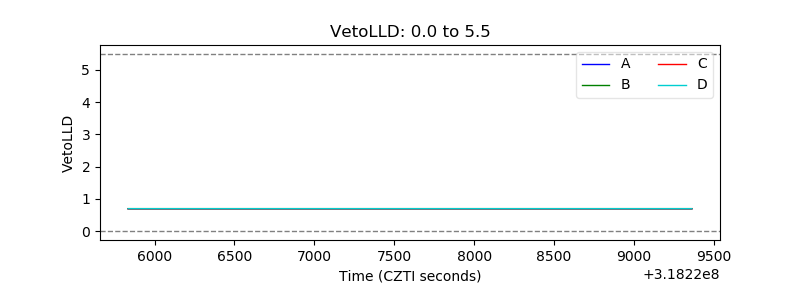 |
| Alpha Counter | 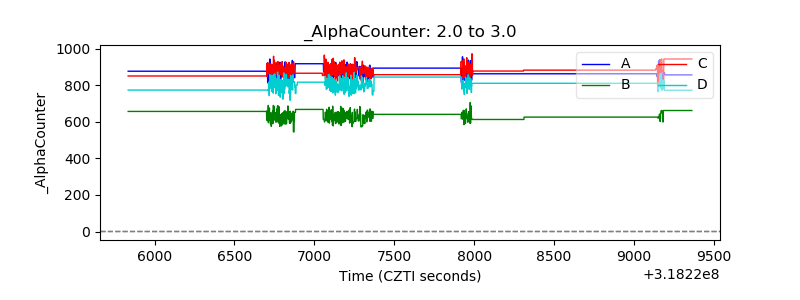 |
| _CPM_Rate | 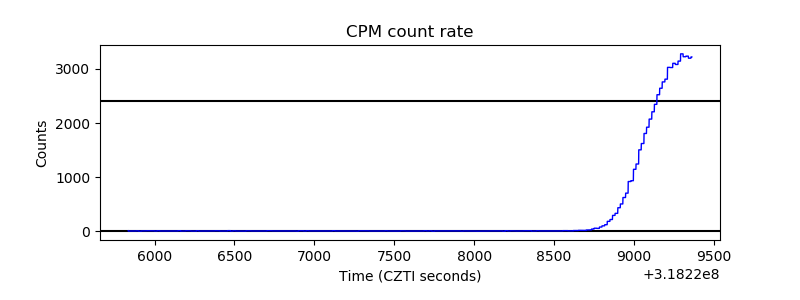 |
| CZT Counter |  |
| +2.5 Volts monitor | 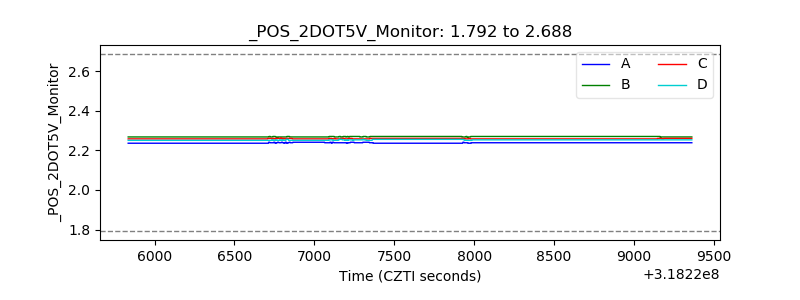 |
| +5 Volts monitor |  |
| _ROLL_ROT | 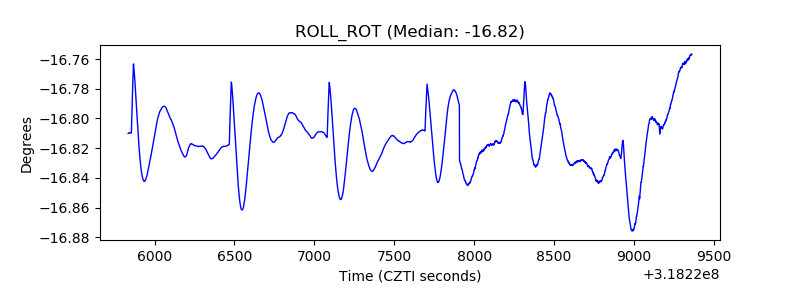 |
| _Roll_DEC | 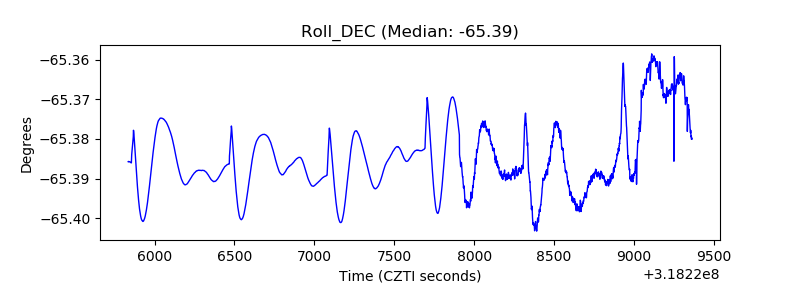 |
| _Roll_RA |  |
| Veto Counter |  |