| Param | Original file | Final file |
|---|---|---|
| Filename | modeM0/AS1A07_112T01_9000003478cztM0_level2.fits | modeM0/AS1A07_112T01_9000003478cztM0_level2_quad_clean.evt |
| Size (bytes) | 199,186,560 | 193,032,000 |
| Size | 190.0 MB | 184.1 MB |
| Events in quadrant A | 1,243,104 | 1,161,626 |
| Events in quadrant B | 1,181,422 | 1,178,789 |
| Events in quadrant C | 1,197,342 | 1,113,797 |
| Events in quadrant D | 1,041,535 | 1,022,297 |
| Mode SS | |||
|---|---|---|---|
| Quadrant | BADHDUFLAG | Total packets | Discarded packets |
| A | 0 | 406 | 0 |
| B | 0 | 406 | 0 |
| C | 0 | 406 | 0 |
| D | 0 | 406 | 0 |
| Mode M0 | |||
|---|---|---|---|
| Quadrant | BADHDUFLAG | Total packets | Discarded packets |
| A | 0 | 41347 | 0 |
| B | 0 | 44763 | 0 |
| C | 0 | 41310 | 0 |
| D | 0 | 49862 | 0 |
| Mode M9 | |||
|---|---|---|---|
| Quadrant | BADHDUFLAG | Total packets | Discarded packets |
| A | 0 | 101 | 0 |
| B | 0 | 101 | 0 |
| C | 0 | 100 | 0 |
| D | 0 | 100 | 0 |
| Quadrant | Total seconds | Saturated seconds | Saturation percentage |
|---|---|---|---|
| A | 19881 | 78 | 0.392334% |
| B | 19876 | 312 | 1.569732% |
| C | 19880 | 195 | 0.980885% |
| D | 19881 | 468 | 2.354006% |
Noise dominated data is calculated using 1-second bins in cleaned event files. If a bin has >2000 counts, and if more than 50% of those come from <1% of pixels, then it is considered to be noise-dominated and hence unusable.
| Quadrant | # 1 sec bins | Bins with >0 counts | Bins with >2000 counts | High rate bins dominated by noise | Noise dominated (total time) | Noise dominated (detector-on time) | Marked lightcurve |
|---|---|---|---|---|---|---|---|
| A | 24076 | 19821 | 0 | 0 | 0.00% | 0.00% | 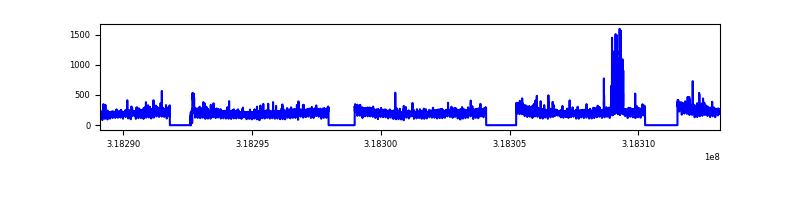 |
| B | 24076 | 19819 | 0 | 0 | 0.00% | 0.00% |  |
| C | 24076 | 19817 | 0 | 0 | 0.00% | 0.00% |  |
| D | 24076 | 19823 | 0 | 0 | 0.00% | 0.00% | 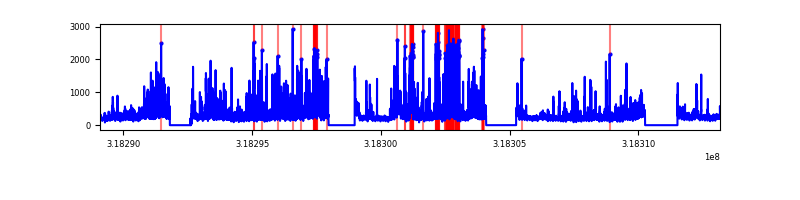 |
Top three noisy pixels from each quadrant. If the there are fewer than three noisy pixels in the level2.evt file, extra rows are filled as -1
| Pixel properties | Quadrant properties | ||||||
|---|---|---|---|---|---|---|---|
| Quadrant | DetID | PixID | Counts | Sigma | Mean | Median | Sigma |
| A | 0 | 29 | 1190 | 10.89 | 323 | 304 | 81.4 |
| A | 9 | 19 | 975 | 8.24 | 323 | 304 | 81.4 |
| A | 7 | 110 | 958 | 8.04 | 323 | 304 | 81.4 |
| B | 2 | 9 | 945 | 10.24 | 312 | 299 | 63.1 |
| B | 5 | 225 | 797 | 7.9 | 312 | 299 | 63.1 |
| B | 2 | 8 | 788 | 7.75 | 312 | 299 | 63.1 |
| C | 1 | 81 | 911 | 7.55 | 316 | 297 | 81.3 |
| C | 1 | 80 | 881 | 7.19 | 316 | 297 | 81.3 |
| C | 12 | 241 | 847 | 6.77 | 316 | 297 | 81.3 |
| D | 7 | 3 | 770 | 6.16 | 298 | 271 | 81.0 |
| D | 15 | 46 | 749 | 5.9 | 298 | 271 | 81.0 |
| D | 10 | 189 | 742 | 5.82 | 298 | 271 | 81.0 |
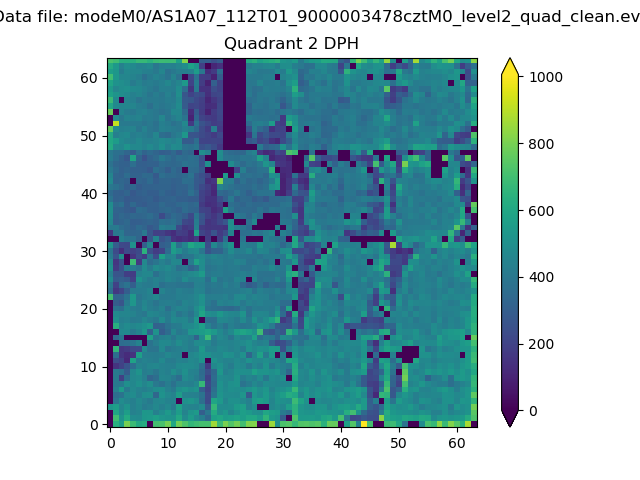
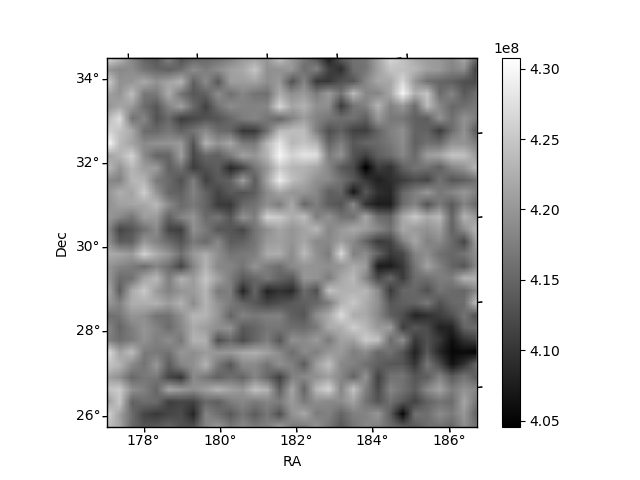
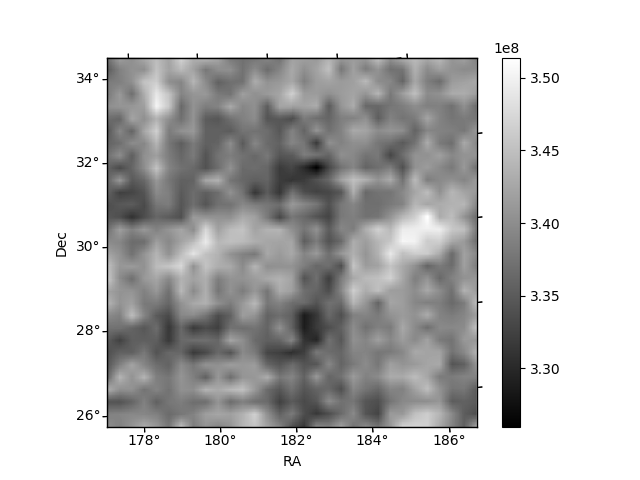
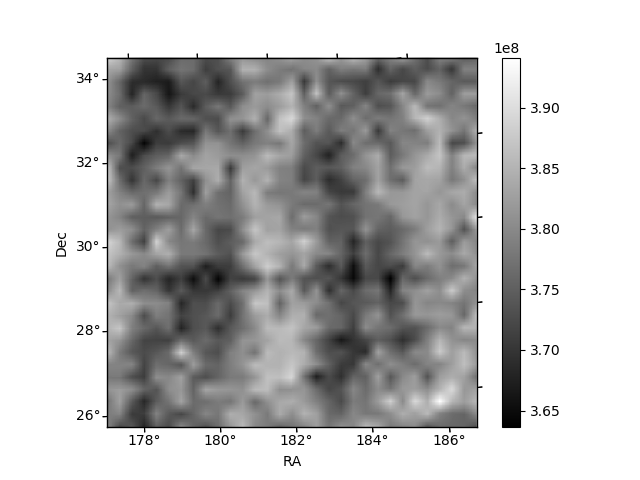
Histogram calculated using DETX and DETY for each event in the final _common_clean file
| Quadrant A | 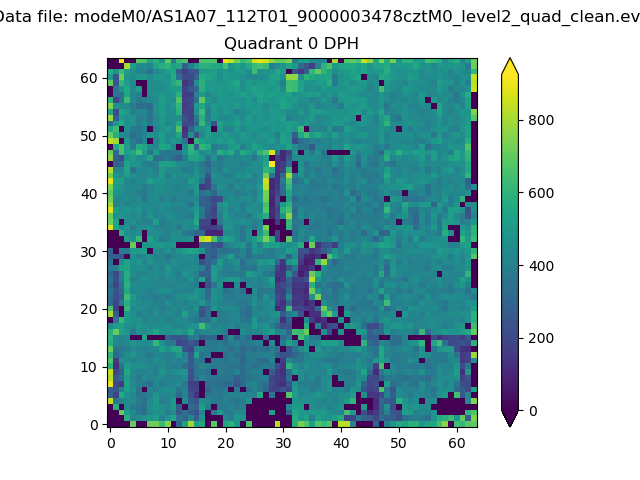 |
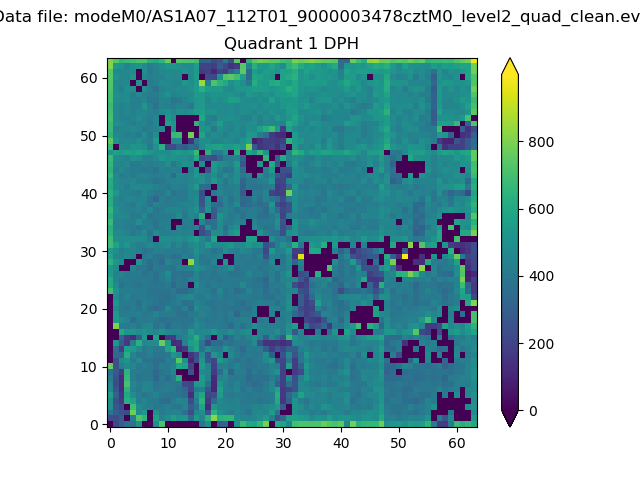 |
Quadrant B |
|---|---|---|---|
| Quadrant D | 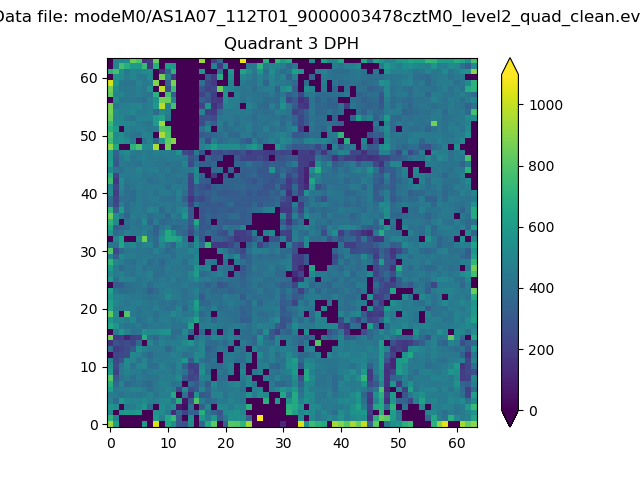 |
 |
Quadrant C |
| Plot type | Count rate plots | Images |
|---|---|---|
| Comparison with Poisson distribution Blue bars denote a histogram of data divided into 1 sec bins. Red curve is a Poisson curve with rate = median count rate of data. |
 |
 |
| Quadrant-wise count rates Data is divided into 100 sec bins |
 |
|
| Module-wise count rates for Quadrant A Data is divided into 100 sec bins |
 |
 |
| Module-wise count rates for Quadrant B Data is divided into 100 sec bins |
 |
 |
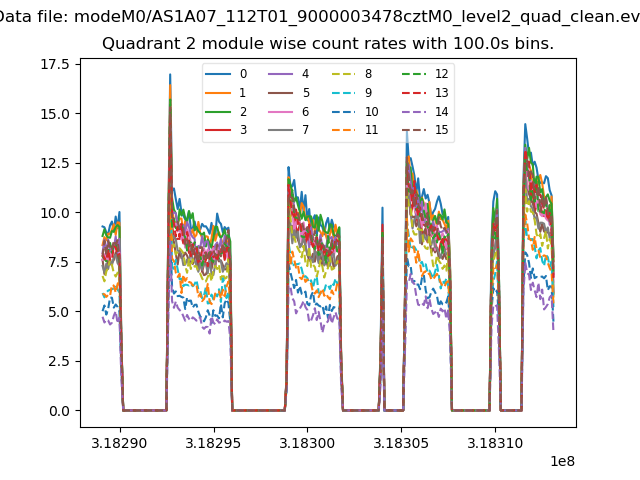
| Module-wise count rates for Quadrant C Data is divided into 100 sec bins |
 |
 |
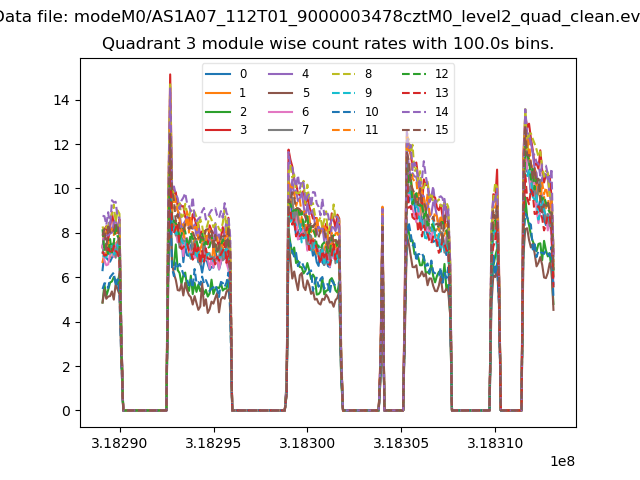
| Module-wise count rates for Quadrant D Data is divided into 100 sec bins |
 |
 |
| Parameter | Plot |
|---|---|
| CZT HV Monitor |  |
| D_VDD | 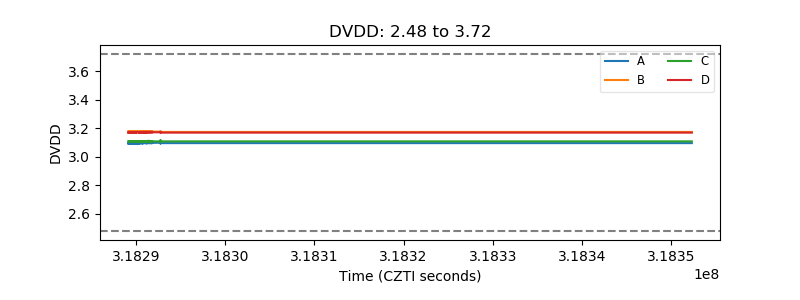 |
| Temperature 1 | 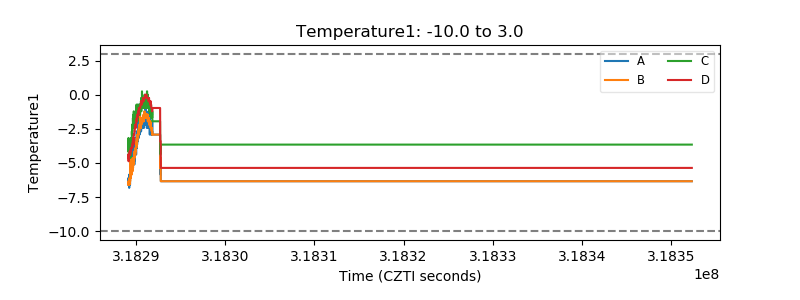 |
| Veto HV Monitor |  |
| Veto LLD | 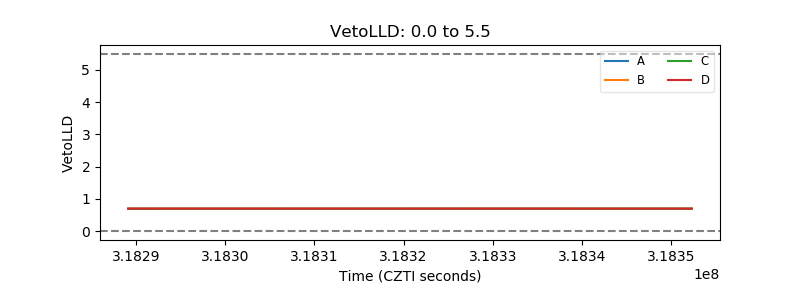 |
| Alpha Counter |  |
| _CPM_Rate |  |
| CZT Counter | 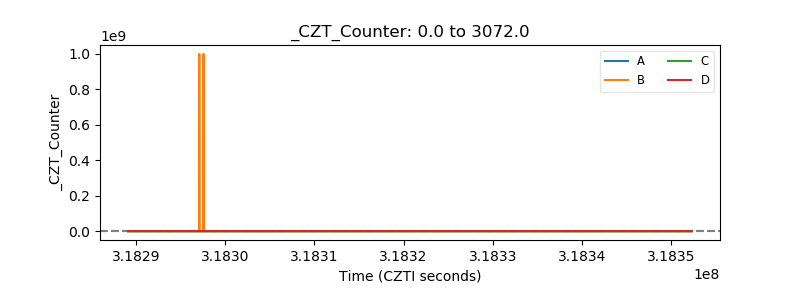 |
| +2.5 Volts monitor | 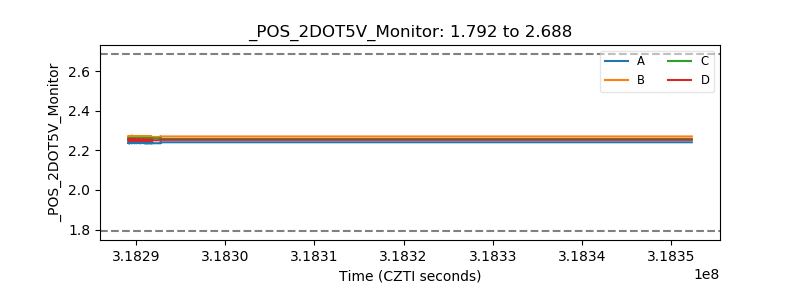 |
| +5 Volts monitor | 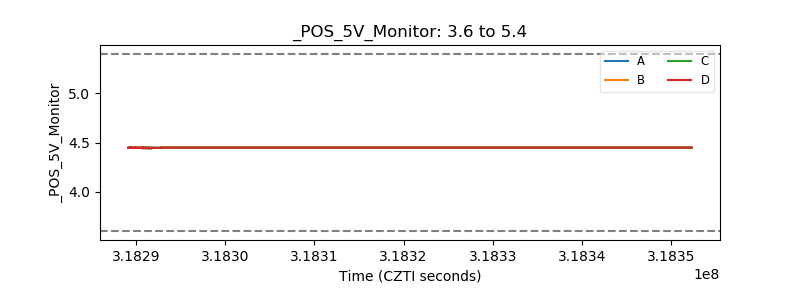 |
| _ROLL_ROT | 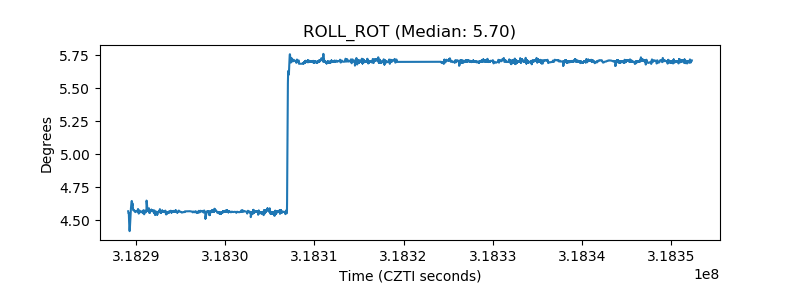 |
| _Roll_DEC | 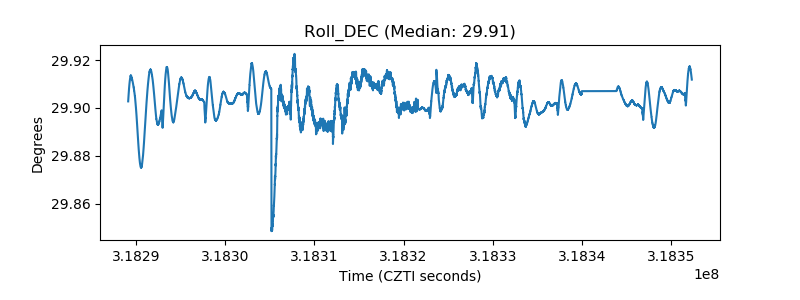 |
| _Roll_RA | 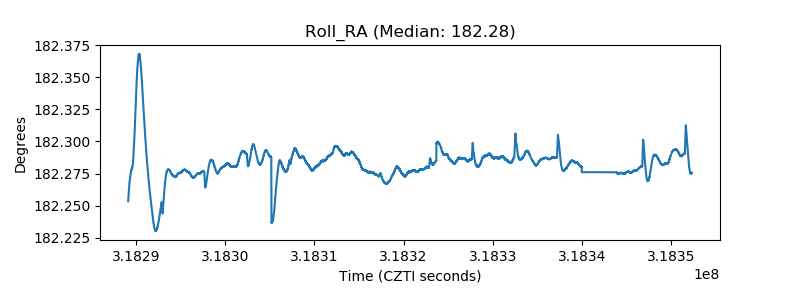 |
| Veto Counter | 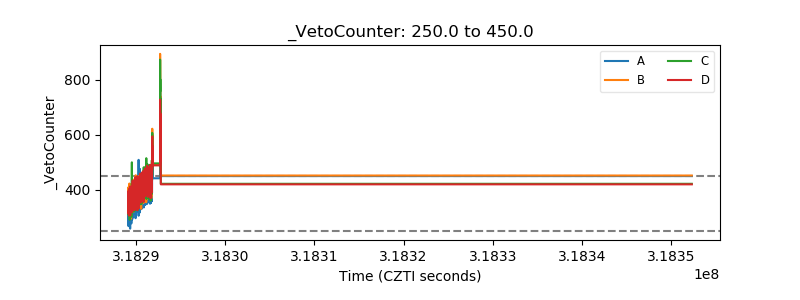 |