| Param | Original file | Final file |
|---|---|---|
| Filename | modeM0/AS1A07_112T01_9000003478_23501cztM0_level2.evt | modeM0/AS1A07_112T01_9000003478_23501cztM0_level2_quad_clean.evt |
| Size (bytes) | 292,962,240 | 49,818,240 |
| Size | 279.4 MB | 47.5 MB |
| Events in quadrant A | 1,952,364 | 308,056 |
| Events in quadrant B | 2,107,300 | 315,352 |
| Events in quadrant C | 1,985,988 | 303,939 |
| Events in quadrant D | 2,549,745 | 294,673 |
| Mode SS | |||
|---|---|---|---|
| Quadrant | BADHDUFLAG | Total packets | Discarded packets |
| A | 0 | 84 | 0 |
| B | 0 | 84 | 0 |
| C | 0 | 84 | 0 |
| D | 0 | 84 | 0 |
| Mode M0 | |||
|---|---|---|---|
| Quadrant | BADHDUFLAG | Total packets | Discarded packets |
| A | 0 | 8363 | 23 |
| B | 0 | 8830 | 15 |
| C | 0 | 8423 | 30 |
| D | 0 | 10363 | 28 |
| Mode M9 | |||
|---|---|---|---|
| Quadrant | BADHDUFLAG | Total packets | Discarded packets |
| A | 0 | 8 | 0 |
| B | 0 | 8 | 0 |
| C | 0 | 8 | 0 |
| D | 0 | 8 | 0 |
| Quadrant | Total seconds | Saturated seconds | Saturation percentage |
|---|---|---|---|
| A | 4055 | 13 | 0.320592% |
| B | 4059 | 26 | 0.640552% |
| C | 4051 | 26 | 0.641817% |
| D | 4056 | 73 | 1.799803% |
Noise dominated data is calculated using 1-second bins in cleaned event files. If a bin has >2000 counts, and if more than 50% of those come from <1% of pixels, then it is considered to be noise-dominated and hence unusable.
| Quadrant | # 1 sec bins | Bins with >0 counts | Bins with >2000 counts | High rate bins dominated by noise | Noise dominated (total time) | Noise dominated (detector-on time) | Marked lightcurve |
|---|---|---|---|---|---|---|---|
| A | 4941 | 4065 | 0 | 0 | 0.00% | 0.00% | 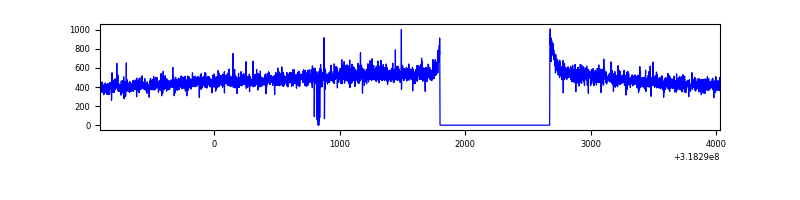 |
| B | 4941 | 4067 | 3 | 3 | 0.06% | 0.07% | 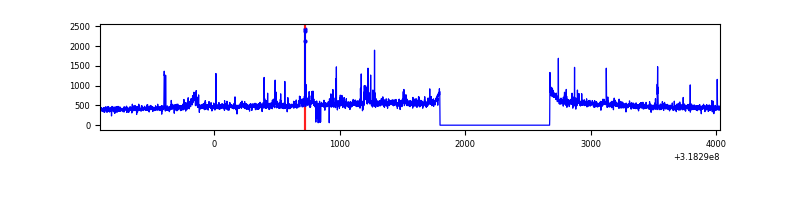 |
| C | 4941 | 4065 | 0 | 0 | 0.00% | 0.00% | 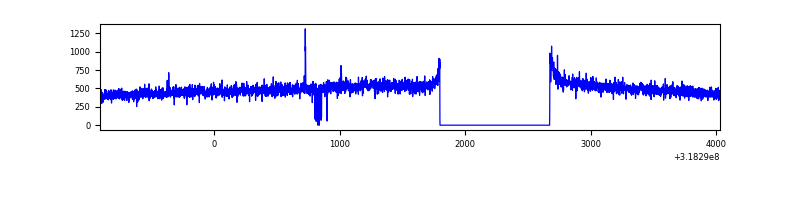 |
| D | 4941 | 4065 | 35 | 35 | 0.71% | 0.86% | 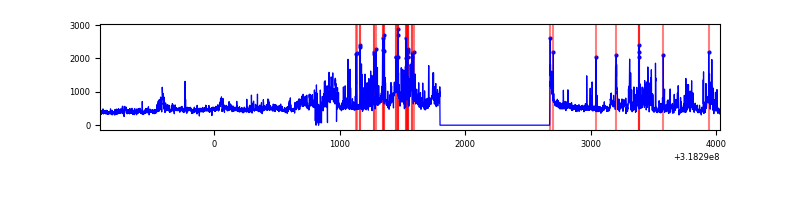 |
Top three noisy pixels from each quadrant. If the there are fewer than three noisy pixels in the level2.evt file, extra rows are filled as -1
| Pixel properties | Quadrant properties | ||||||
|---|---|---|---|---|---|---|---|
| Quadrant | DetID | PixID | Counts | Sigma | Mean | Median | Sigma |
| A | 13 | 254 | 7170 | 64.76 | 506 | 495 | 103.1 |
| A | 0 | 226 | 4333 | 37.24 | 506 | 495 | 103.1 |
| A | 3 | 137 | 4238 | 36.32 | 506 | 495 | 103.1 |
| B | 0 | 189 | 55258 | 560.9 | 502 | 489 | 97.6 |
| B | 0 | 219 | 35182 | 355.3 | 502 | 489 | 97.6 |
| B | 0 | 230 | 16518 | 164.16 | 502 | 489 | 97.6 |
| C | 14 | 238 | 76123 | 657.8 | 484 | 487 | 115.0 |
| C | 7 | 247 | 6634 | 53.46 | 484 | 487 | 115.0 |
| C | 2 | 16 | 4931 | 38.65 | 484 | 487 | 115.0 |
| D | 1 | 52 | 491906 | 4067.18 | 488 | 472 | 120.8 |
| D | 9 | 85 | 118937 | 980.43 | 488 | 472 | 120.8 |
| D | 12 | 233 | 42424 | 347.2 | 488 | 472 | 120.8 |
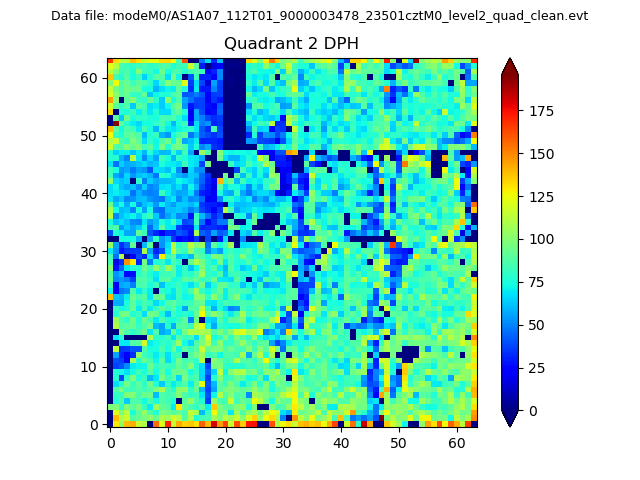
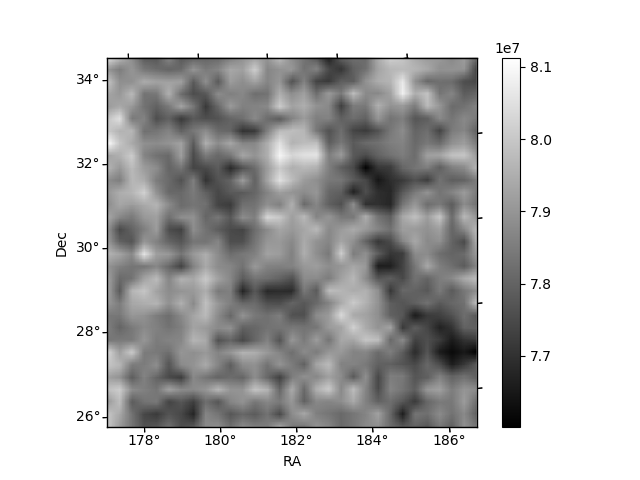
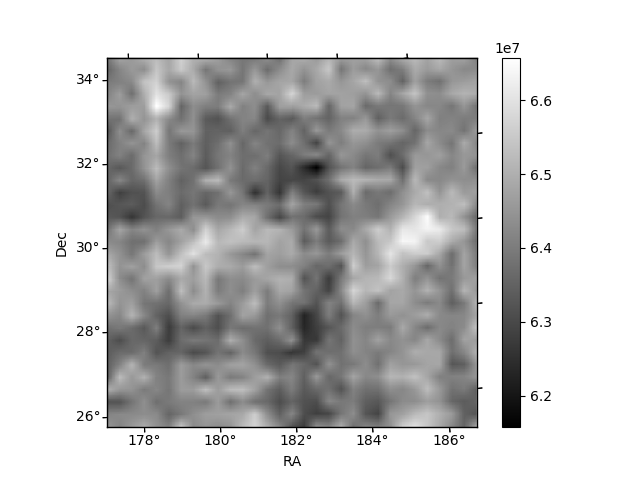
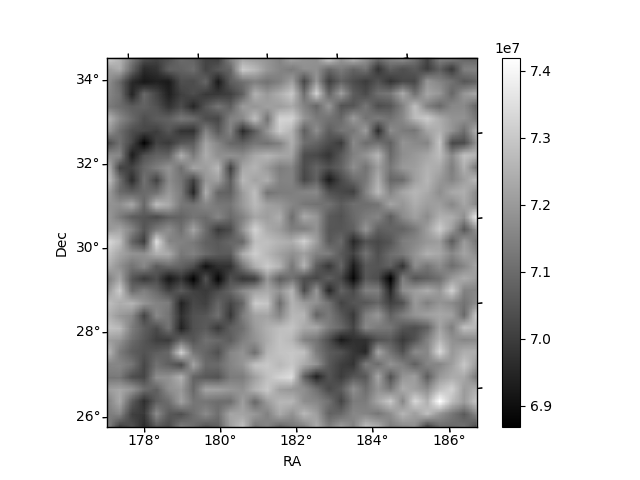
Histogram calculated using DETX and DETY for each event in the final _common_clean file
| Quadrant A | 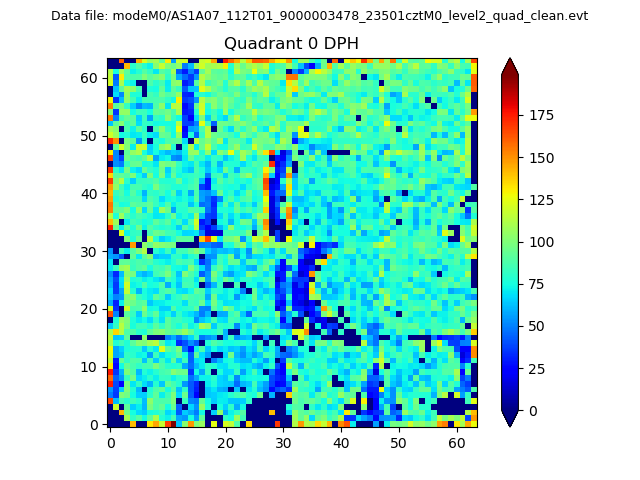 |
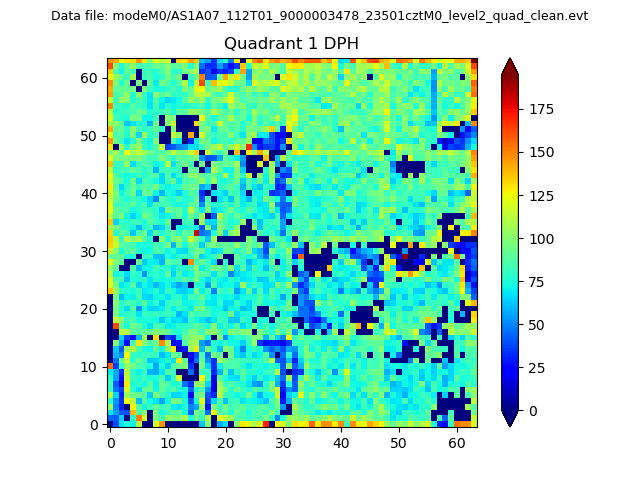 |
Quadrant B |
|---|---|---|---|
| Quadrant D | 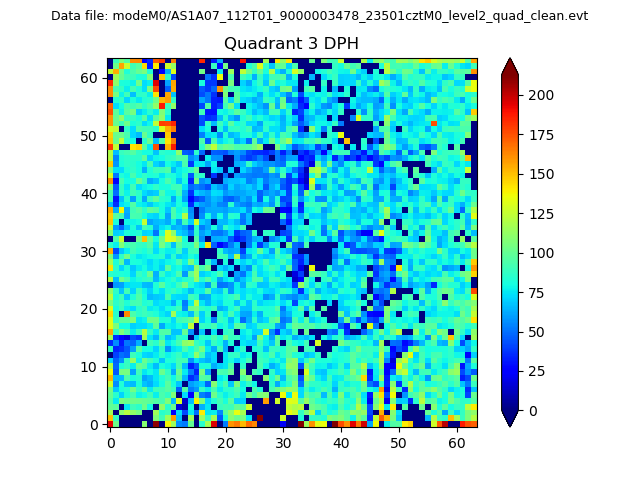 |
 |
Quadrant C |
| Plot type | Count rate plots | Images |
|---|---|---|
| Comparison with Poisson distribution Blue bars denote a histogram of data divided into 1 sec bins. Red curve is a Poisson curve with rate = median count rate of data. |
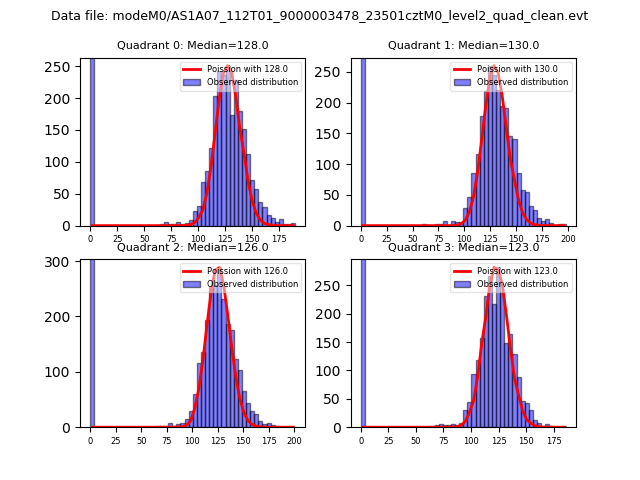 |
 |
| Quadrant-wise count rates Data is divided into 100 sec bins |
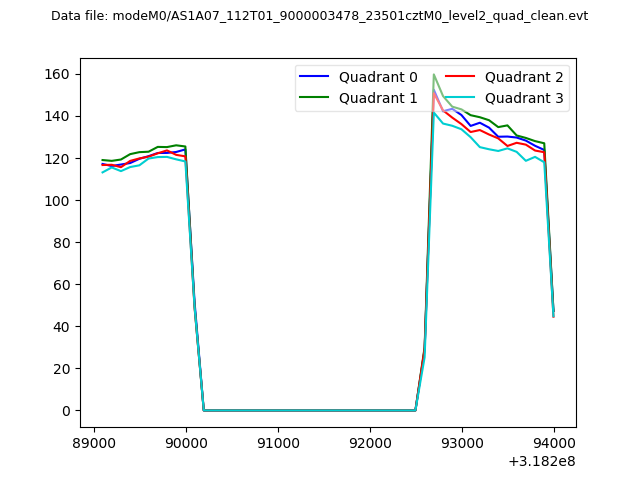 |
|
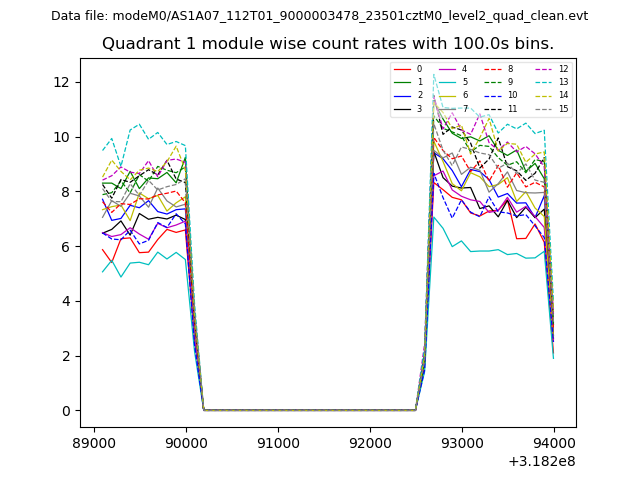
| Module-wise count rates for Quadrant A Data is divided into 100 sec bins |
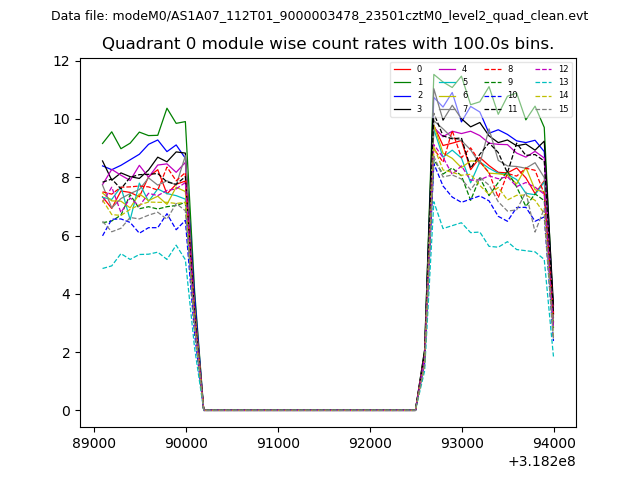 |
 |
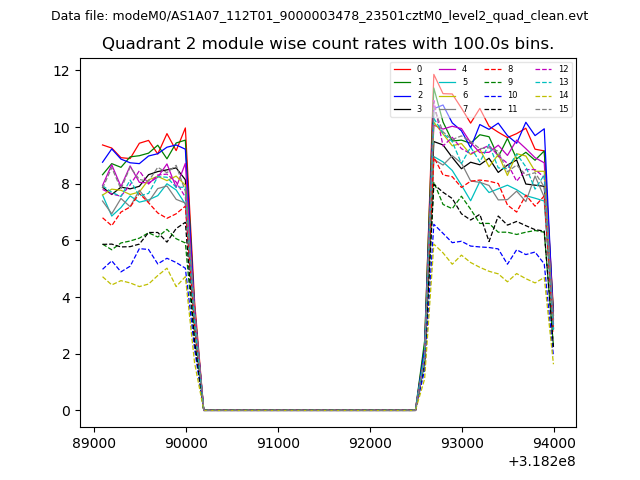
| Module-wise count rates for Quadrant B Data is divided into 100 sec bins |
 |
 |
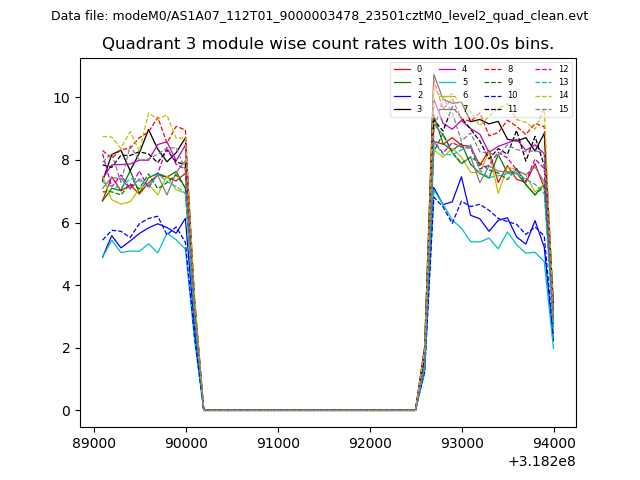
| Module-wise count rates for Quadrant C Data is divided into 100 sec bins |
 |
 |
| Module-wise count rates for Quadrant D Data is divided into 100 sec bins |
 |
 |
| Parameter | Plot |
|---|---|
| CZT HV Monitor | 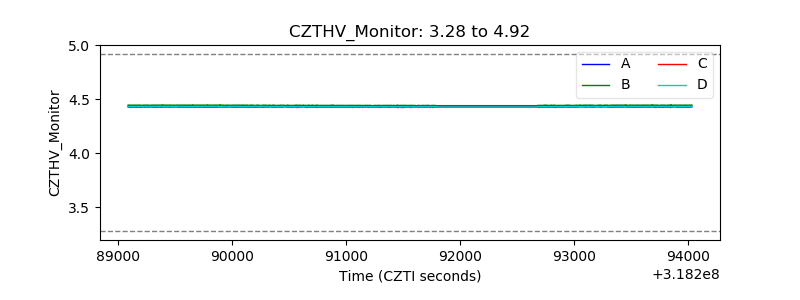 |
| D_VDD | 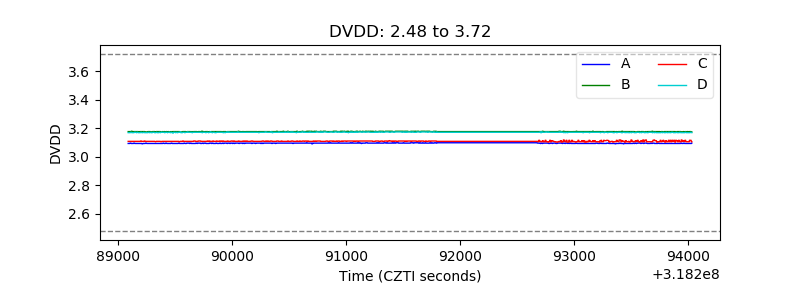 |
| Temperature 1 | 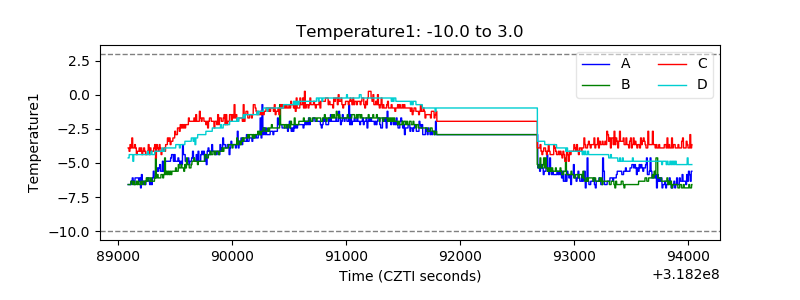 |
| Veto HV Monitor | 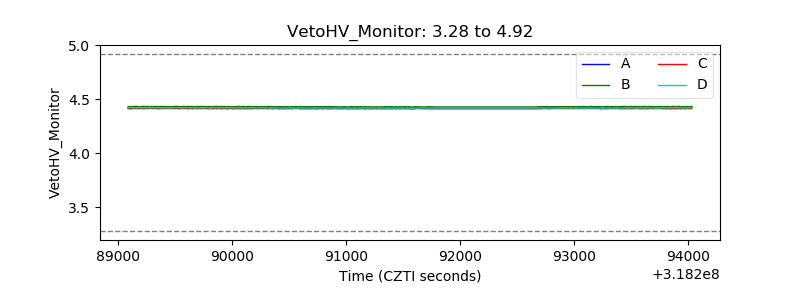 |
| Veto LLD | 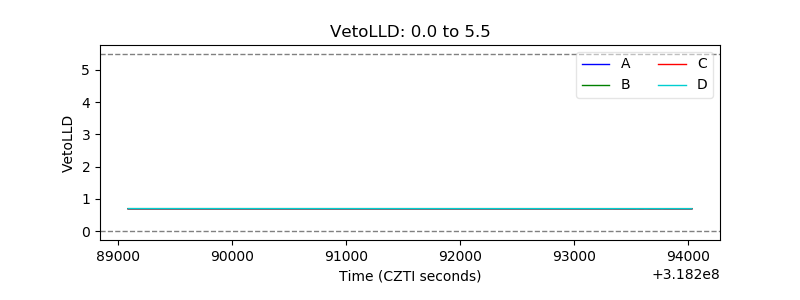 |
| Alpha Counter | 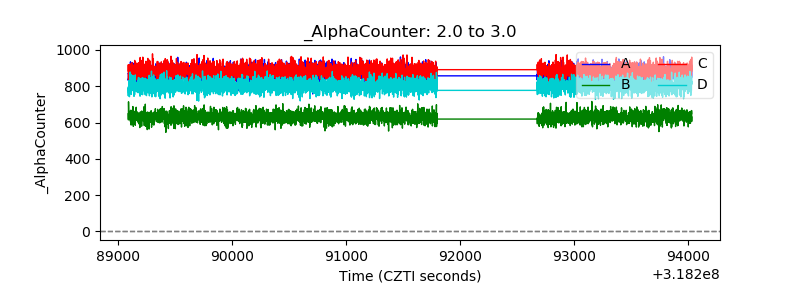 |
| _CPM_Rate | 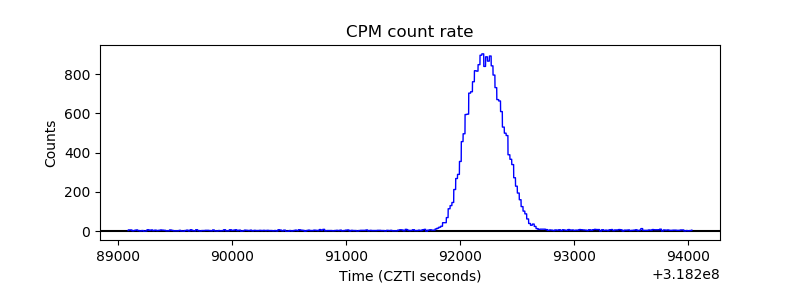 |
| CZT Counter | 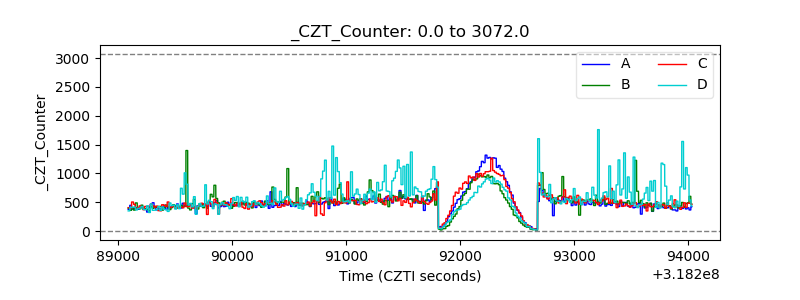 |
| +2.5 Volts monitor |  |
| +5 Volts monitor |  |
| _ROLL_ROT | 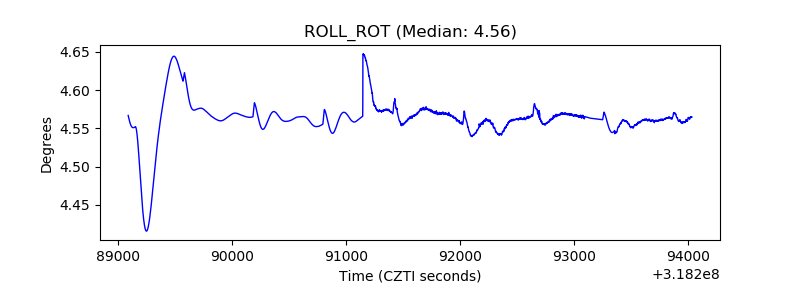 |
| _Roll_DEC | 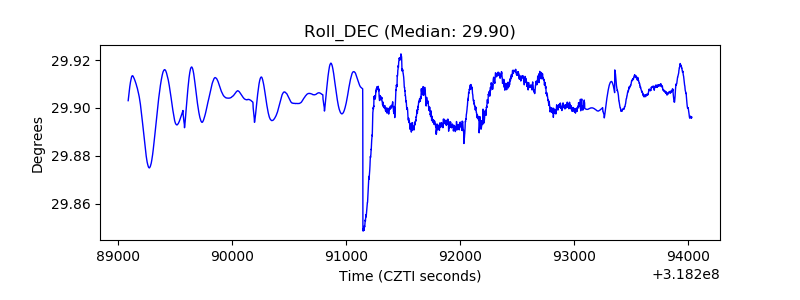 |
| _Roll_RA |  |
| Veto Counter | 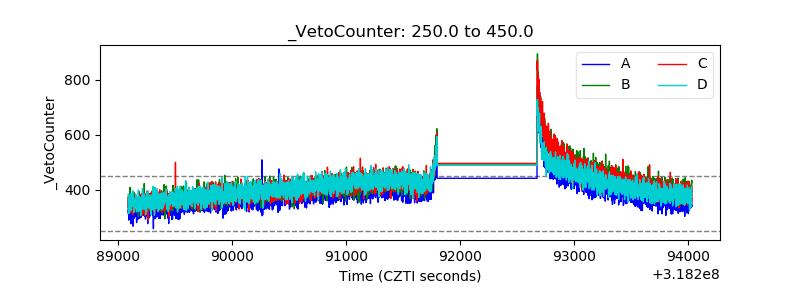 |