| Param | Original file | Final file |
|---|---|---|
| Filename | modeM0/AS1A07_112T01_9000003478_23502cztM0_level2.evt | modeM0/AS1A07_112T01_9000003478_23502cztM0_level2_quad_clean.evt |
| Size (bytes) | 370,690,560 | 66,758,400 |
| Size | 353.5 MB | 63.7 MB |
| Events in quadrant A | 2,521,833 | 417,282 |
| Events in quadrant B | 2,654,590 | 423,401 |
| Events in quadrant C | 2,561,467 | 409,791 |
| Events in quadrant D | 3,123,587 | 396,474 |
| Mode SS | |||
|---|---|---|---|
| Quadrant | BADHDUFLAG | Total packets | Discarded packets |
| A | 0 | 158 | 50 |
| B | 0 | 156 | 42 |
| C | 0 | 160 | 50 |
| D | 0 | 156 | 42 |
| Mode M0 | |||
|---|---|---|---|
| Quadrant | BADHDUFLAG | Total packets | Discarded packets |
| A | 0 | 15534 | 4508 |
| B | 0 | 16726 | 5398 |
| C | 0 | 15590 | 4522 |
| D | 0 | 19755 | 6868 |
| Mode M9 | |||
|---|---|---|---|
| Quadrant | BADHDUFLAG | Total packets | Discarded packets |
| A | 0 | 9 | 1 |
| B | 0 | 10 | 4 |
| C | 0 | 8 | 2 |
| D | 0 | 9 | 2 |
| Quadrant | Total seconds | Saturated seconds | Saturation percentage |
|---|---|---|---|
| A | 5401 | 13 | 0.240696% |
| B | 5302 | 25 | 0.471520% |
| C | 5398 | 28 | 0.518711% |
| D | 5234 | 72 | 1.375621% |
Noise dominated data is calculated using 1-second bins in cleaned event files. If a bin has >2000 counts, and if more than 50% of those come from <1% of pixels, then it is considered to be noise-dominated and hence unusable.
| Quadrant | # 1 sec bins | Bins with >0 counts | Bins with >2000 counts | High rate bins dominated by noise | Noise dominated (total time) | Noise dominated (detector-on time) | Marked lightcurve |
|---|---|---|---|---|---|---|---|
| A | 8518 | 5965 | 0 | 0 | 0.00% | 0.00% | 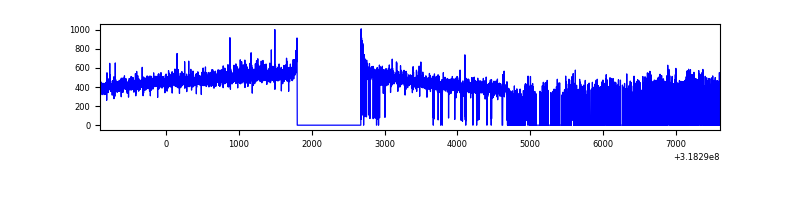 |
| B | 8515 | 5806 | 3 | 3 | 0.04% | 0.05% | 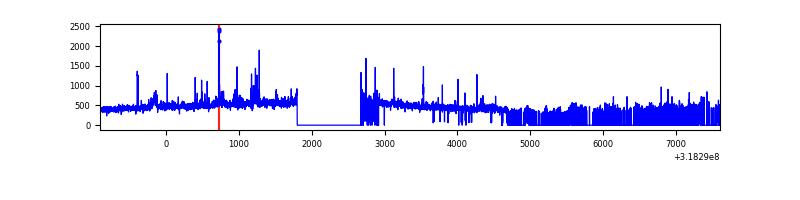 |
| C | 8518 | 5938 | 0 | 0 | 0.00% | 0.00% | 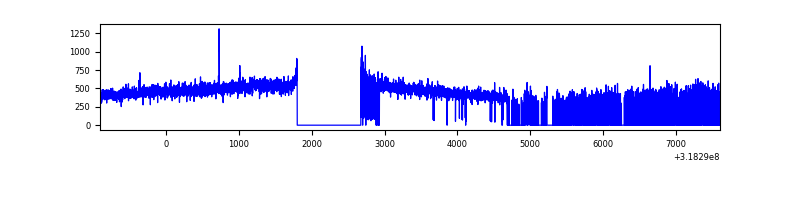 |
| D | 8498 | 5705 | 36 | 36 | 0.42% | 0.63% | 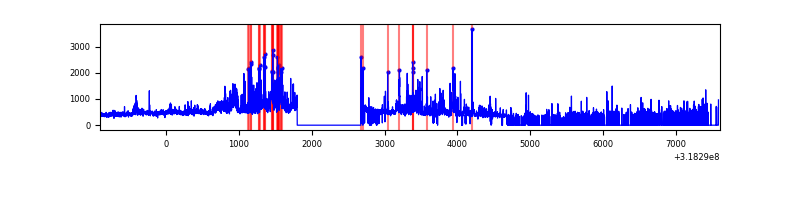 |
Top three noisy pixels from each quadrant. If the there are fewer than three noisy pixels in the level2.evt file, extra rows are filled as -1
| Pixel properties | Quadrant properties | ||||||
|---|---|---|---|---|---|---|---|
| Quadrant | DetID | PixID | Counts | Sigma | Mean | Median | Sigma |
| A | 13 | 254 | 9588 | 67.83 | 653 | 639 | 131.9 |
| A | 0 | 226 | 5599 | 37.59 | 653 | 639 | 131.9 |
| A | 3 | 137 | 5540 | 37.15 | 653 | 639 | 131.9 |
| B | 0 | 189 | 79317 | 646.54 | 635 | 618 | 121.7 |
| B | 0 | 219 | 35860 | 289.52 | 635 | 618 | 121.7 |
| B | 0 | 230 | 17493 | 138.63 | 635 | 618 | 121.7 |
| C | 14 | 238 | 98347 | 665.27 | 624 | 627 | 146.9 |
| C | 7 | 247 | 8931 | 56.53 | 624 | 627 | 146.9 |
| C | 8 | 128 | 6030 | 36.78 | 624 | 627 | 146.9 |
| D | 1 | 52 | 601704 | 4006.87 | 610 | 592 | 150.0 |
| D | 9 | 85 | 121787 | 807.86 | 610 | 592 | 150.0 |
| D | 12 | 233 | 42612 | 280.1 | 610 | 592 | 150.0 |
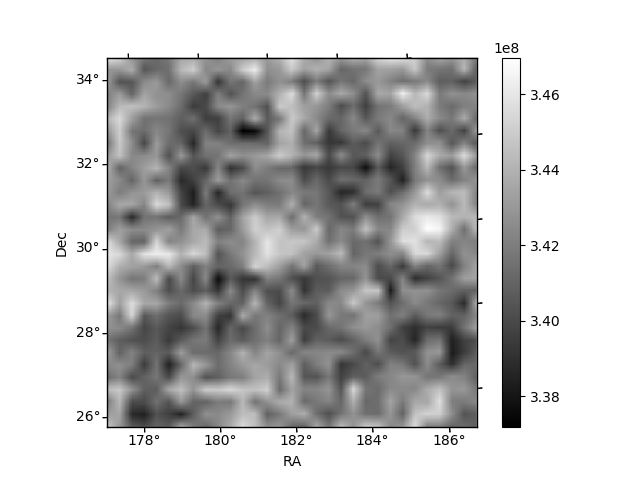
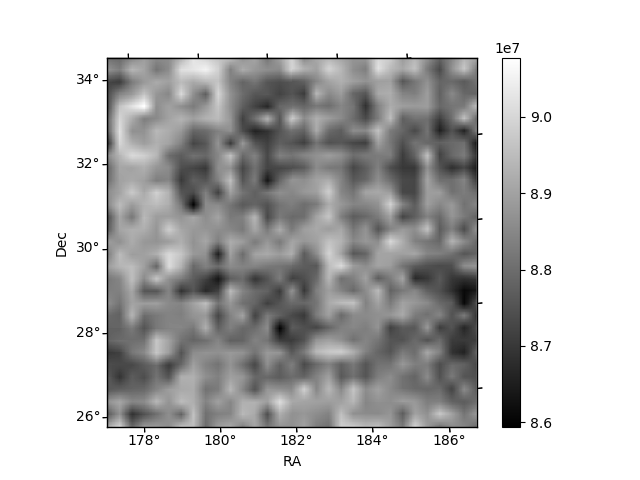
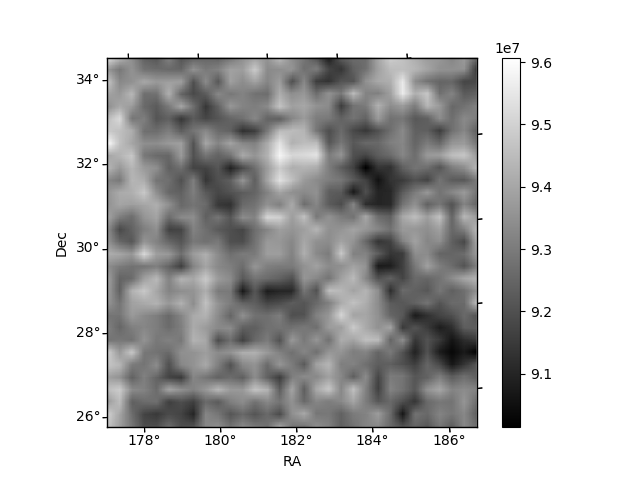
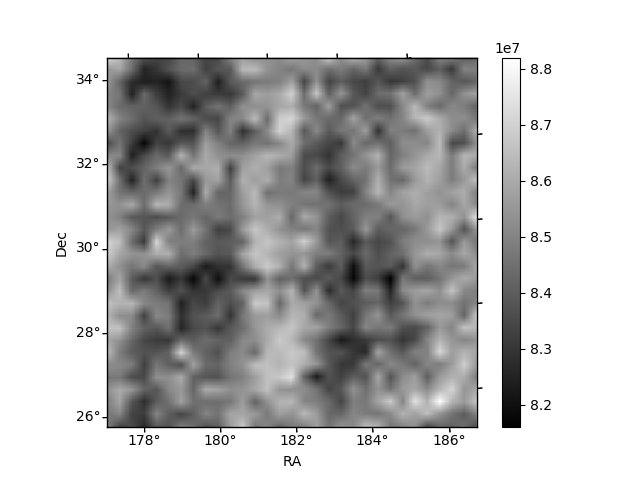
Histogram calculated using DETX and DETY for each event in the final _common_clean file
| Quadrant A | 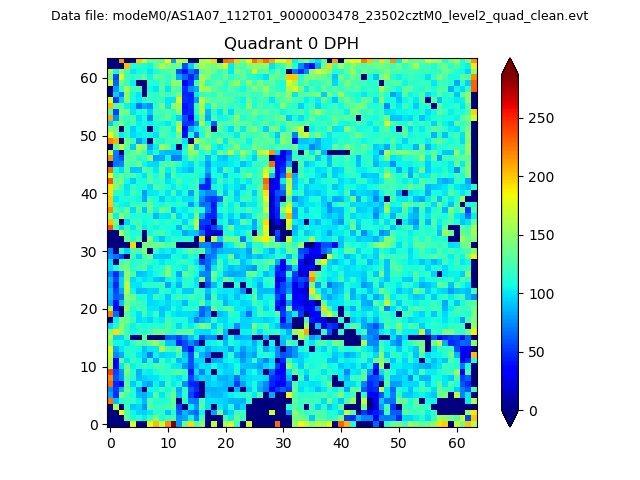 |
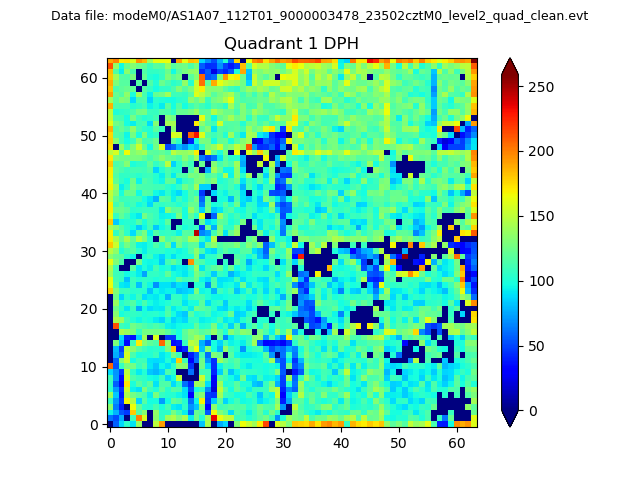 |
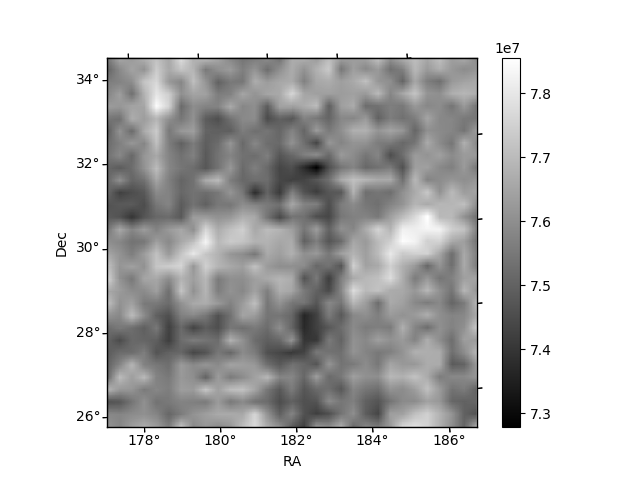
Quadrant B |
|---|---|---|---|
| Quadrant D | 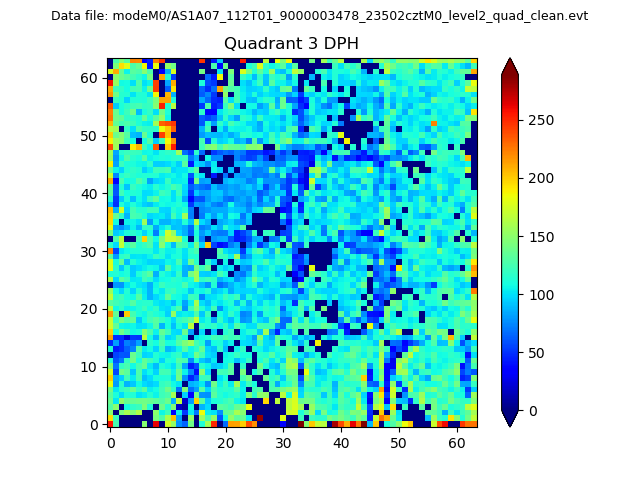 |
 |
Quadrant C |
| Plot type | Count rate plots | Images |
|---|---|---|
| Comparison with Poisson distribution Blue bars denote a histogram of data divided into 1 sec bins. Red curve is a Poisson curve with rate = median count rate of data. |
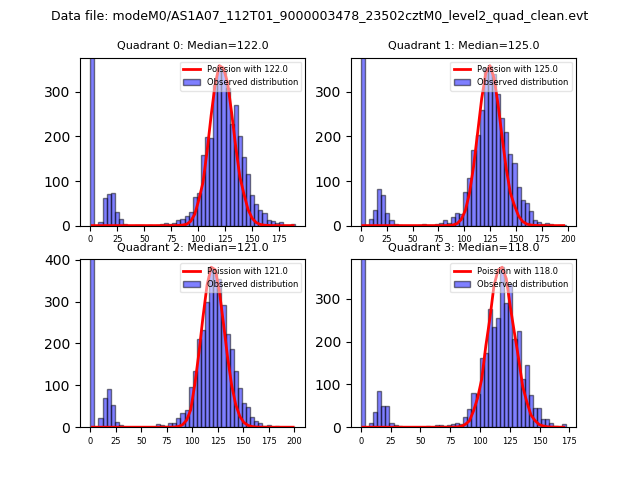 |
 |
| Quadrant-wise count rates Data is divided into 100 sec bins |
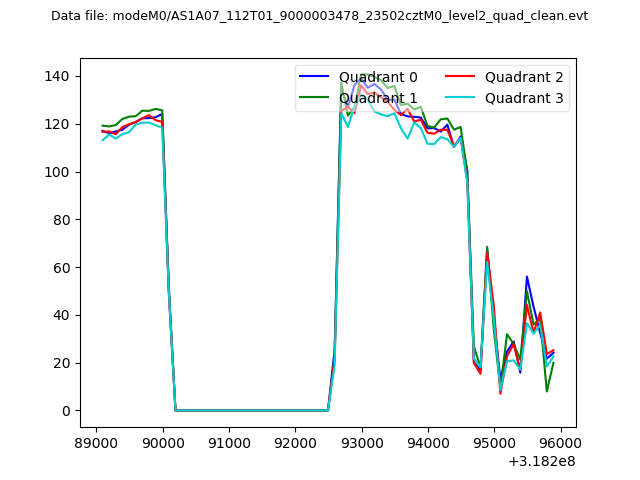 |
|
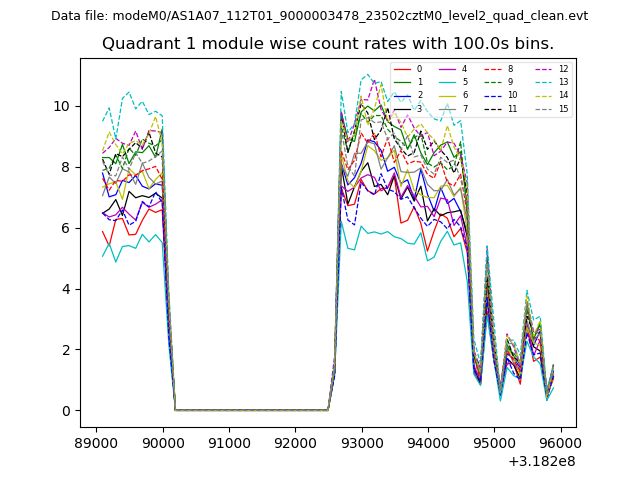
| Module-wise count rates for Quadrant A Data is divided into 100 sec bins |
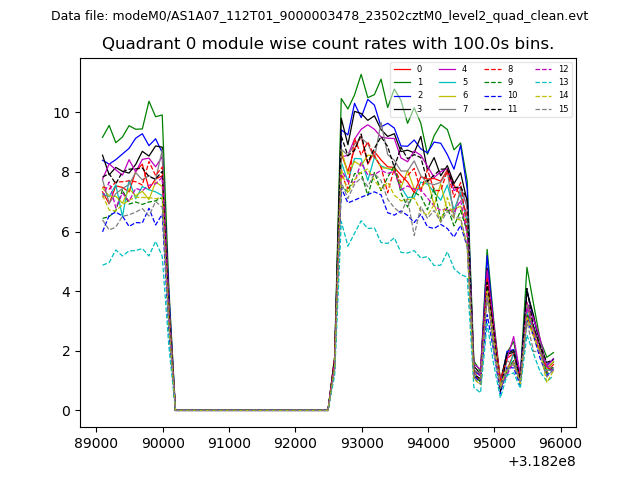 |
 |
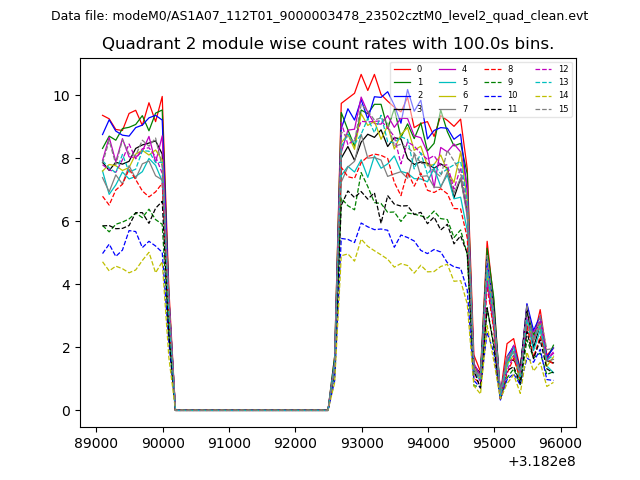
| Module-wise count rates for Quadrant B Data is divided into 100 sec bins |
 |
 |
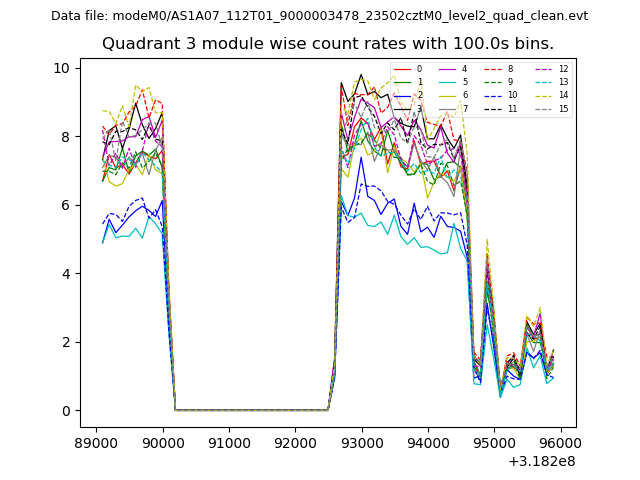
| Module-wise count rates for Quadrant C Data is divided into 100 sec bins |
 |
 |
| Module-wise count rates for Quadrant D Data is divided into 100 sec bins |
 |
 |
| Parameter | Plot |
|---|---|
| CZT HV Monitor | 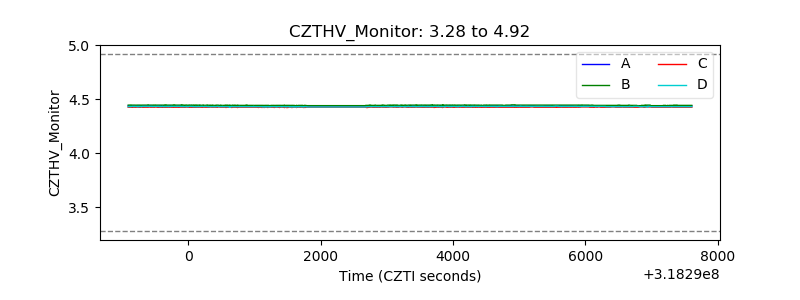 |
| D_VDD | 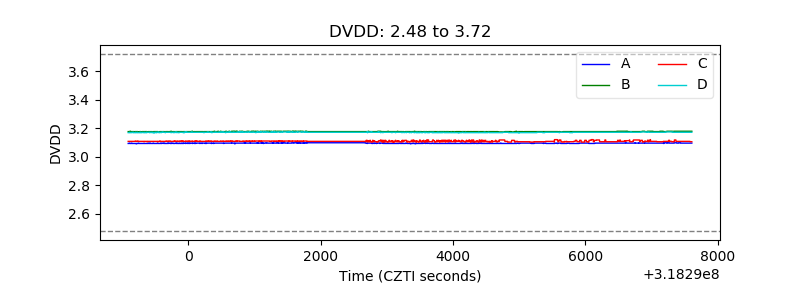 |
| Temperature 1 | 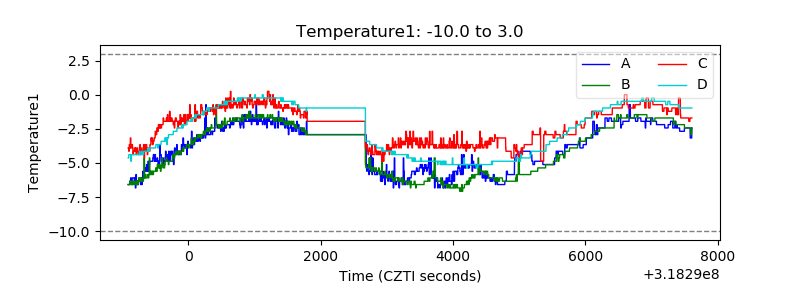 |
| Veto HV Monitor | 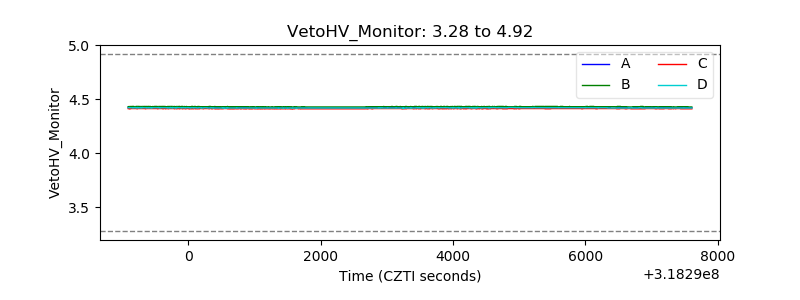 |
| Veto LLD | 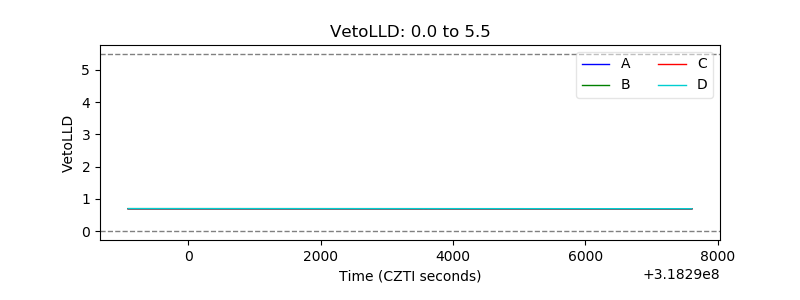 |
| Alpha Counter | 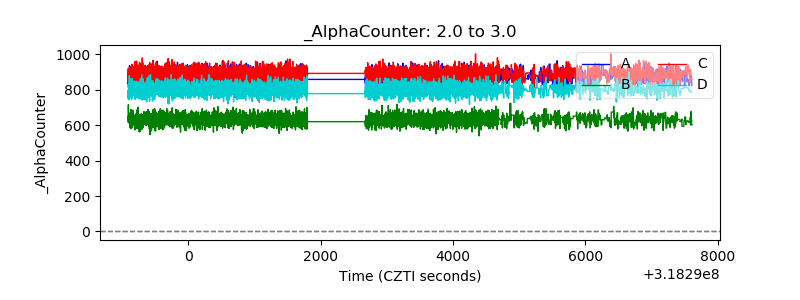 |
| _CPM_Rate | 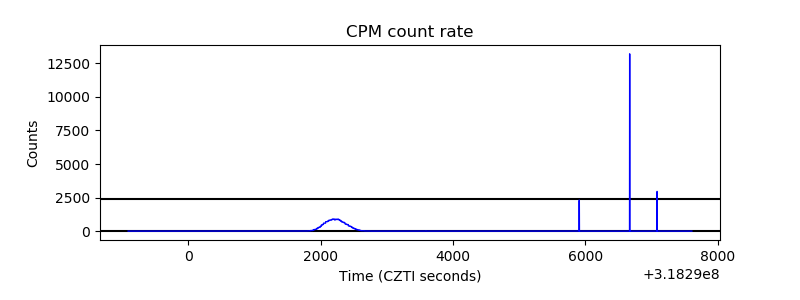 |
| CZT Counter | 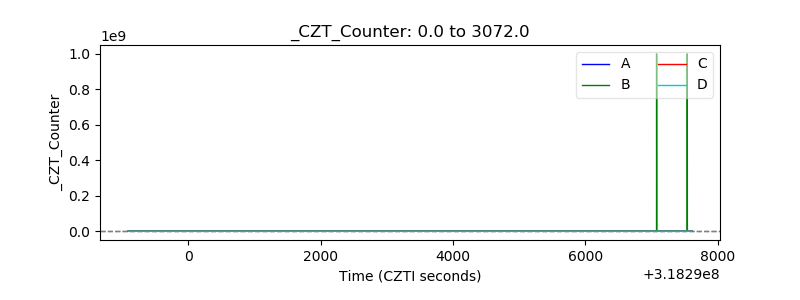 |
| +2.5 Volts monitor |  |
| +5 Volts monitor | 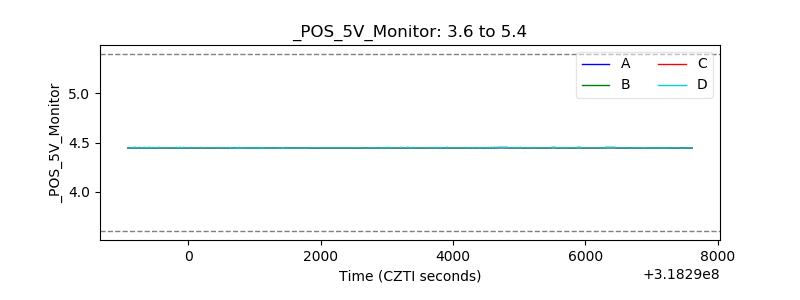 |
| _ROLL_ROT | 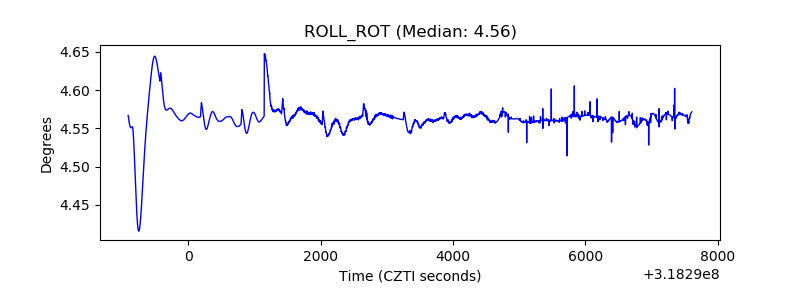 |
| _Roll_DEC | 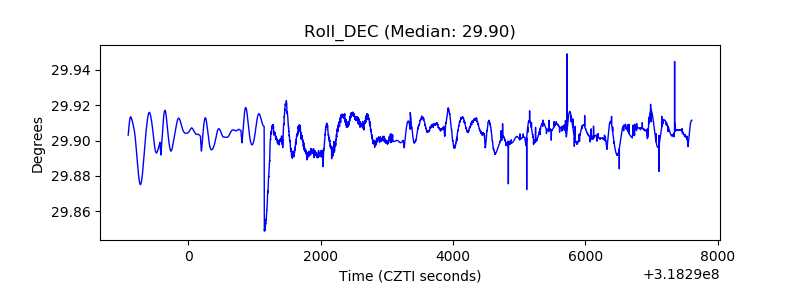 |
| _Roll_RA | 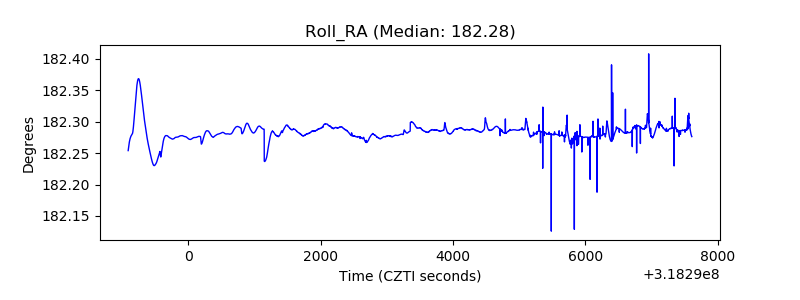 |
| Veto Counter | 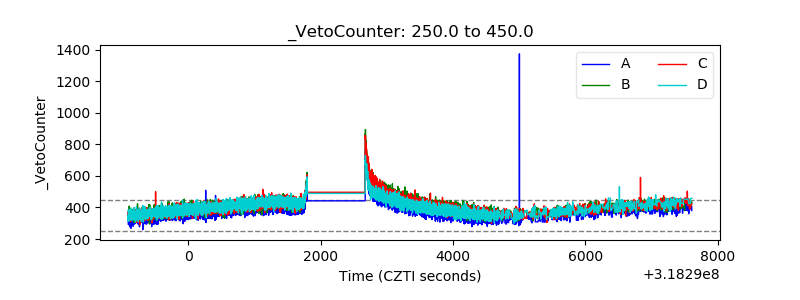 |