| Param | Original file | Final file |
|---|---|---|
| Filename | modeM0/AS1A07_112T01_9000003478_23504cztM0_level2.evt | modeM0/AS1A07_112T01_9000003478_23504cztM0_level2_quad_clean.evt |
| Size (bytes) | 473,411,520 | 92,833,920 |
| Size | 451.5 MB | 88.5 MB |
| Events in quadrant A | 3,059,103 | 598,134 |
| Events in quadrant B | 3,481,393 | 614,216 |
| Events in quadrant C | 3,155,817 | 586,233 |
| Events in quadrant D | 4,206,036 | 565,972 |
| Mode SS | |||
|---|---|---|---|
| Quadrant | BADHDUFLAG | Total packets | Discarded packets |
| A | 0 | 132 | 0 |
| B | 0 | 132 | 0 |
| C | 0 | 132 | 0 |
| D | 0 | 132 | 0 |
| Mode M0 | |||
|---|---|---|---|
| Quadrant | BADHDUFLAG | Total packets | Discarded packets |
| A | 0 | 13174 | 2 |
| B | 0 | 14479 | 2 |
| C | 0 | 13365 | 2 |
| D | 0 | 16840 | 2 |
| Mode M9 | |||
|---|---|---|---|
| Quadrant | BADHDUFLAG | Total packets | Discarded packets |
| A | 0 | 15 | 0 |
| B | 0 | 16 | 0 |
| C | 0 | 16 | 0 |
| D | 0 | 16 | 0 |
| Quadrant | Total seconds | Saturated seconds | Saturation percentage |
|---|---|---|---|
| A | 6398 | 12 | 0.187559% |
| B | 6398 | 25 | 0.390747% |
| C | 6398 | 67 | 1.047202% |
| D | 6398 | 226 | 3.532354% |
Noise dominated data is calculated using 1-second bins in cleaned event files. If a bin has >2000 counts, and if more than 50% of those come from <1% of pixels, then it is considered to be noise-dominated and hence unusable.
| Quadrant | # 1 sec bins | Bins with >0 counts | Bins with >2000 counts | High rate bins dominated by noise | Noise dominated (total time) | Noise dominated (detector-on time) | Marked lightcurve |
|---|---|---|---|---|---|---|---|
| A | 7563 | 6399 | 0 | 0 | 0.00% | 0.00% | 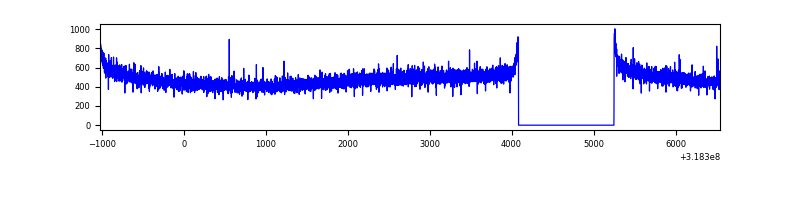 |
| B | 7563 | 6399 | 5 | 5 | 0.07% | 0.08% | 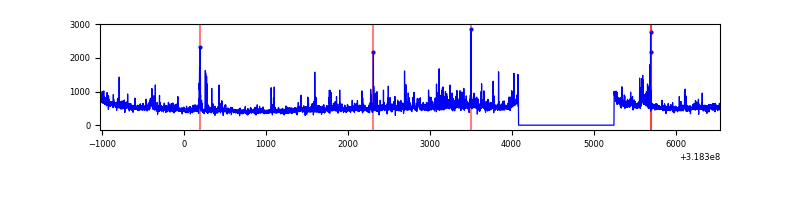 |
| C | 7563 | 6398 | 0 | 0 | 0.00% | 0.00% | 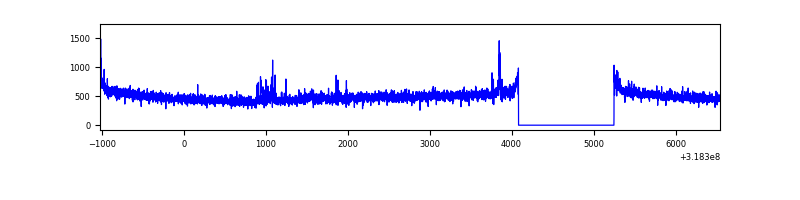 |
| D | 7563 | 6399 | 198 | 198 | 2.62% | 3.09% | 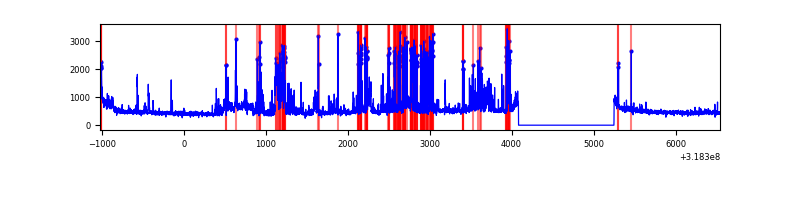 |
Top three noisy pixels from each quadrant. If the there are fewer than three noisy pixels in the level2.evt file, extra rows are filled as -1
| Pixel properties | Quadrant properties | ||||||
|---|---|---|---|---|---|---|---|
| Quadrant | DetID | PixID | Counts | Sigma | Mean | Median | Sigma |
| A | 13 | 254 | 10572 | 61.55 | 793 | 779 | 159.1 |
| A | 0 | 226 | 6880 | 38.35 | 793 | 779 | 159.1 |
| A | 3 | 137 | 6644 | 36.86 | 793 | 779 | 159.1 |
| B | 0 | 219 | 157615 | 1047.94 | 792 | 772 | 149.7 |
| B | 0 | 189 | 100943 | 669.29 | 792 | 772 | 149.7 |
| B | 12 | 17 | 54603 | 359.67 | 792 | 772 | 149.7 |
| C | 14 | 238 | 123081 | 694.79 | 759 | 764 | 176.0 |
| C | 7 | 247 | 62644 | 351.49 | 759 | 764 | 176.0 |
| C | 0 | 10 | 6547 | 32.85 | 759 | 764 | 176.0 |
| D | 1 | 52 | 886715 | 4841.03 | 756 | 736 | 183.0 |
| D | 9 | 35 | 362685 | 1977.71 | 756 | 736 | 183.0 |
| D | 9 | 85 | 63567 | 343.31 | 756 | 736 | 183.0 |
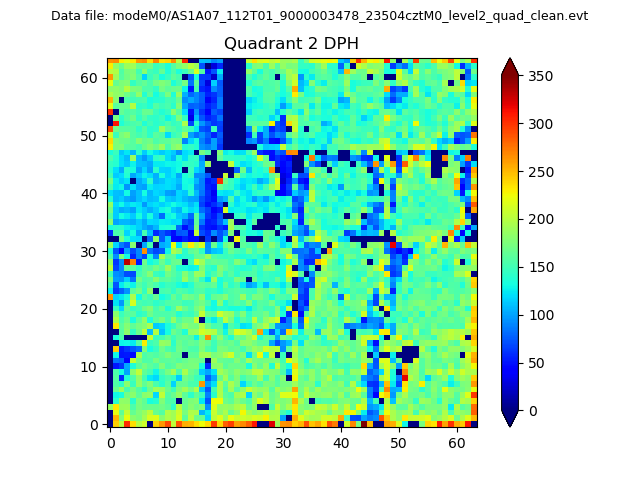
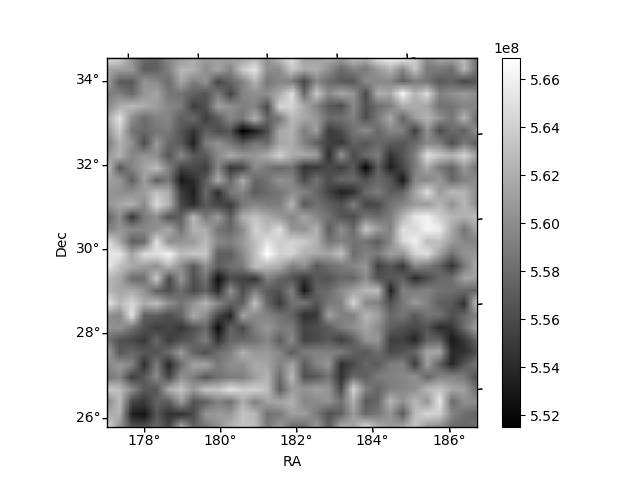
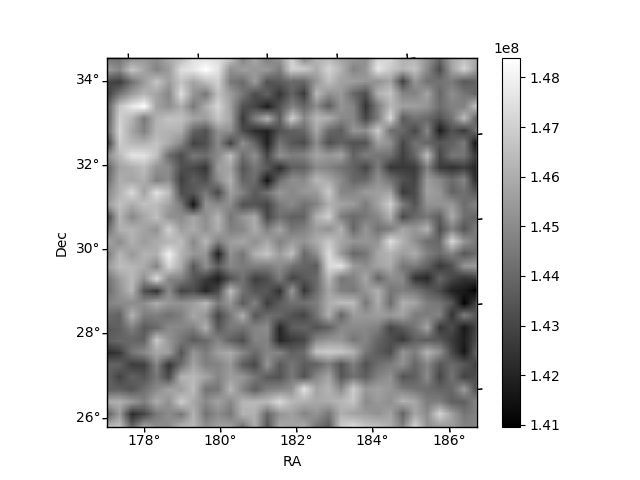
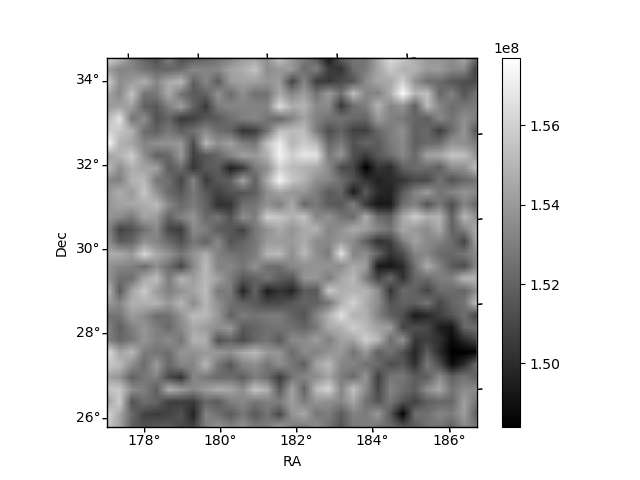
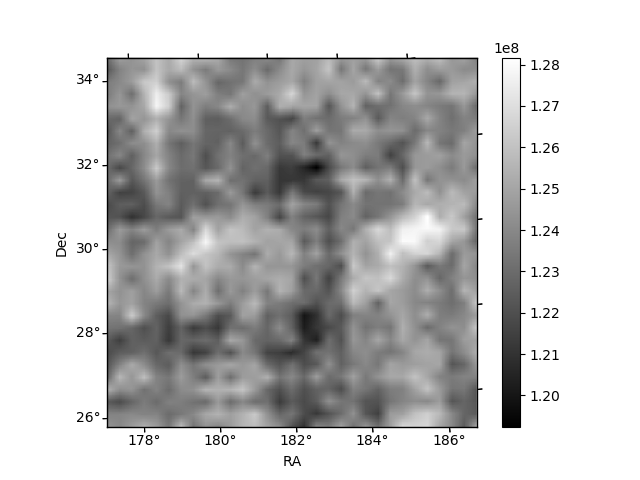
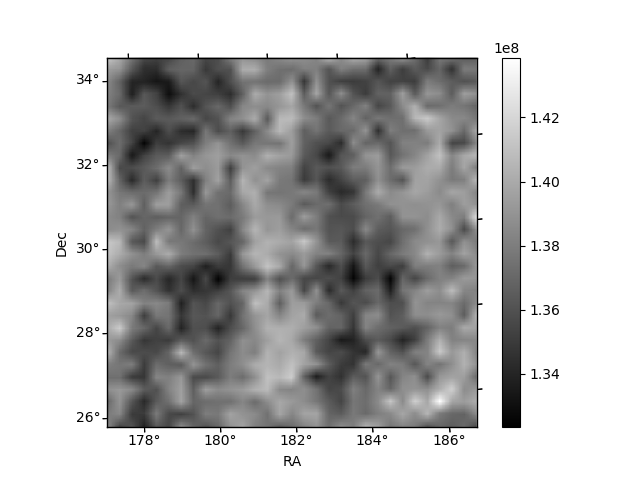
Histogram calculated using DETX and DETY for each event in the final _common_clean file
| Quadrant A | 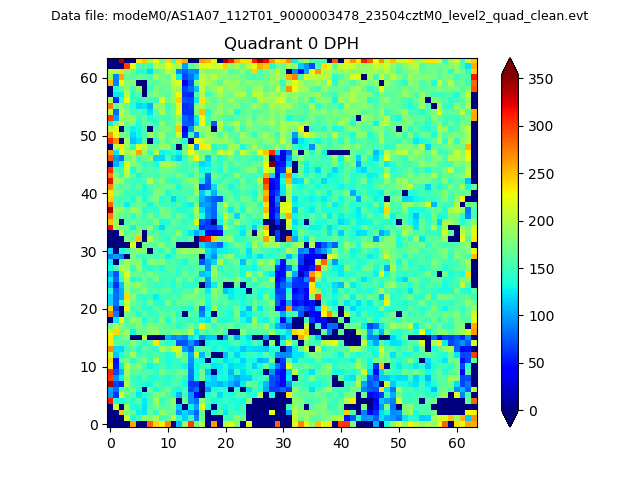 |
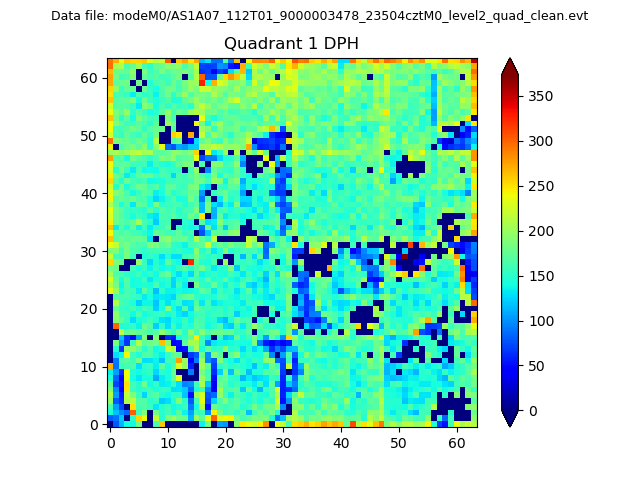 |
Quadrant B |
|---|---|---|---|
| Quadrant D | 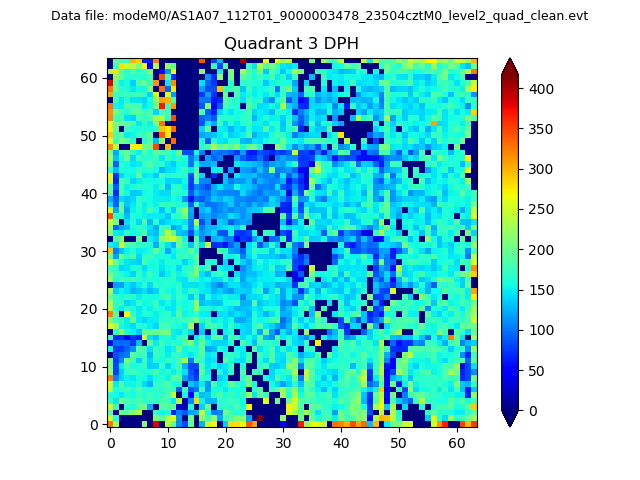 |
 |
Quadrant C |
| Plot type | Count rate plots | Images |
|---|---|---|
| Comparison with Poisson distribution Blue bars denote a histogram of data divided into 1 sec bins. Red curve is a Poisson curve with rate = median count rate of data. |
 |
 |
| Quadrant-wise count rates Data is divided into 100 sec bins |
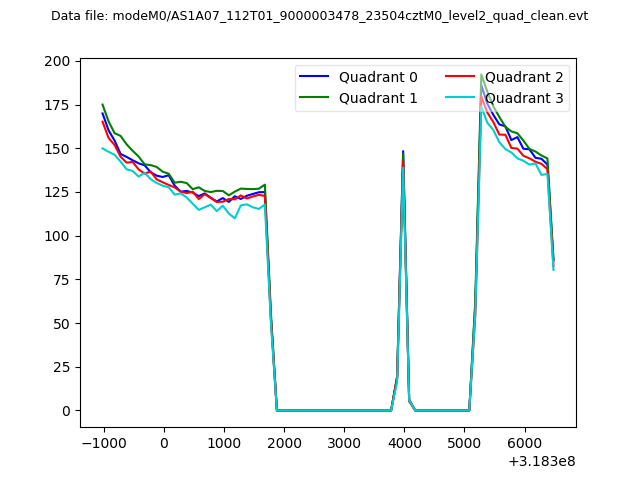 |
|
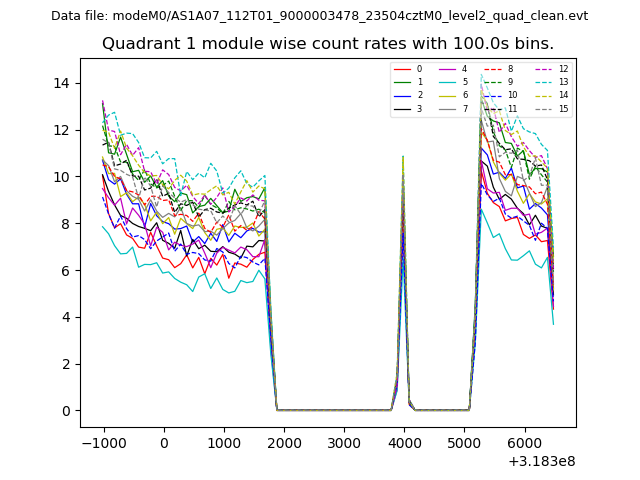
| Module-wise count rates for Quadrant A Data is divided into 100 sec bins |
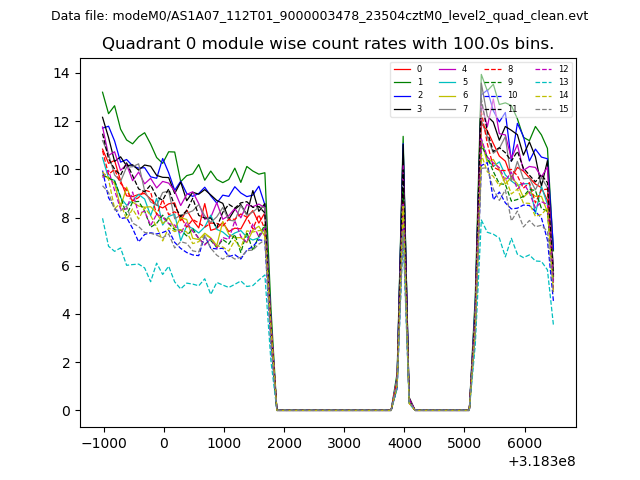 |
 |
| Module-wise count rates for Quadrant B Data is divided into 100 sec bins |
 |
 |
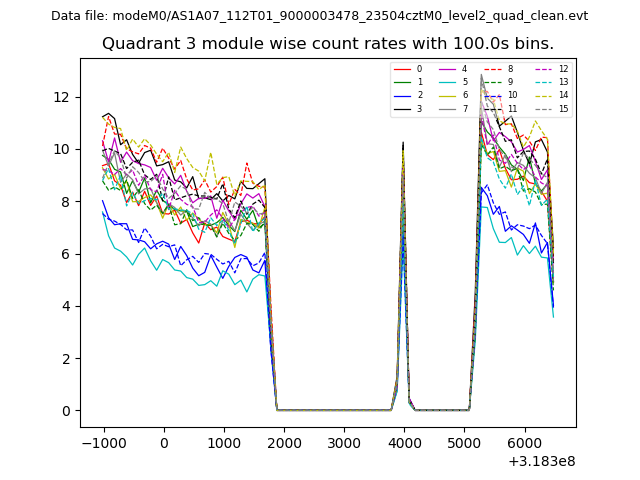
| Module-wise count rates for Quadrant C Data is divided into 100 sec bins |
 |
 |
| Module-wise count rates for Quadrant D Data is divided into 100 sec bins |
 |
 |
| Parameter | Plot |
|---|---|
| CZT HV Monitor |  |
| D_VDD | 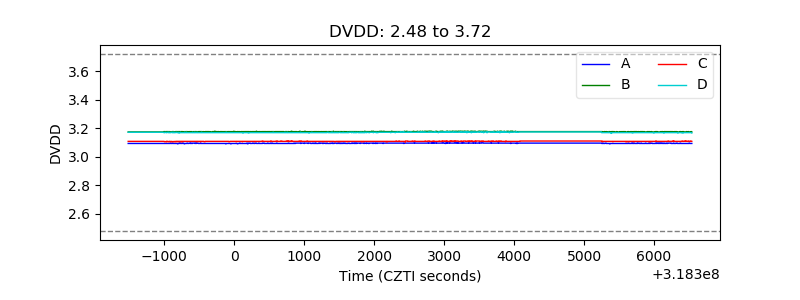 |
| Temperature 1 | 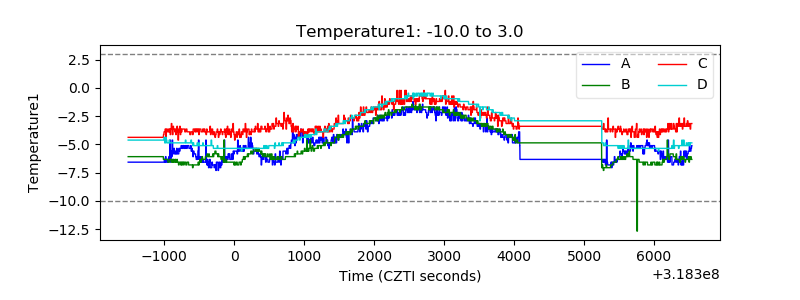 |
| Veto HV Monitor |  |
| Veto LLD | 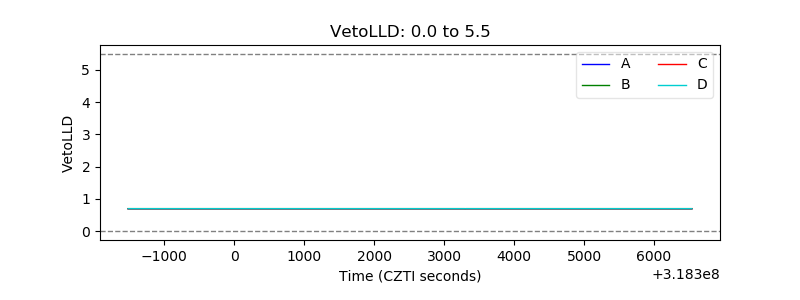 |
| Alpha Counter | 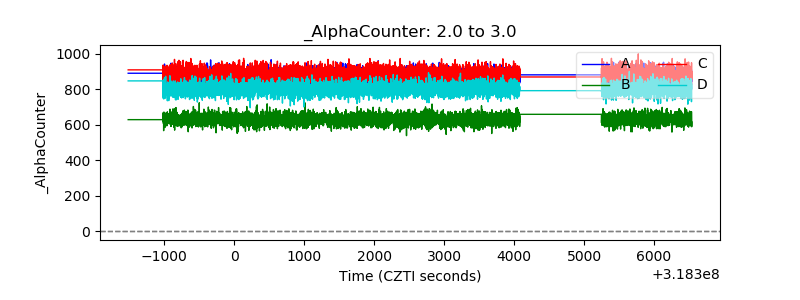 |
| _CPM_Rate | 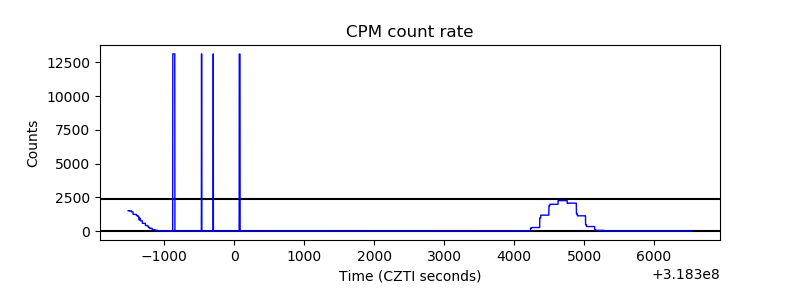 |
| CZT Counter | 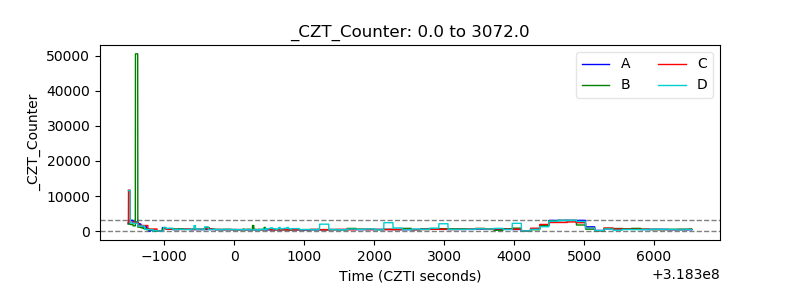 |
| +2.5 Volts monitor |  |
| +5 Volts monitor |  |
| _ROLL_ROT | 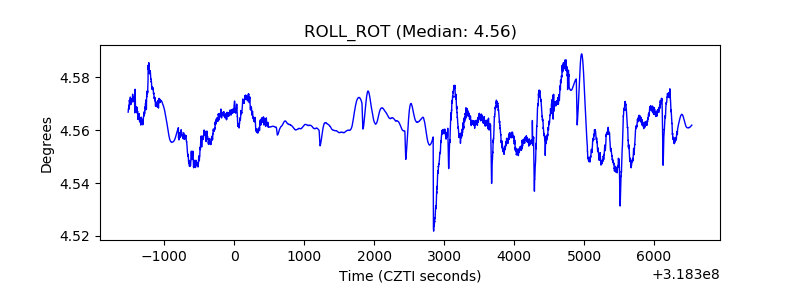 |
| _Roll_DEC | 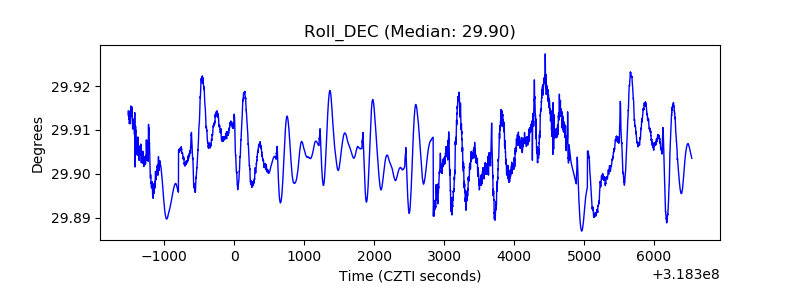 |
| _Roll_RA | 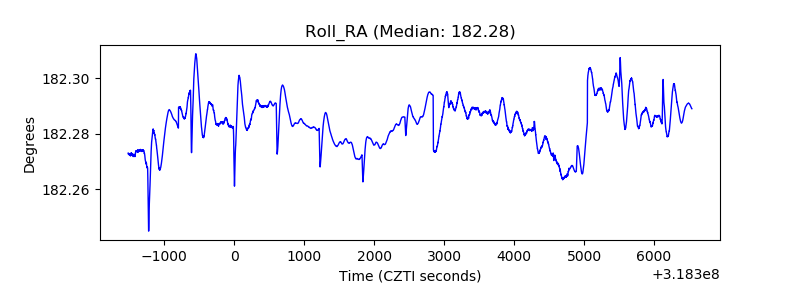 |
| Veto Counter | 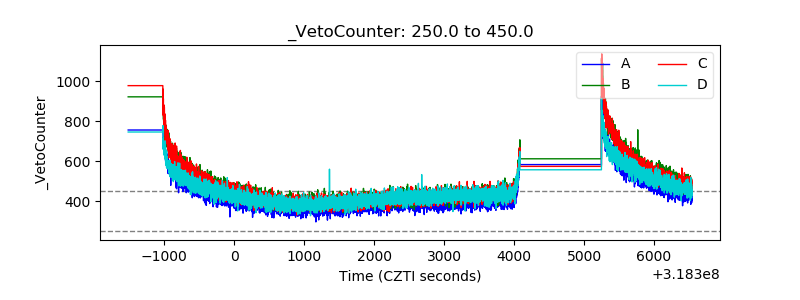 |