| Param | Original file | Final file |
|---|---|---|
| Filename | modeM0/AS1A07_112T01_9000003478_23505cztM0_level2.evt | modeM0/AS1A07_112T01_9000003478_23505cztM0_level2_quad_clean.evt |
| Size (bytes) | 1,437,981,120 | 256,743,360 |
| Size | 1.3 GB | 244.8 MB |
| Events in quadrant A | 9,609,104 | 1,623,400 |
| Events in quadrant B | 10,741,456 | 1,663,461 |
| Events in quadrant C | 9,682,320 | 1,587,741 |
| Events in quadrant D | 12,181,728 | 1,540,501 |
| Mode SS | |||
|---|---|---|---|
| Quadrant | BADHDUFLAG | Total packets | Discarded packets |
| A | 0 | 404 | 0 |
| B | 0 | 404 | 0 |
| C | 0 | 404 | 0 |
| D | 0 | 404 | 0 |
| Mode M0 | |||
|---|---|---|---|
| Quadrant | BADHDUFLAG | Total packets | Discarded packets |
| A | 0 | 41111 | 4 |
| B | 0 | 44537 | 4 |
| C | 0 | 41076 | 4 |
| D | 0 | 49622 | 4 |
| Mode M9 | |||
|---|---|---|---|
| Quadrant | BADHDUFLAG | Total packets | Discarded packets |
| A | 0 | 42 | 0 |
| B | 0 | 42 | 0 |
| C | 0 | 42 | 0 |
| D | 0 | 42 | 0 |
| Quadrant | Total seconds | Saturated seconds | Saturation percentage |
|---|---|---|---|
| A | 19761 | 78 | 0.394717% |
| B | 19761 | 312 | 1.578867% |
| C | 19761 | 195 | 0.986792% |
| D | 19761 | 468 | 2.368301% |
Noise dominated data is calculated using 1-second bins in cleaned event files. If a bin has >2000 counts, and if more than 50% of those come from <1% of pixels, then it is considered to be noise-dominated and hence unusable.
| Quadrant | # 1 sec bins | Bins with >0 counts | Bins with >2000 counts | High rate bins dominated by noise | Noise dominated (total time) | Noise dominated (detector-on time) | Marked lightcurve |
|---|---|---|---|---|---|---|---|
| A | 24076 | 19765 | 0 | 0 | 0.00% | 0.00% | 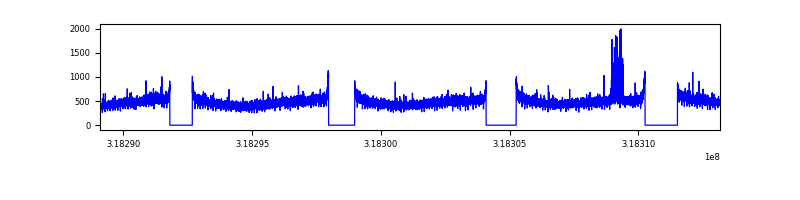 |
| B | 24076 | 19763 | 127 | 127 | 0.53% | 0.64% | 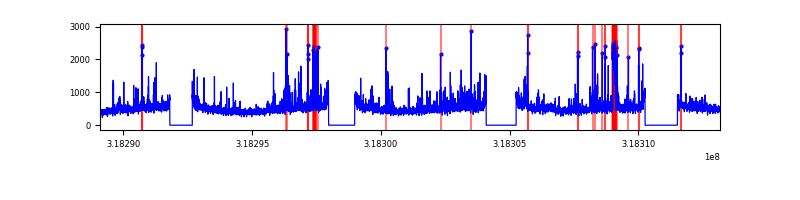 |
| C | 24076 | 19763 | 2 | 2 | 0.01% | 0.01% | 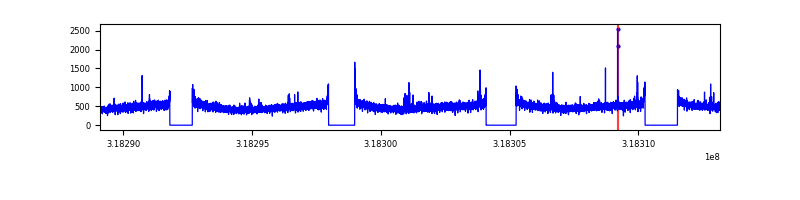 |
| D | 24076 | 19764 | 339 | 339 | 1.41% | 1.72% | 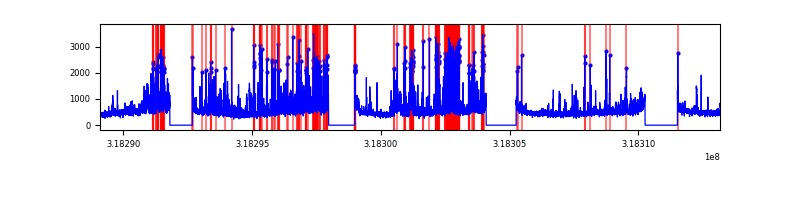 |
Top three noisy pixels from each quadrant. If the there are fewer than three noisy pixels in the level2.evt file, extra rows are filled as -1
| Pixel properties | Quadrant properties | ||||||
|---|---|---|---|---|---|---|---|
| Quadrant | DetID | PixID | Counts | Sigma | Mean | Median | Sigma |
| A | 2 | 79 | 133254 | 268.25 | 2459 | 2411 | 487.8 |
| A | 13 | 254 | 33829 | 64.41 | 2459 | 2411 | 487.8 |
| A | 0 | 226 | 21345 | 38.82 | 2459 | 2411 | 487.8 |
| B | 0 | 189 | 491246 | 1074.44 | 2431 | 2372 | 455.0 |
| B | 12 | 17 | 281457 | 613.37 | 2431 | 2372 | 455.0 |
| B | 0 | 219 | 279676 | 609.45 | 2431 | 2372 | 455.0 |
| C | 14 | 238 | 374838 | 684.3 | 2342 | 2356 | 544.3 |
| C | 7 | 247 | 114051 | 205.2 | 2342 | 2356 | 544.3 |
| C | 2 | 16 | 18002 | 28.74 | 2342 | 2356 | 544.3 |
| D | 1 | 52 | 2475376 | 4319.21 | 2363 | 2298 | 572.6 |
| D | 9 | 35 | 364233 | 632.12 | 2363 | 2298 | 572.6 |
| D | 9 | 85 | 195020 | 336.59 | 2363 | 2298 | 572.6 |
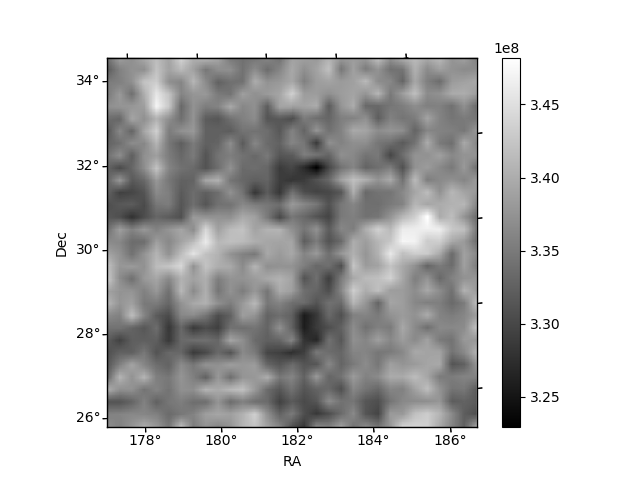
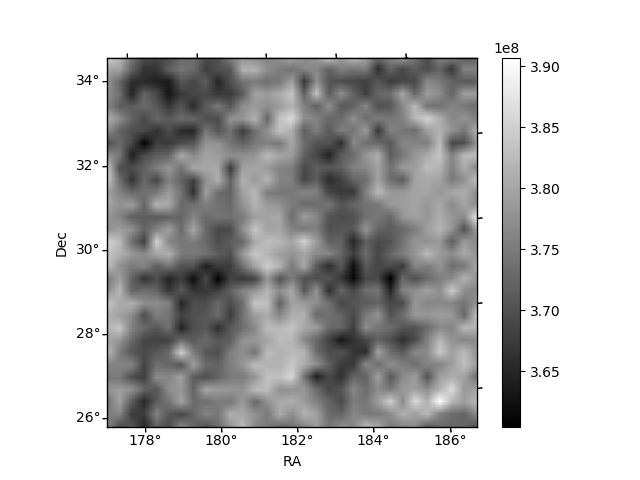
Histogram calculated using DETX and DETY for each event in the final _common_clean file
| Quadrant A |  |
 |
Quadrant B |
|---|---|---|---|
| Quadrant D |  |
 |
Quadrant C |
| Plot type | Count rate plots | Images |
|---|---|---|
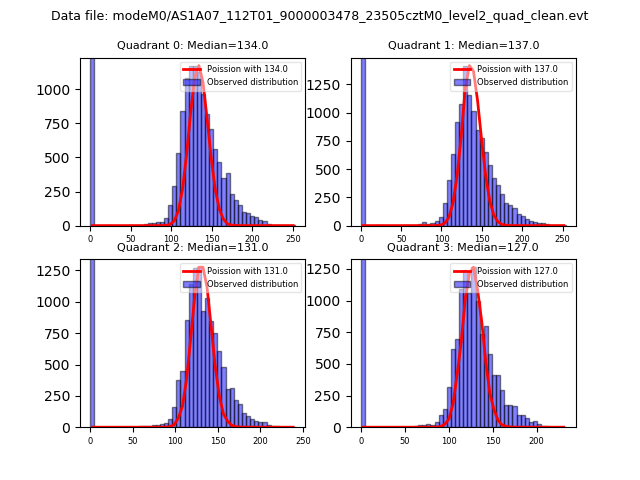
| Comparison with Poisson distribution Blue bars denote a histogram of data divided into 1 sec bins. Red curve is a Poisson curve with rate = median count rate of data. |
 |
 |
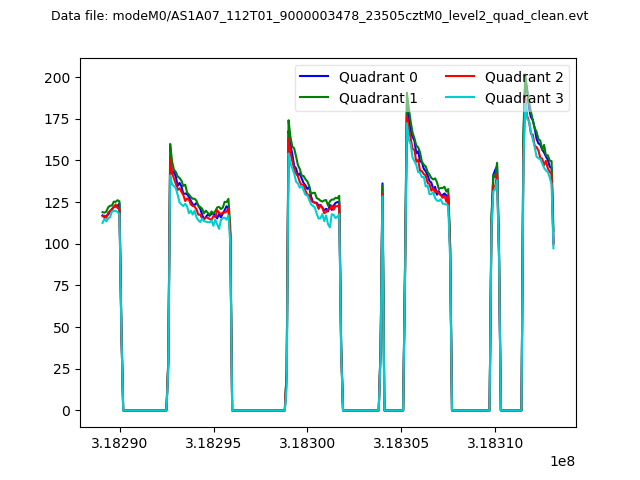
| Quadrant-wise count rates Data is divided into 100 sec bins |
 |
|
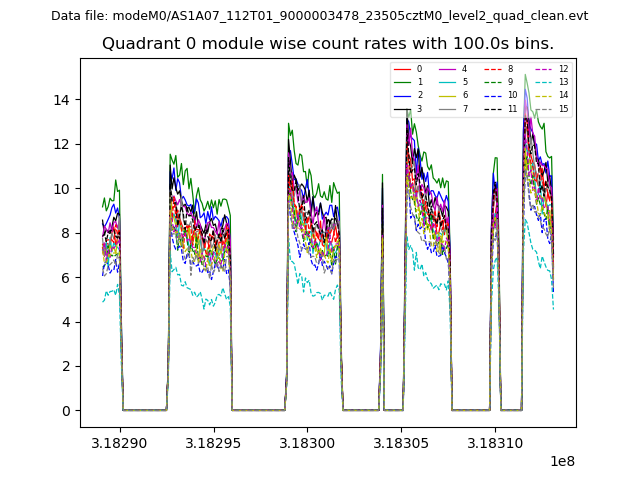
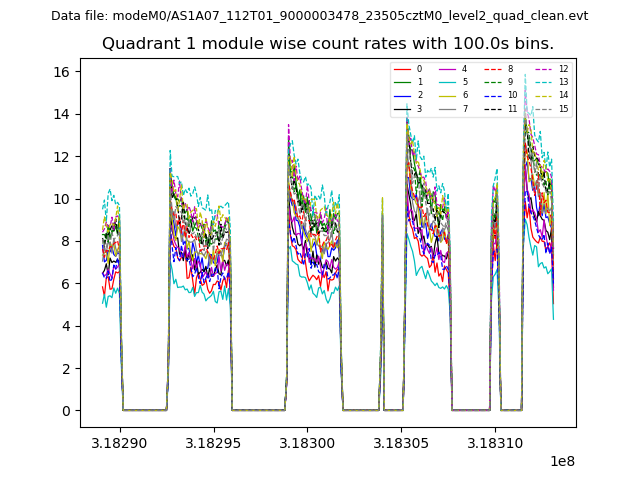
| Module-wise count rates for Quadrant A Data is divided into 100 sec bins |
 |
 |
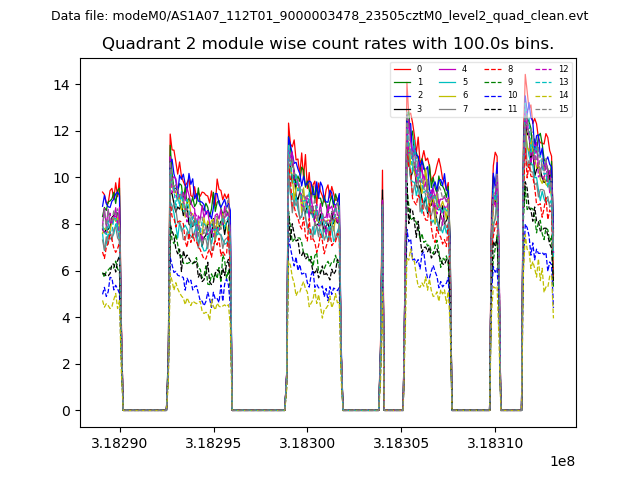
| Module-wise count rates for Quadrant B Data is divided into 100 sec bins |
 |
 |
| Module-wise count rates for Quadrant C Data is divided into 100 sec bins |
 |
 |
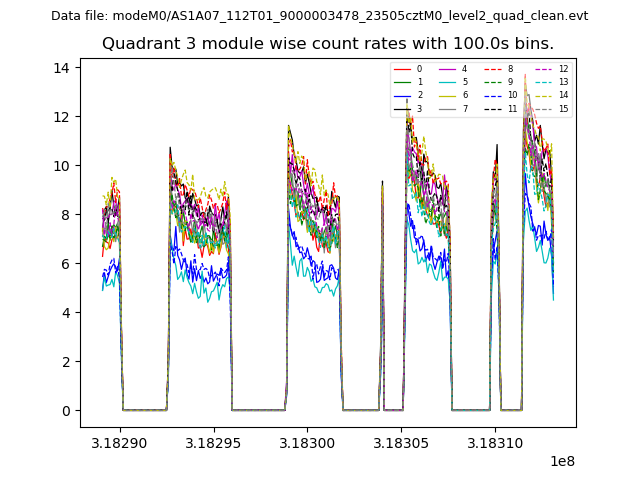
| Module-wise count rates for Quadrant D Data is divided into 100 sec bins |
 |
 |
| Parameter | Plot |
|---|---|
| CZT HV Monitor | 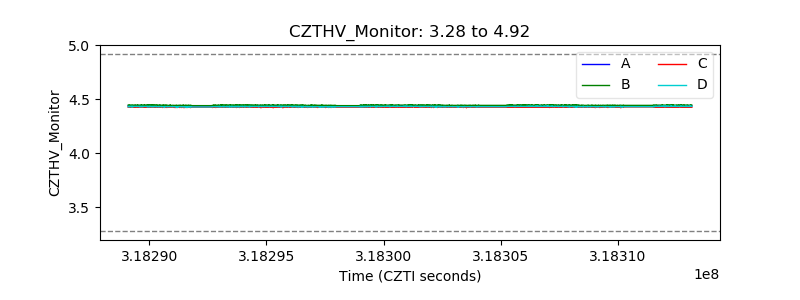 |
| D_VDD | 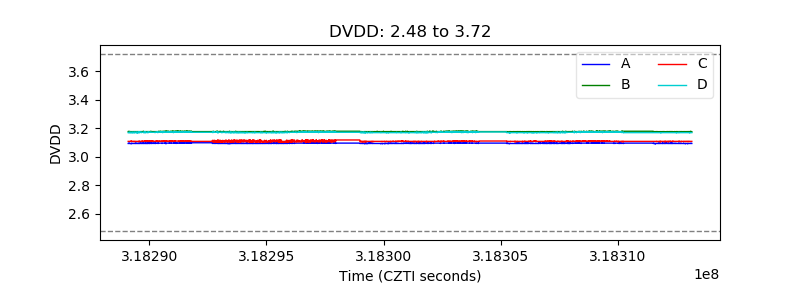 |
| Temperature 1 | 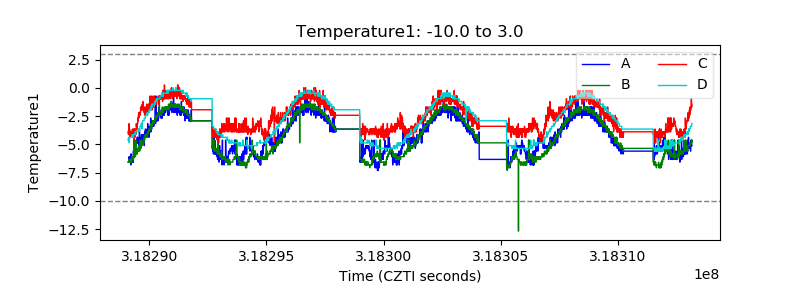 |
| Veto HV Monitor | 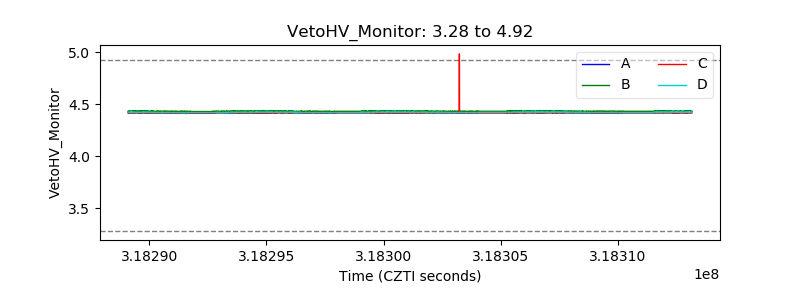 |
| Veto LLD |  |
| Alpha Counter | 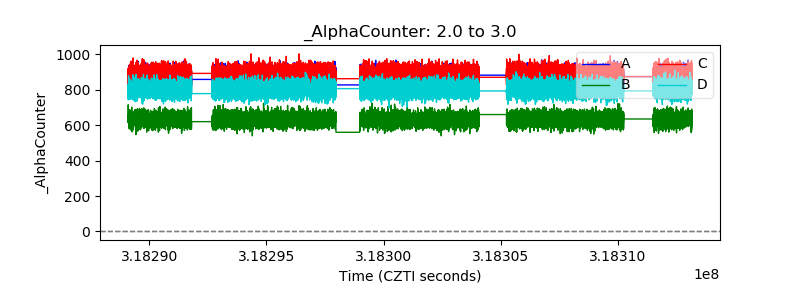 |
| _CPM_Rate | 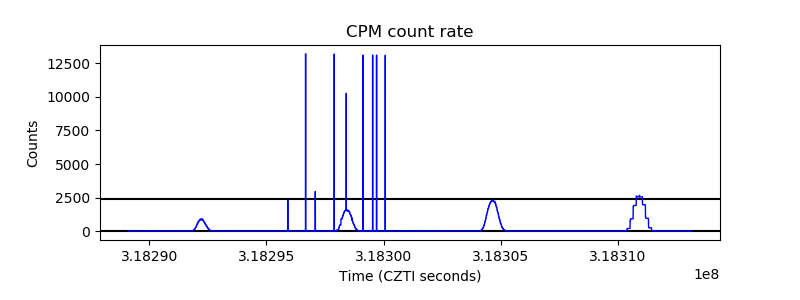 |
| CZT Counter | 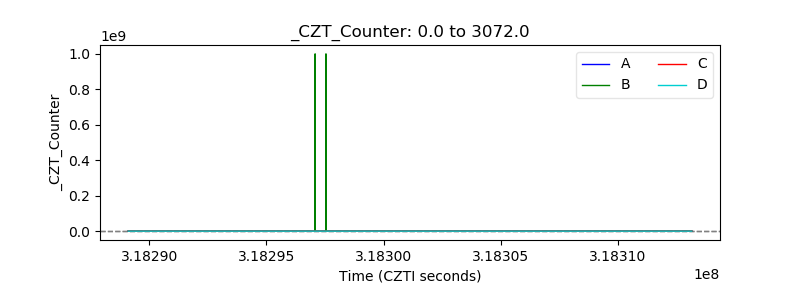 |
| +2.5 Volts monitor |  |
| +5 Volts monitor |  |
| _ROLL_ROT | 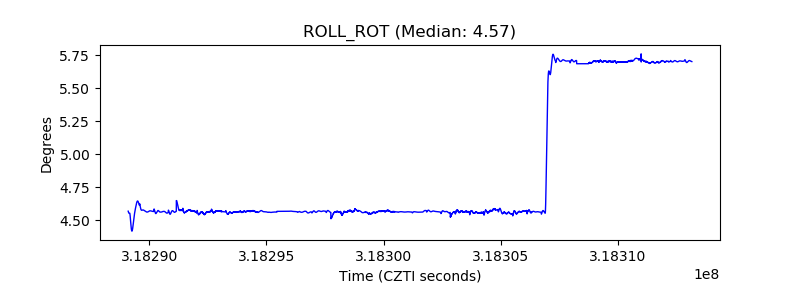 |
| _Roll_DEC | 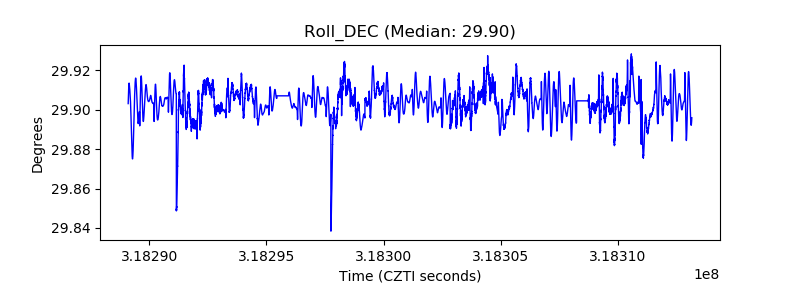 |
| _Roll_RA | 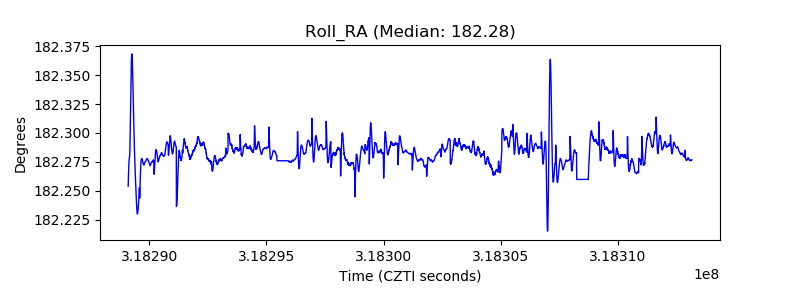 |
| Veto Counter | 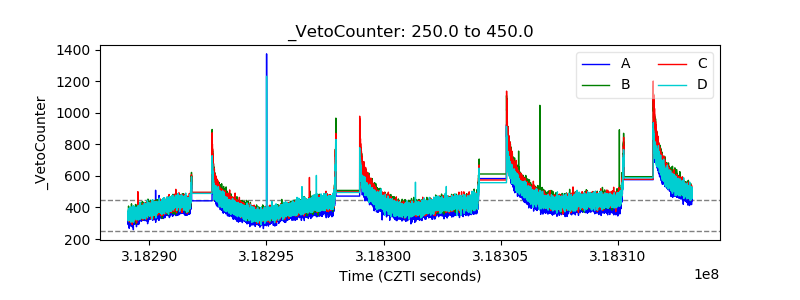 |