| Param | Original file | Final file |
|---|---|---|
| Filename | modeM0/AS1A07_112T01_9000003478_23507cztM0_level2.evt | modeM0/AS1A07_112T01_9000003478_23507cztM0_level2_quad_clean.evt |
| Size (bytes) | 419,952,960 | 84,363,840 |
| Size | 400.5 MB | 80.5 MB |
| Events in quadrant A | 2,988,568 | 555,485 |
| Events in quadrant B | 3,165,665 | 556,753 |
| Events in quadrant C | 2,994,967 | 532,364 |
| Events in quadrant D | 3,188,324 | 518,692 |
| Mode SS | |||
|---|---|---|---|
| Quadrant | BADHDUFLAG | Total packets | Discarded packets |
| A | 0 | 115 | 3 |
| B | 0 | 114 | 0 |
| C | 0 | 112 | 0 |
| D | 0 | 116 | 2 |
| Mode M0 | |||
|---|---|---|---|
| Quadrant | BADHDUFLAG | Total packets | Discarded packets |
| A | 0 | 12119 | 231 |
| B | 0 | 12923 | 293 |
| C | 0 | 12216 | 195 |
| D | 0 | 13115 | 400 |
| Mode M9 | |||
|---|---|---|---|
| Quadrant | BADHDUFLAG | Total packets | Discarded packets |
| A | 0 | 15 | 1 |
| B | 0 | 14 | 0 |
| C | 0 | 14 | 1 |
| D | 0 | 13 | 0 |
| Quadrant | Total seconds | Saturated seconds | Saturation percentage |
|---|---|---|---|
| A | 5610 | 50 | 0.891266% |
| B | 5598 | 80 | 1.429082% |
| C | 5621 | 75 | 1.334282% |
| D | 5569 | 47 | 0.843958% |
Noise dominated data is calculated using 1-second bins in cleaned event files. If a bin has >2000 counts, and if more than 50% of those come from <1% of pixels, then it is considered to be noise-dominated and hence unusable.
| Quadrant | # 1 sec bins | Bins with >0 counts | Bins with >2000 counts | High rate bins dominated by noise | Noise dominated (total time) | Noise dominated (detector-on time) | Marked lightcurve |
|---|---|---|---|---|---|---|---|
| A | 7066 | 5691 | 0 | 0 | 0.00% | 0.00% | 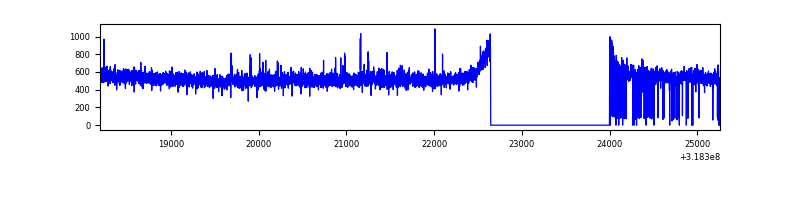 |
| B | 7066 | 5682 | 9 | 9 | 0.13% | 0.16% | 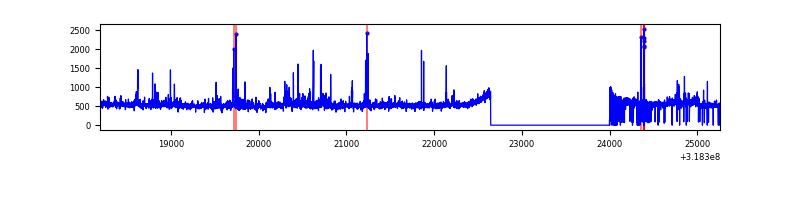 |
| C | 7066 | 5699 | 1 | 1 | 0.01% | 0.02% | 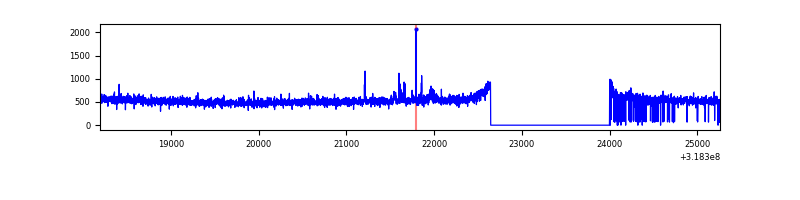 |
| D | 7066 | 5673 | 9 | 9 | 0.13% | 0.16% | 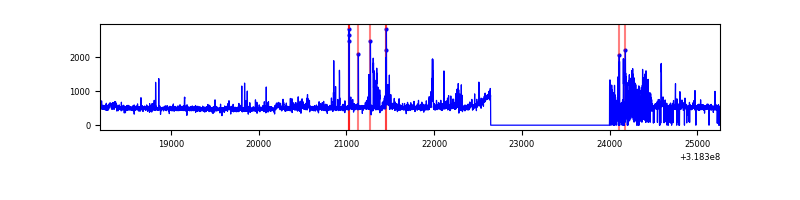 |
Top three noisy pixels from each quadrant. If the there are fewer than three noisy pixels in the level2.evt file, extra rows are filled as -1
| Pixel properties | Quadrant properties | ||||||
|---|---|---|---|---|---|---|---|
| Quadrant | DetID | PixID | Counts | Sigma | Mean | Median | Sigma |
| A | 2 | 79 | 18790 | 118.66 | 770 | 758 | 152.0 |
| A | 13 | 254 | 10056 | 61.18 | 770 | 758 | 152.0 |
| A | 0 | 226 | 6783 | 39.65 | 770 | 758 | 152.0 |
| B | 0 | 219 | 147968 | 1048.55 | 748 | 732 | 140.4 |
| B | 0 | 189 | 62580 | 440.45 | 748 | 732 | 140.4 |
| B | 12 | 111 | 16226 | 110.34 | 748 | 732 | 140.4 |
| C | 14 | 238 | 118237 | 711.4 | 724 | 732 | 165.2 |
| C | 7 | 247 | 42872 | 255.12 | 724 | 732 | 165.2 |
| C | 0 | 207 | 7193 | 39.12 | 724 | 732 | 165.2 |
| D | 1 | 52 | 300096 | 1670.45 | 737 | 717 | 179.2 |
| D | 9 | 85 | 59654 | 328.85 | 737 | 717 | 179.2 |
| D | 2 | 234 | 22082 | 119.21 | 737 | 717 | 179.2 |
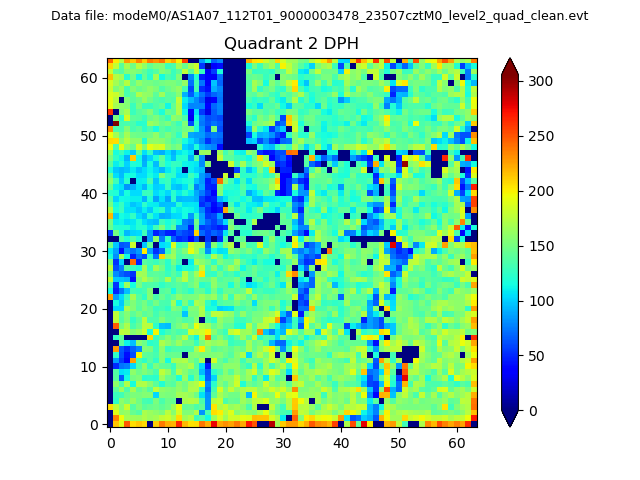
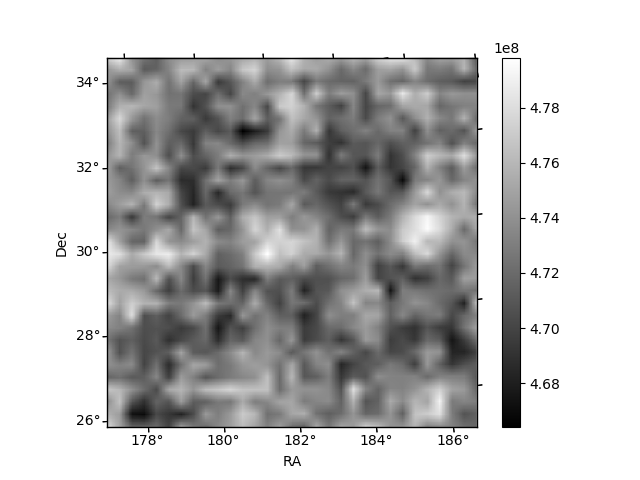
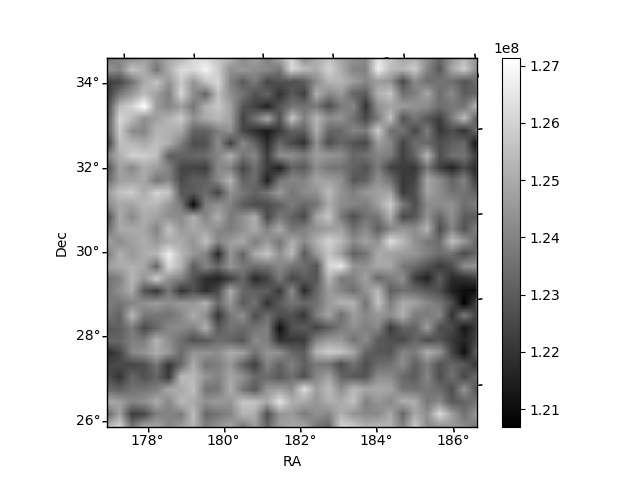
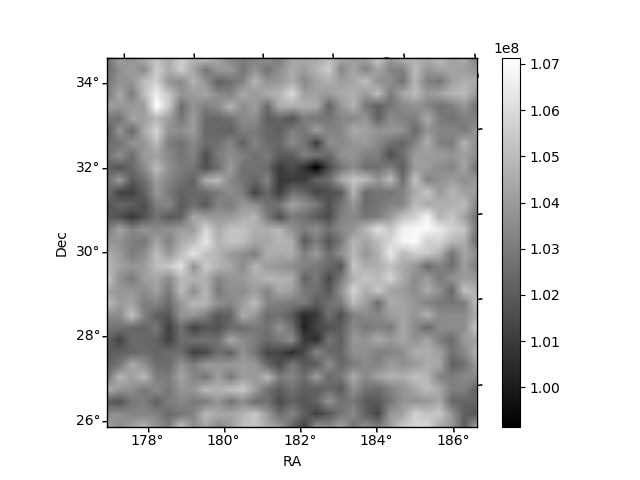
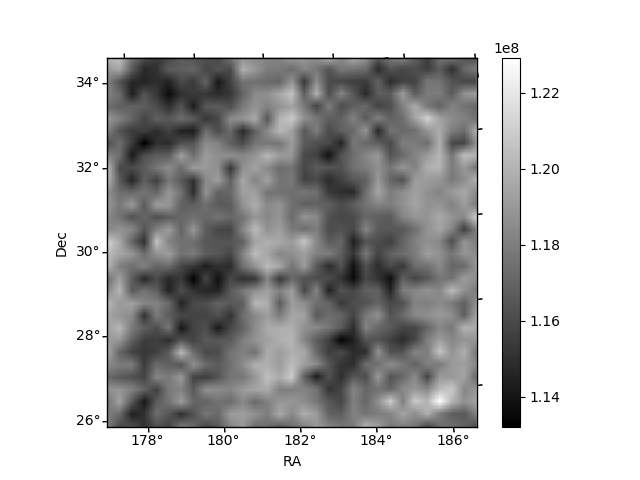
Histogram calculated using DETX and DETY for each event in the final _common_clean file
| Quadrant A | 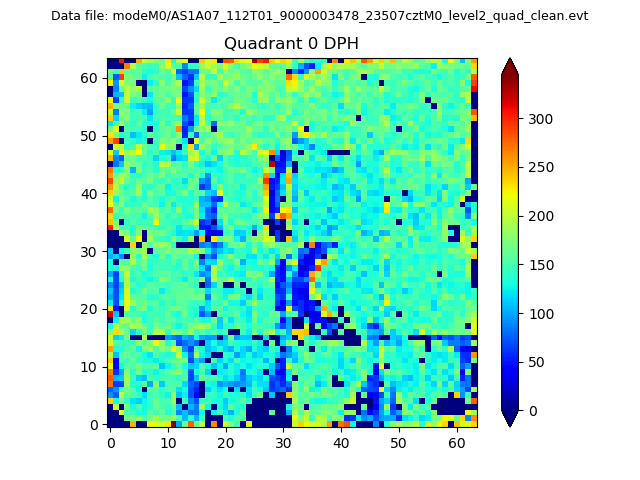 |
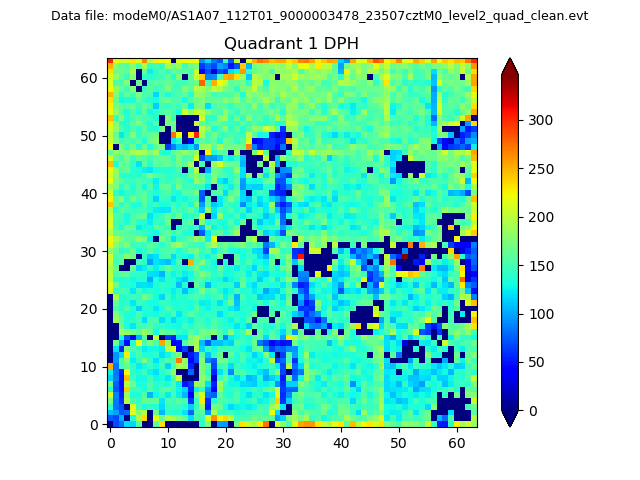 |
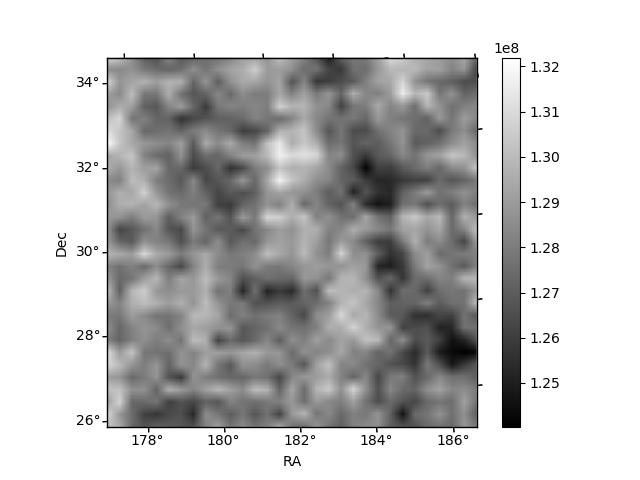
Quadrant B |
|---|---|---|---|
| Quadrant D | 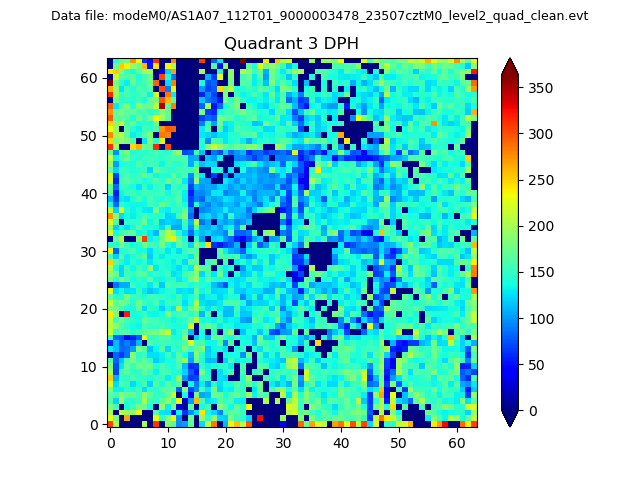 |
 |
Quadrant C |
| Plot type | Count rate plots | Images |
|---|---|---|
| Comparison with Poisson distribution Blue bars denote a histogram of data divided into 1 sec bins. Red curve is a Poisson curve with rate = median count rate of data. |
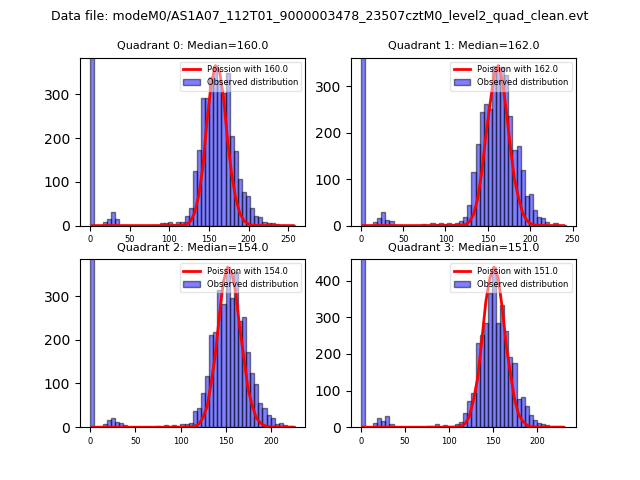 |
 |
| Quadrant-wise count rates Data is divided into 100 sec bins |
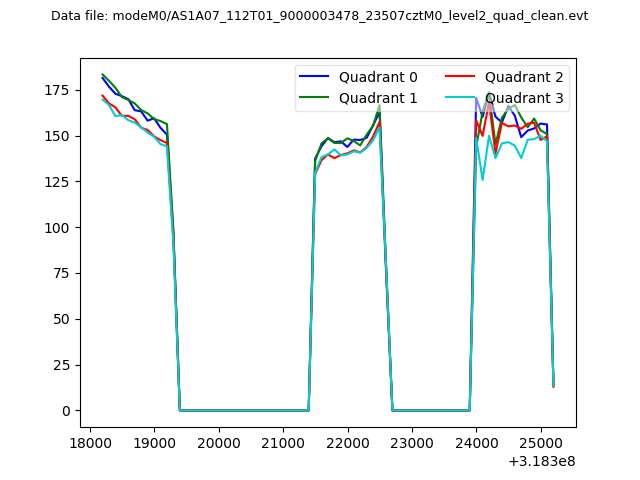 |
|
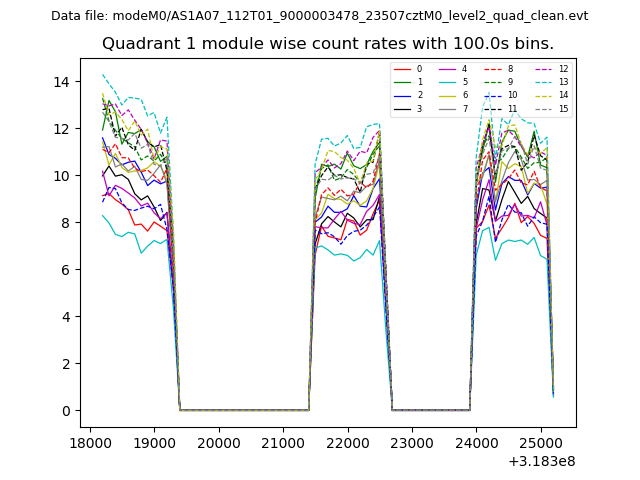
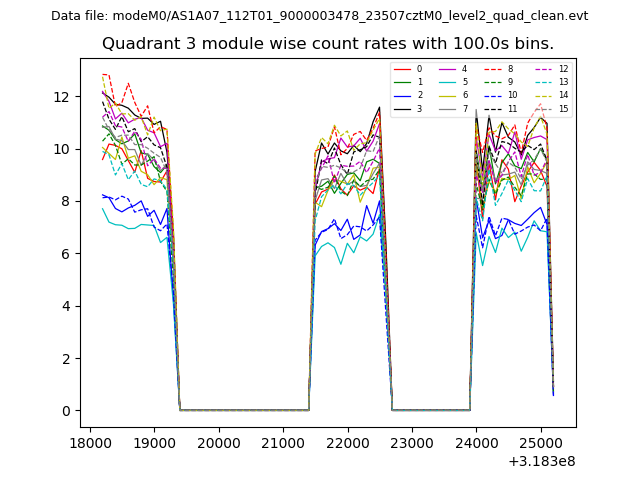
| Module-wise count rates for Quadrant A Data is divided into 100 sec bins |
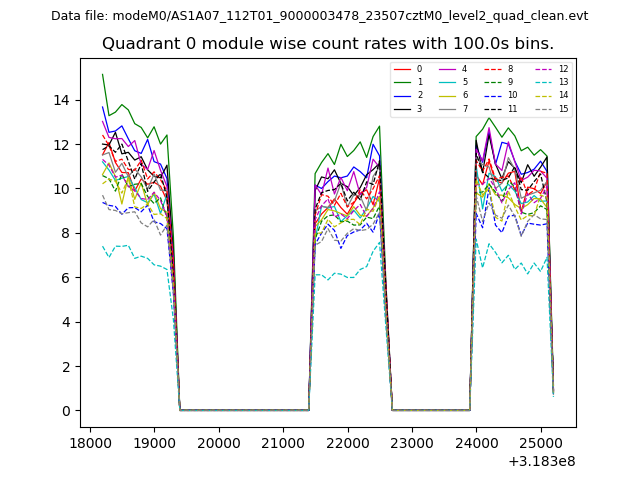 |
 |
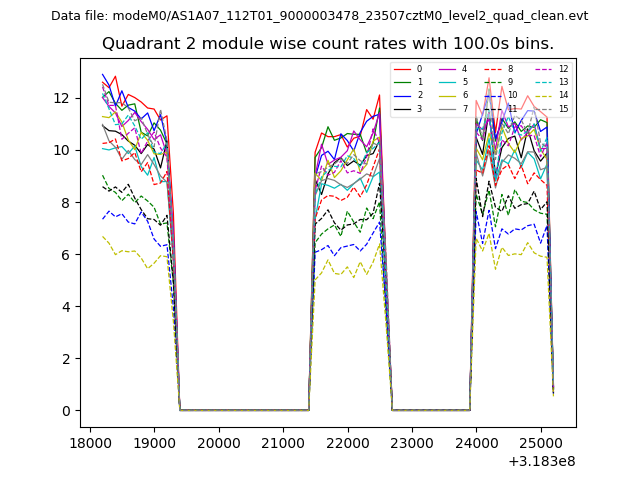
| Module-wise count rates for Quadrant B Data is divided into 100 sec bins |
 |
 |
| Module-wise count rates for Quadrant C Data is divided into 100 sec bins |
 |
 |
| Module-wise count rates for Quadrant D Data is divided into 100 sec bins |
 |
 |
| Parameter | Plot |
|---|---|
| CZT HV Monitor | 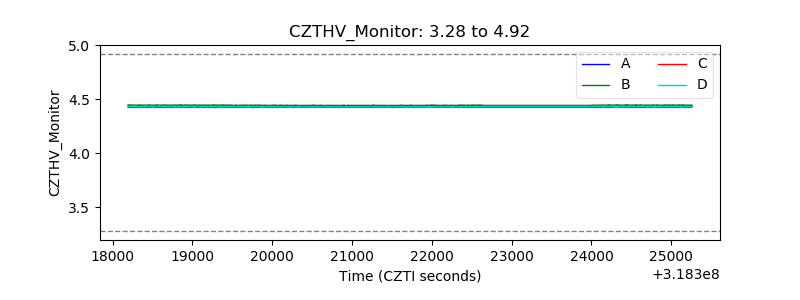 |
| D_VDD | 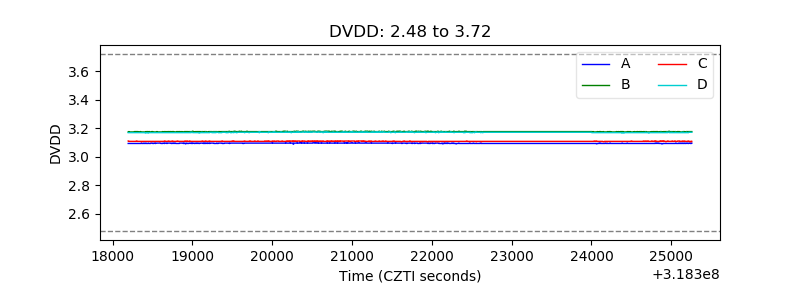 |
| Temperature 1 | 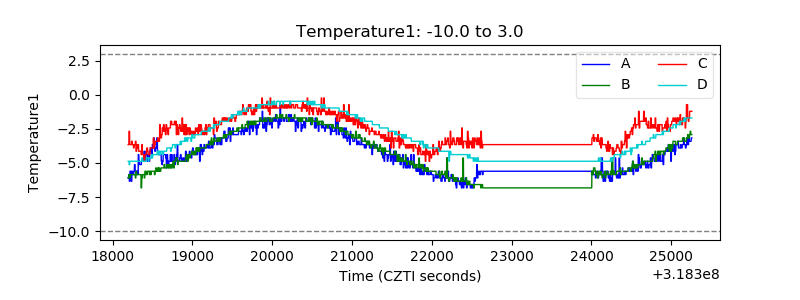 |
| Veto HV Monitor | 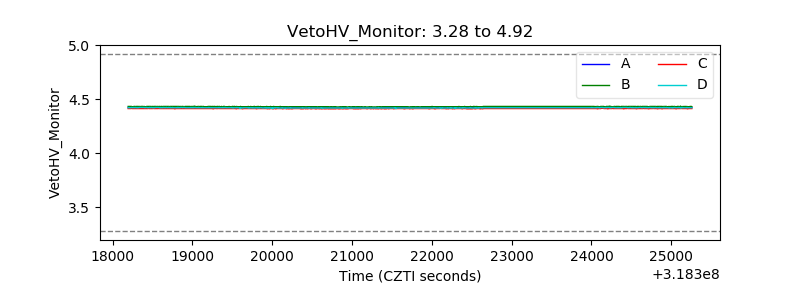 |
| Veto LLD | 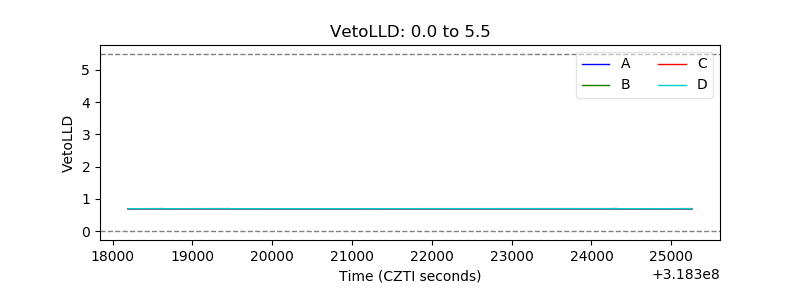 |
| Alpha Counter | 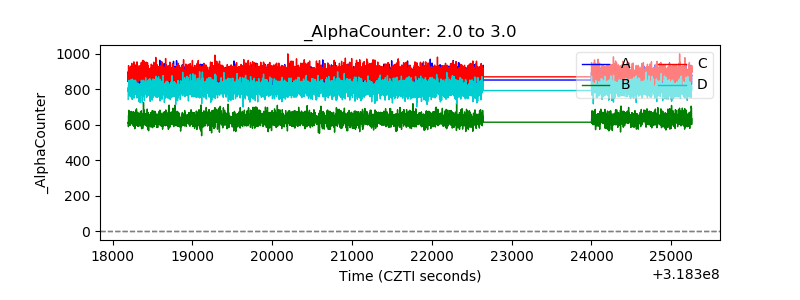 |
| _CPM_Rate | 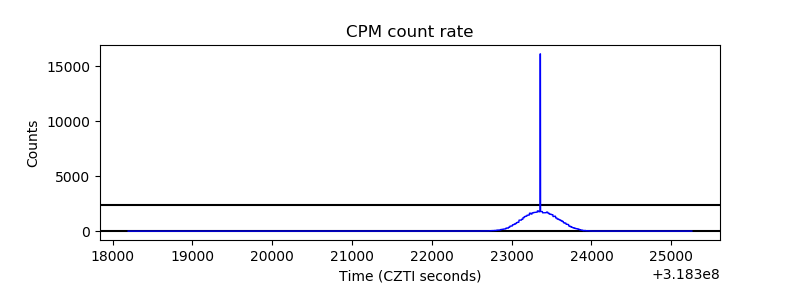 |
| CZT Counter | 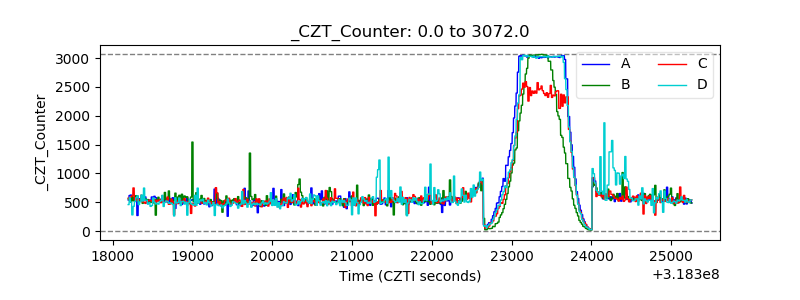 |
| +2.5 Volts monitor |  |
| +5 Volts monitor | 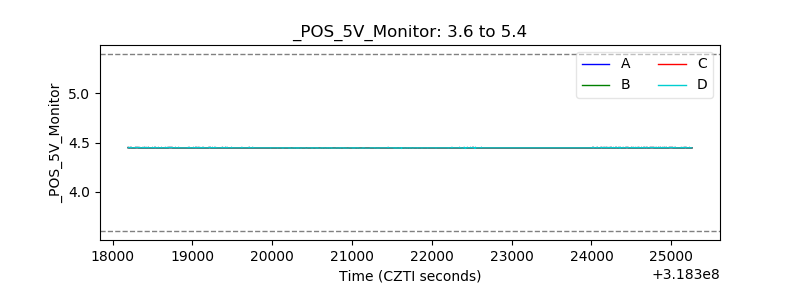 |
| _ROLL_ROT | 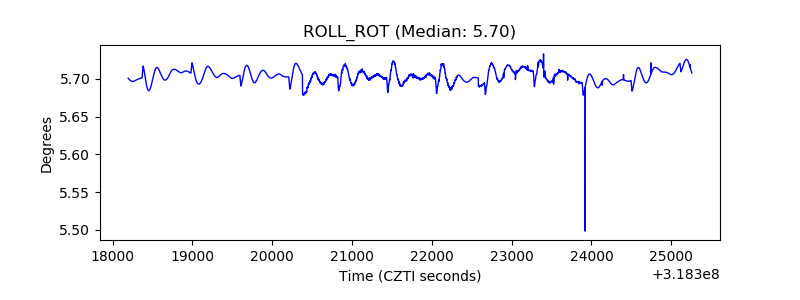 |
| _Roll_DEC | 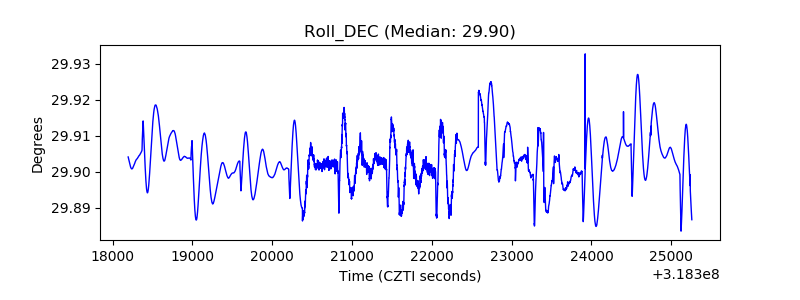 |
| _Roll_RA | 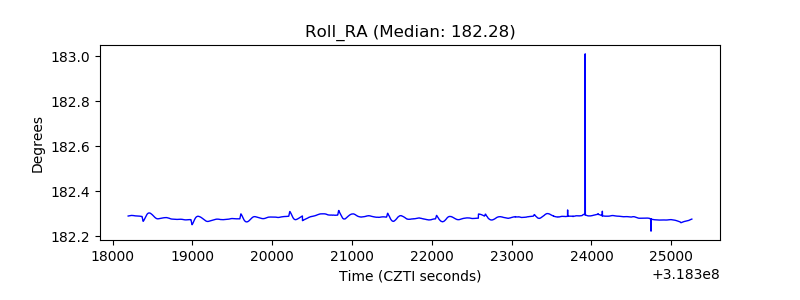 |
| Veto Counter | 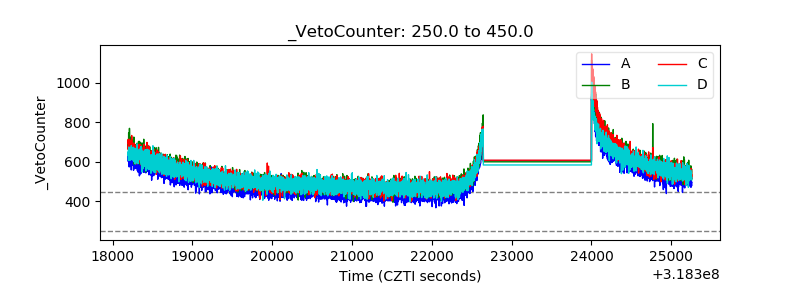 |