| Param | Original file | Final file |
|---|---|---|
| Filename | modeM0/AS1A07_112T01_9000003478_23509cztM0_level2.evt | modeM0/AS1A07_112T01_9000003478_23509cztM0_level2_quad_clean.evt |
| Size (bytes) | 697,749,120 | 76,023,360 |
| Size | 665.4 MB | 72.5 MB |
| Events in quadrant A | 3,516,671 | 510,199 |
| Events in quadrant B | 3,904,277 | 513,700 |
| Events in quadrant C | 3,596,824 | 494,305 |
| Events in quadrant D | 9,647,909 | 303,521 |
| Mode SS | |||
|---|---|---|---|
| Quadrant | BADHDUFLAG | Total packets | Discarded packets |
| A | 0 | 138 | 0 |
| B | 0 | 138 | 0 |
| C | 0 | 138 | 0 |
| D | 0 | 138 | 0 |
| Mode M0 | |||
|---|---|---|---|
| Quadrant | BADHDUFLAG | Total packets | Discarded packets |
| A | 0 | 14420 | 2 |
| B | 0 | 15653 | 2 |
| C | 0 | 14594 | 3 |
| D | 0 | 33201 | 2 |
| Mode M9 | |||
|---|---|---|---|
| Quadrant | BADHDUFLAG | Total packets | Discarded packets |
| A | 0 | 11 | 0 |
| B | 0 | 11 | 0 |
| C | 0 | 11 | 0 |
| D | 0 | 11 | 0 |
| Quadrant | Total seconds | Saturated seconds | Saturation percentage |
|---|---|---|---|
| A | 6885 | 126 | 1.830065% |
| B | 6886 | 180 | 2.613999% |
| C | 6885 | 158 | 2.294844% |
| D | 6885 | 2338 | 33.957879% |
Noise dominated data is calculated using 1-second bins in cleaned event files. If a bin has >2000 counts, and if more than 50% of those come from <1% of pixels, then it is considered to be noise-dominated and hence unusable.
| Quadrant | # 1 sec bins | Bins with >0 counts | Bins with >2000 counts | High rate bins dominated by noise | Noise dominated (total time) | Noise dominated (detector-on time) | Marked lightcurve |
|---|---|---|---|---|---|---|---|
| A | 7910 | 6885 | 0 | 0 | 0.00% | 0.00% |  |
| B | 7911 | 6886 | 22 | 22 | 0.28% | 0.32% |  |
| C | 7910 | 6885 | 14 | 14 | 0.18% | 0.20% |  |
| D | 7910 | 6885 | 2211 | 2211 | 27.95% | 32.11% |  |
Top three noisy pixels from each quadrant. If the there are fewer than three noisy pixels in the level2.evt file, extra rows are filled as -1
| Pixel properties | Quadrant properties | ||||||
|---|---|---|---|---|---|---|---|
| Quadrant | DetID | PixID | Counts | Sigma | Mean | Median | Sigma |
| A | 4 | 2 | 26666 | 142.48 | 905 | 887 | 180.9 |
| A | 13 | 254 | 11940 | 61.09 | 905 | 887 | 180.9 |
| A | 0 | 226 | 7892 | 38.72 | 905 | 887 | 180.9 |
| B | 0 | 189 | 210822 | 1248.12 | 887 | 865 | 168.2 |
| B | 0 | 219 | 62513 | 366.47 | 887 | 865 | 168.2 |
| B | 0 | 229 | 50358 | 294.22 | 887 | 865 | 168.2 |
| C | 14 | 238 | 135735 | 678.47 | 855 | 863 | 198.8 |
| C | 8 | 208 | 47445 | 234.33 | 855 | 863 | 198.8 |
| C | 0 | 10 | 42172 | 207.8 | 855 | 863 | 198.8 |
| D | 1 | 52 | 6184256 | 35752.29 | 703 | 681 | 173.0 |
| D | 9 | 85 | 637597 | 3682.53 | 703 | 681 | 173.0 |
| D | 2 | 153 | 71804 | 411.22 | 703 | 681 | 173.0 |
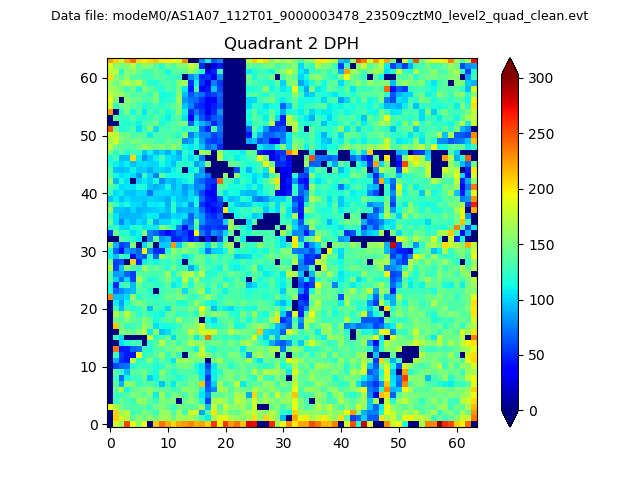
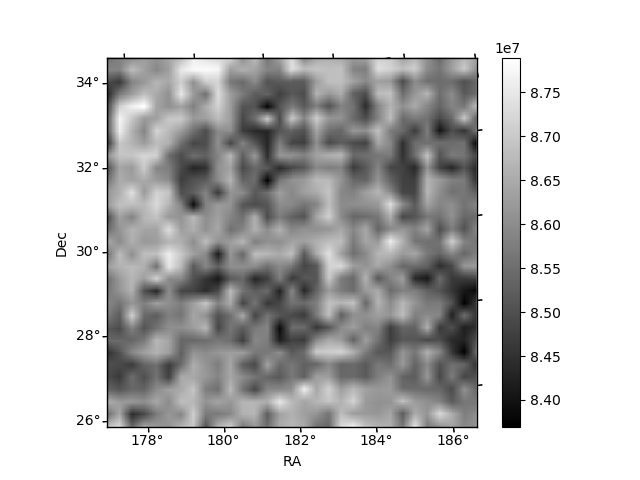
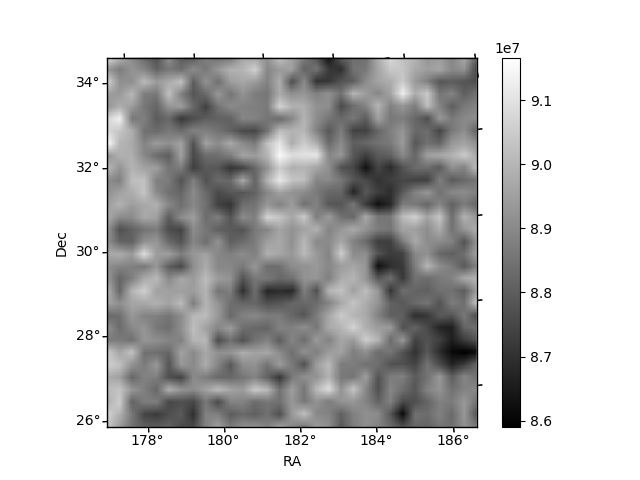
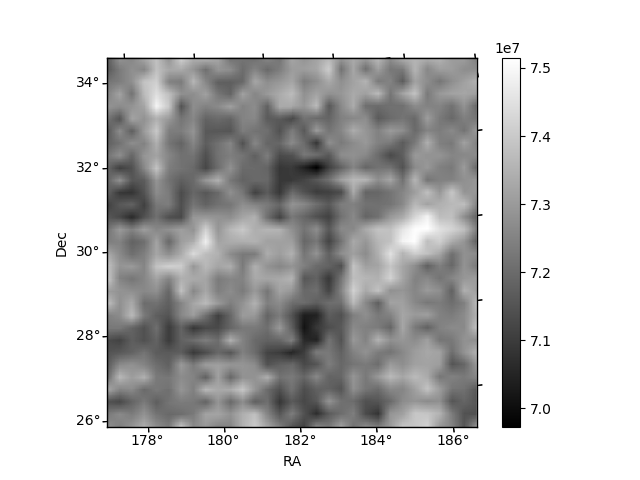
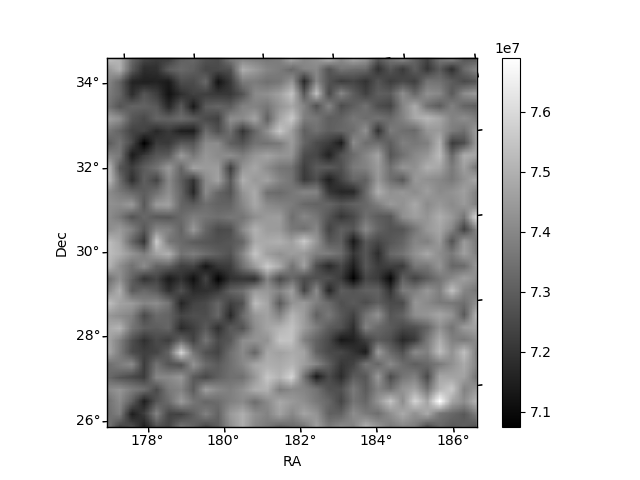
Histogram calculated using DETX and DETY for each event in the final _common_clean file
| Quadrant A | 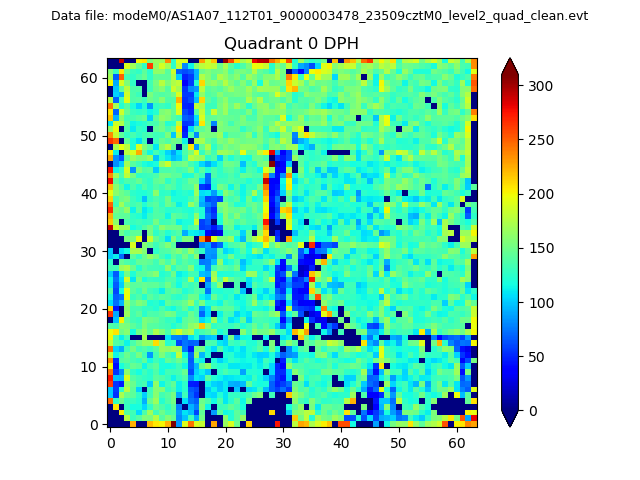 |
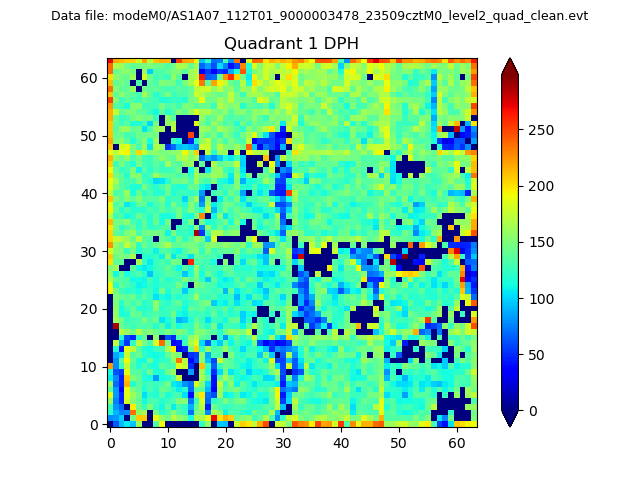 |
Quadrant B |
|---|---|---|---|
| Quadrant D | 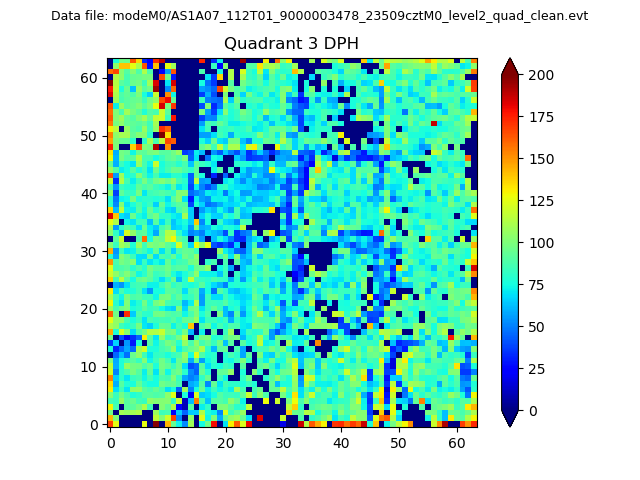 |
 |
Quadrant C |
| Plot type | Count rate plots | Images |
|---|---|---|
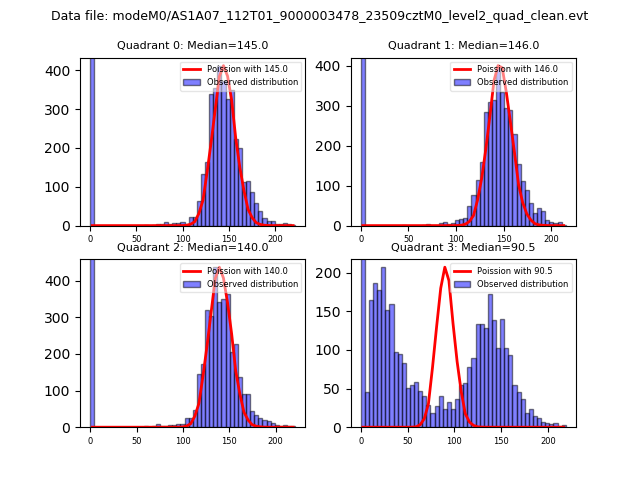
| Comparison with Poisson distribution Blue bars denote a histogram of data divided into 1 sec bins. Red curve is a Poisson curve with rate = median count rate of data. |
 |
 |
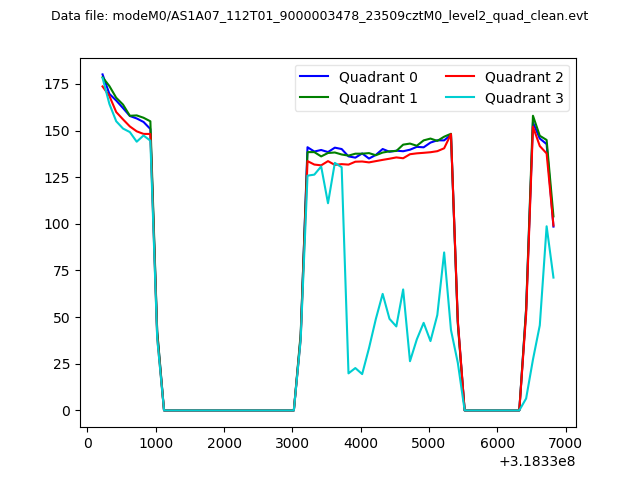
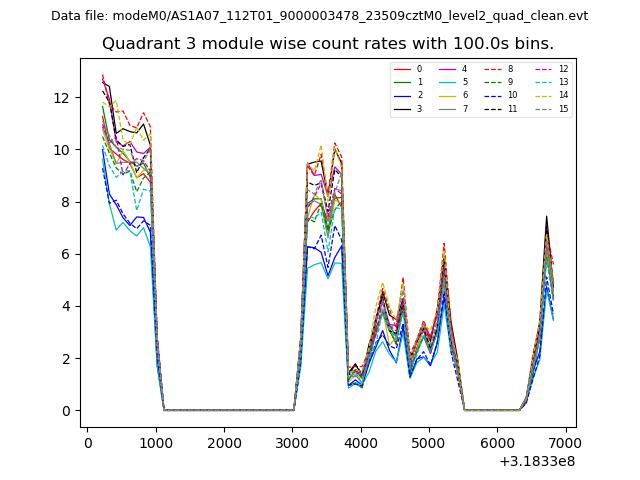
| Quadrant-wise count rates Data is divided into 100 sec bins |
 |
|
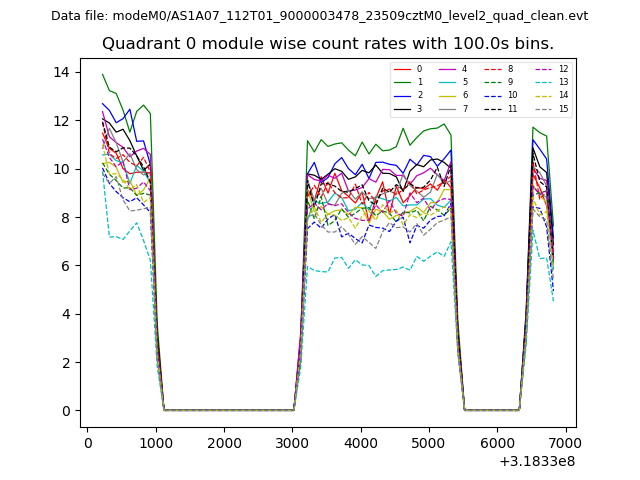
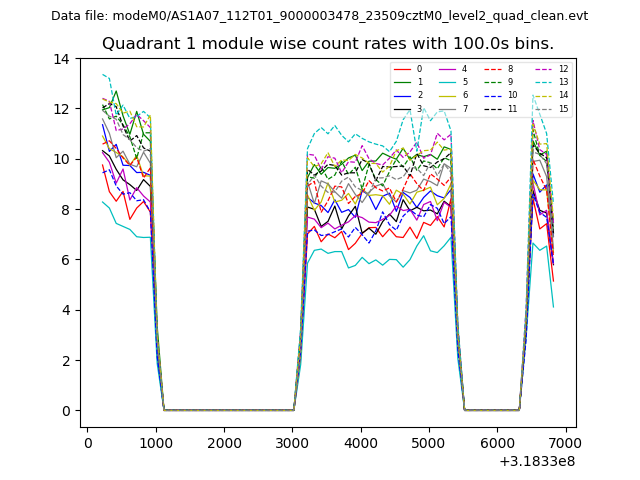
| Module-wise count rates for Quadrant A Data is divided into 100 sec bins |
 |
 |
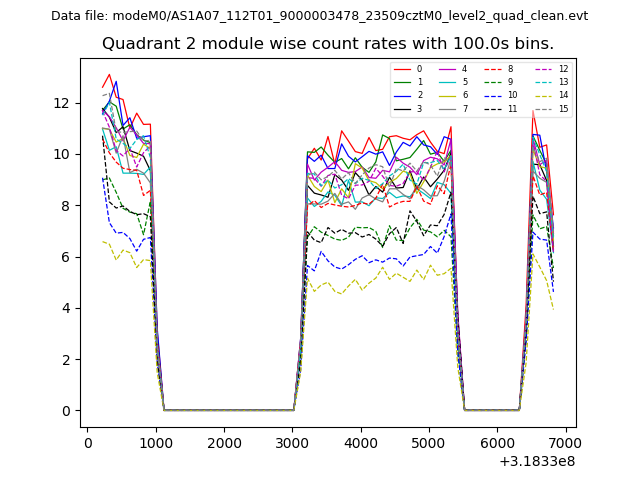
| Module-wise count rates for Quadrant B Data is divided into 100 sec bins |
 |
 |
| Module-wise count rates for Quadrant C Data is divided into 100 sec bins |
 |
 |
| Module-wise count rates for Quadrant D Data is divided into 100 sec bins |
 |
 |
| Parameter | Plot |
|---|---|
| CZT HV Monitor | 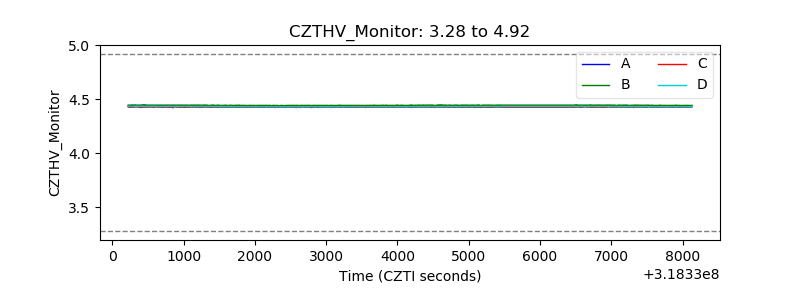 |
| D_VDD | 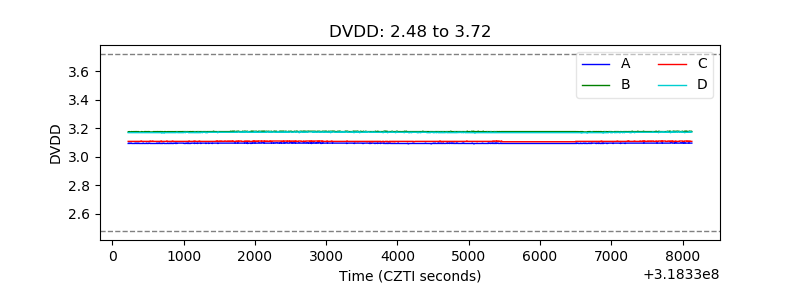 |
| Temperature 1 | 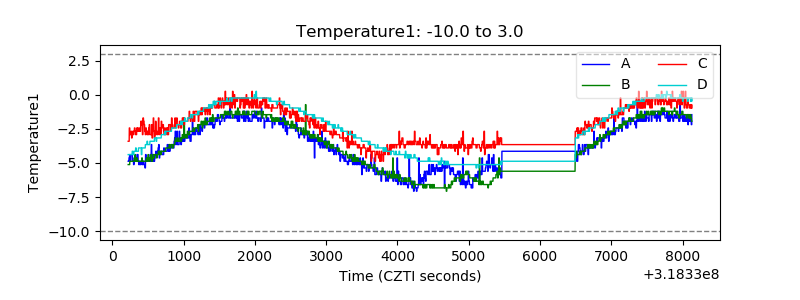 |
| Veto HV Monitor | 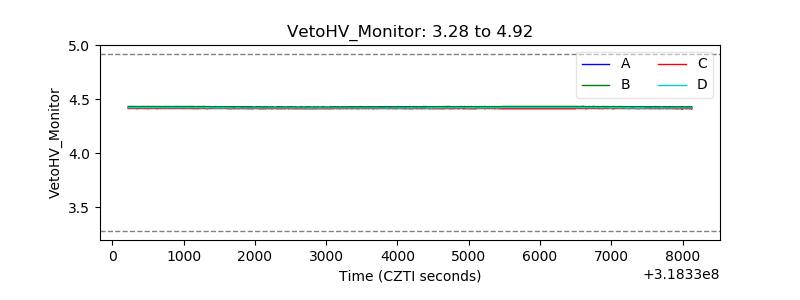 |
| Veto LLD | 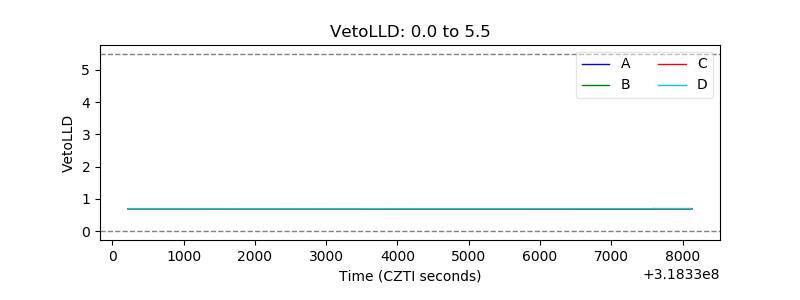 |
| Alpha Counter |  |
| _CPM_Rate | 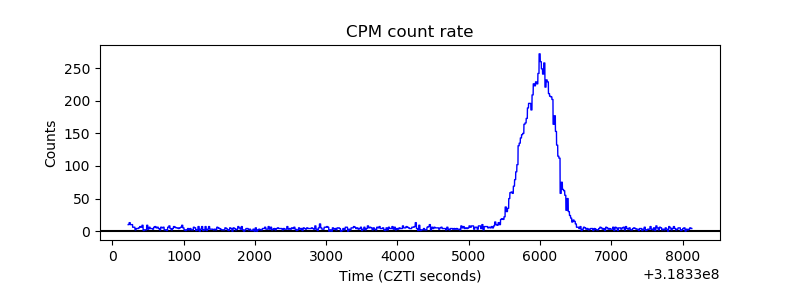 |
| CZT Counter | 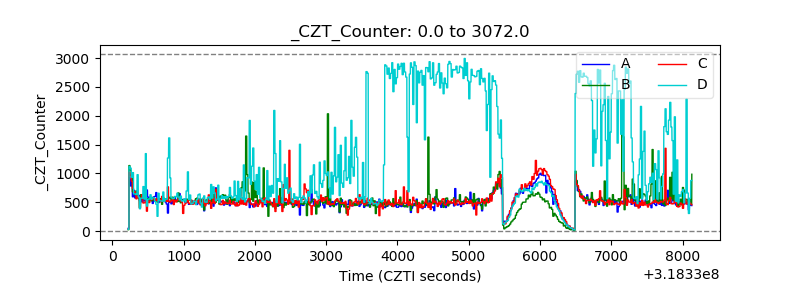 |
| +2.5 Volts monitor |  |
| +5 Volts monitor |  |
| _ROLL_ROT | 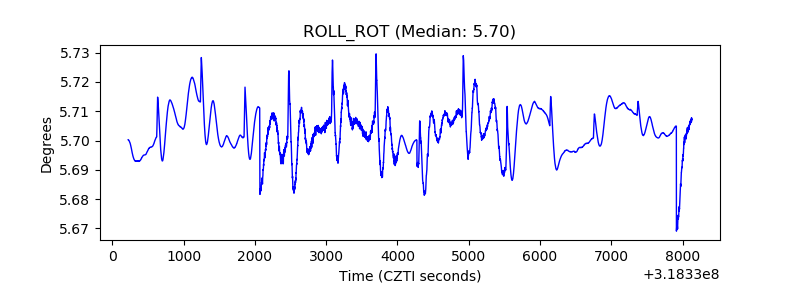 |
| _Roll_DEC | 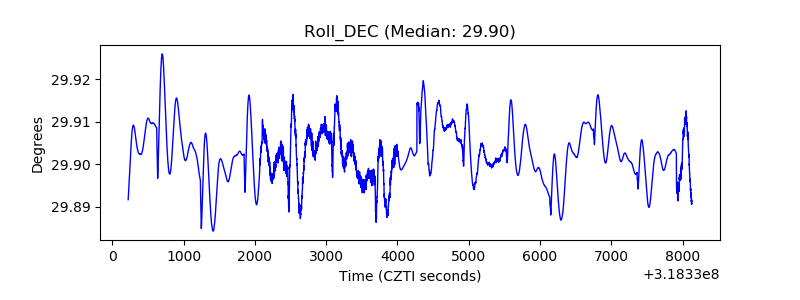 |
| _Roll_RA | 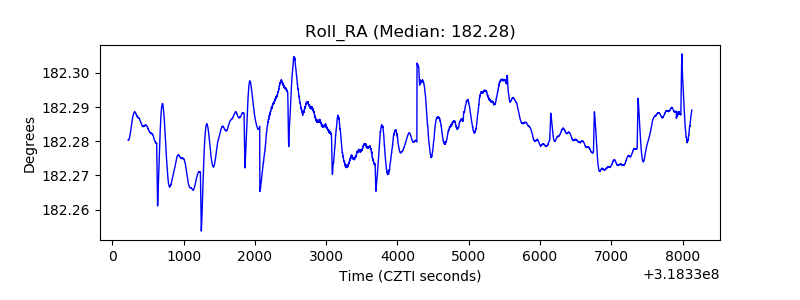 |
| Veto Counter | 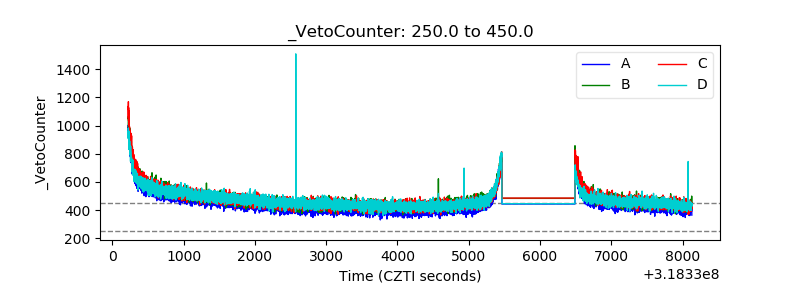 |