| Param | Original file | Final file |
|---|---|---|
| Filename | modeM0/AS1A07_112T01_9000003478_23511cztM0_level2.evt | modeM0/AS1A07_112T01_9000003478_23511cztM0_level2_quad_clean.evt |
| Size (bytes) | 665,910,720 | 79,977,600 |
| Size | 635.1 MB | 76.3 MB |
| Events in quadrant A | 3,651,779 | 491,104 |
| Events in quadrant B | 3,999,283 | 494,531 |
| Events in quadrant C | 4,096,048 | 478,034 |
| Events in quadrant D | 7,909,948 | 433,665 |
| Mode SS | |||
|---|---|---|---|
| Quadrant | BADHDUFLAG | Total packets | Discarded packets |
| A | 0 | 154 | 0 |
| B | 0 | 154 | 0 |
| C | 0 | 154 | 0 |
| D | 0 | 154 | 0 |
| Mode M0 | |||
|---|---|---|---|
| Quadrant | BADHDUFLAG | Total packets | Discarded packets |
| A | 0 | 15634 | 3 |
| B | 0 | 16572 | 2 |
| C | 0 | 16901 | 2 |
| D | 0 | 28713 | 2 |
| Mode M9 | |||
|---|---|---|---|
| Quadrant | BADHDUFLAG | Total packets | Discarded packets |
| A | 0 | 9 | 0 |
| B | 0 | 9 | 0 |
| C | 0 | 9 | 0 |
| D | 0 | 9 | 0 |
| Quadrant | Total seconds | Saturated seconds | Saturation percentage |
|---|---|---|---|
| A | 7534 | 129 | 1.712238% |
| B | 7535 | 181 | 2.402123% |
| C | 7535 | 287 | 3.808892% |
| D | 7535 | 1351 | 17.929662% |
Noise dominated data is calculated using 1-second bins in cleaned event files. If a bin has >2000 counts, and if more than 50% of those come from <1% of pixels, then it is considered to be noise-dominated and hence unusable.
| Quadrant | # 1 sec bins | Bins with >0 counts | Bins with >2000 counts | High rate bins dominated by noise | Noise dominated (total time) | Noise dominated (detector-on time) | Marked lightcurve |
|---|---|---|---|---|---|---|---|
| A | 8434 | 7534 | 0 | 0 | 0.00% | 0.00% | 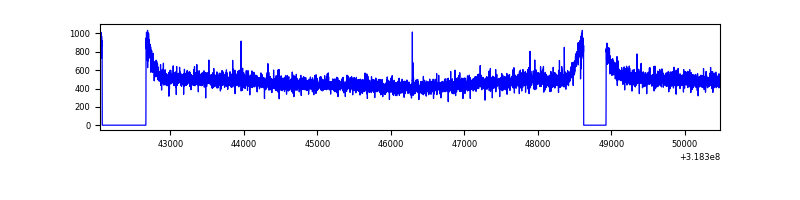 |
| B | 8435 | 7535 | 15 | 15 | 0.18% | 0.20% | 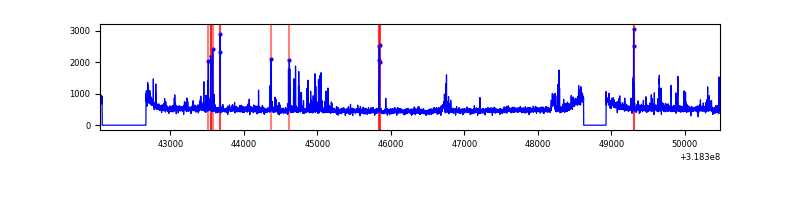 |
| C | 8435 | 7535 | 64 | 64 | 0.76% | 0.85% | 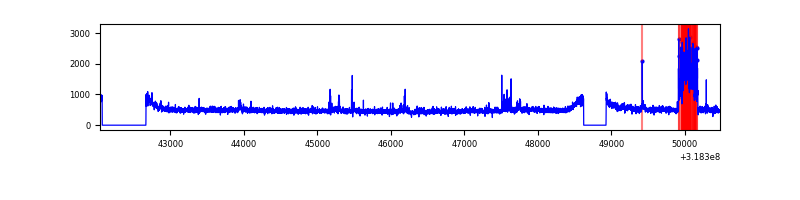 |
| D | 8435 | 7536 | 1109 | 1109 | 13.15% | 14.72% | 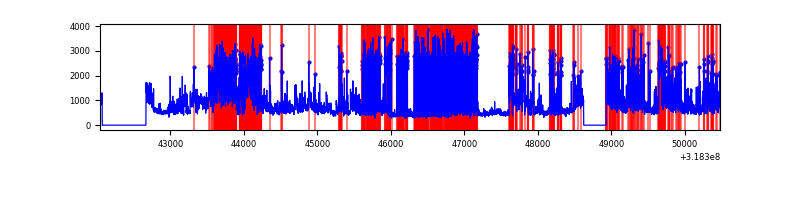 |
Top three noisy pixels from each quadrant. If the there are fewer than three noisy pixels in the level2.evt file, extra rows are filled as -1
| Pixel properties | Quadrant properties | ||||||
|---|---|---|---|---|---|---|---|
| Quadrant | DetID | PixID | Counts | Sigma | Mean | Median | Sigma |
| A | 13 | 254 | 12200 | 58.95 | 947 | 926 | 191.3 |
| A | 3 | 137 | 8248 | 38.28 | 947 | 926 | 191.3 |
| A | 0 | 226 | 8042 | 37.21 | 947 | 926 | 191.3 |
| B | 0 | 189 | 218739 | 1219.87 | 936 | 914 | 178.6 |
| B | 15 | 32 | 30554 | 165.99 | 936 | 914 | 178.6 |
| B | 0 | 230 | 30048 | 163.16 | 936 | 914 | 178.6 |
| C | 8 | 208 | 310935 | 1457.68 | 898 | 901 | 212.7 |
| C | 14 | 238 | 141094 | 659.14 | 898 | 901 | 212.7 |
| C | 7 | 247 | 70311 | 326.34 | 898 | 901 | 212.7 |
| D | 1 | 52 | 3879005 | 18234.83 | 867 | 838 | 212.7 |
| D | 9 | 85 | 398571 | 1870.11 | 867 | 838 | 212.7 |
| D | 7 | 238 | 209465 | 980.95 | 867 | 838 | 212.7 |
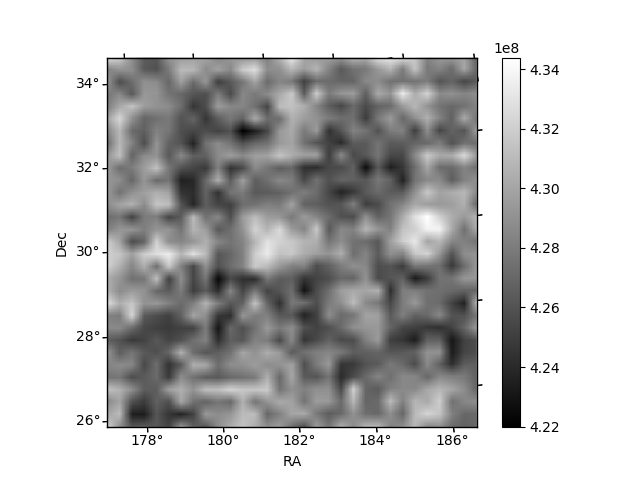
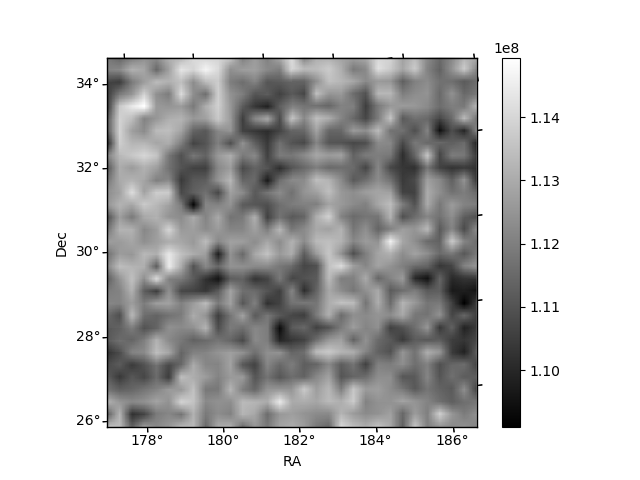
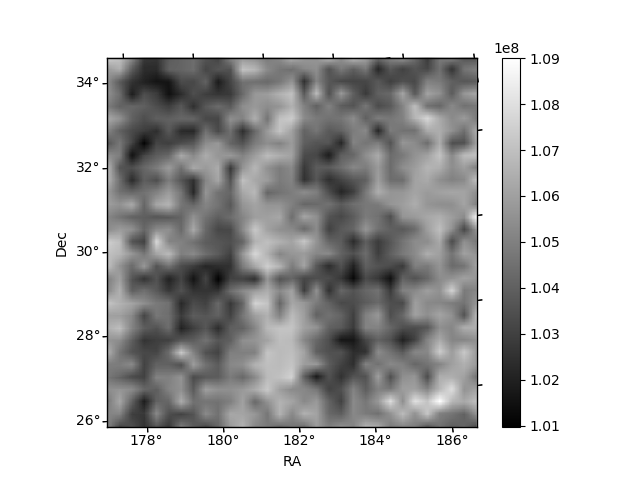
Histogram calculated using DETX and DETY for each event in the final _common_clean file
| Quadrant A | 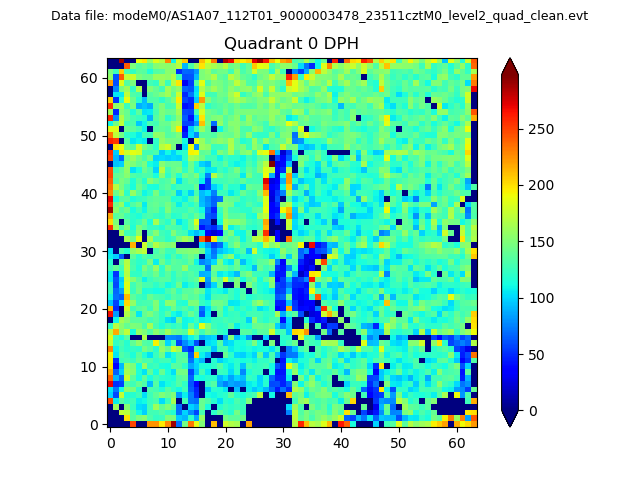 |
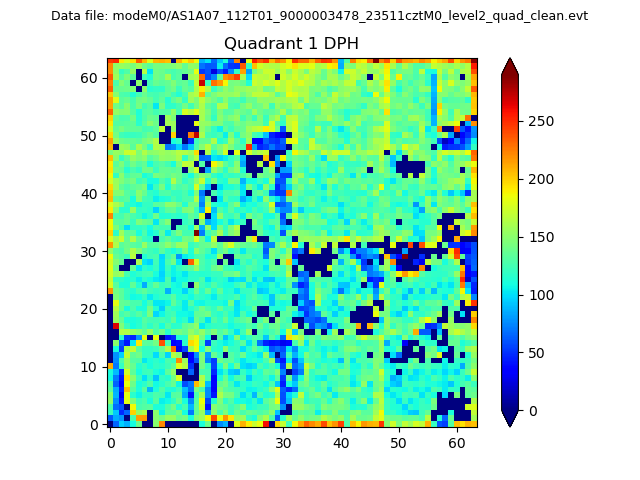 |
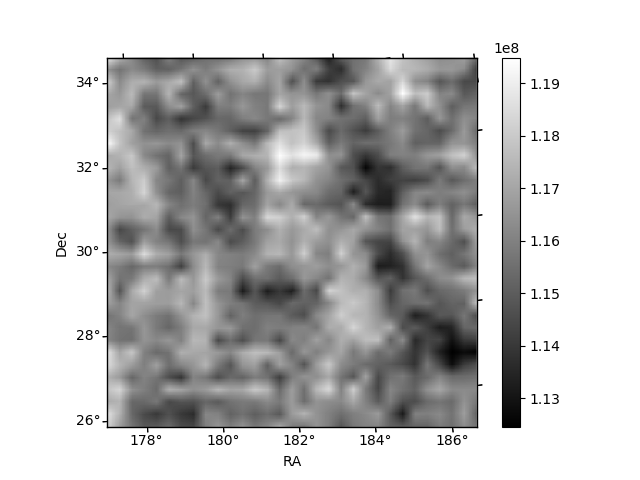
Quadrant B |
|---|---|---|---|
| Quadrant D | 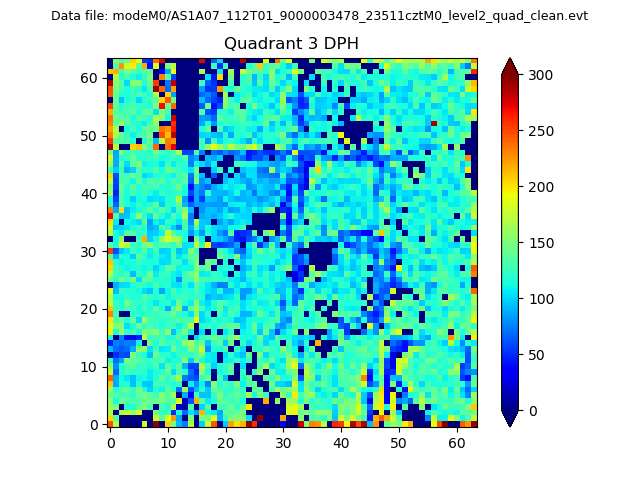 |
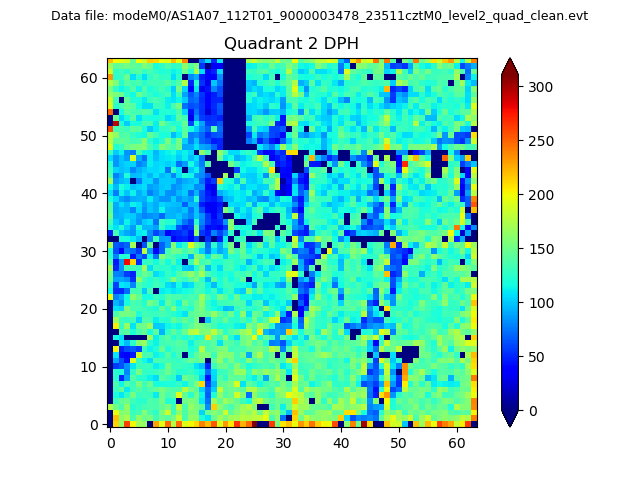 |
Quadrant C |
| Plot type | Count rate plots | Images |
|---|---|---|
| Comparison with Poisson distribution Blue bars denote a histogram of data divided into 1 sec bins. Red curve is a Poisson curve with rate = median count rate of data. |
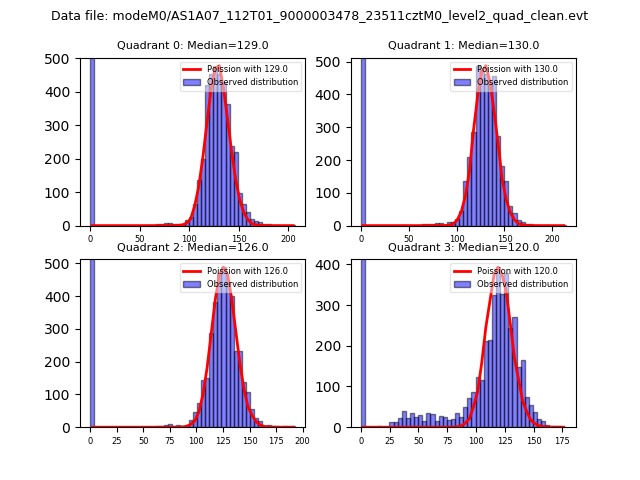 |
 |
| Quadrant-wise count rates Data is divided into 100 sec bins |
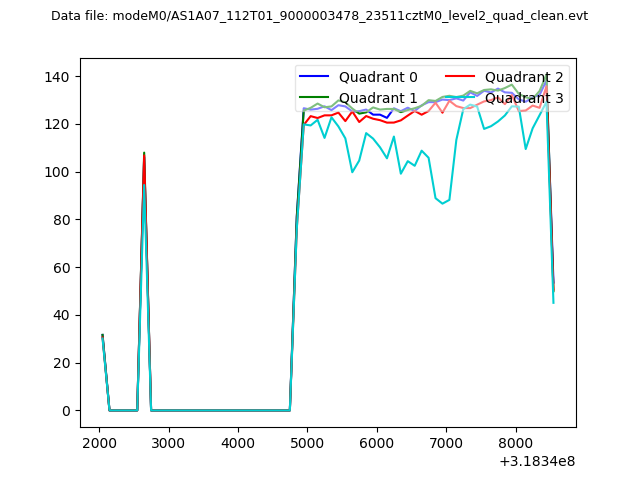 |
|
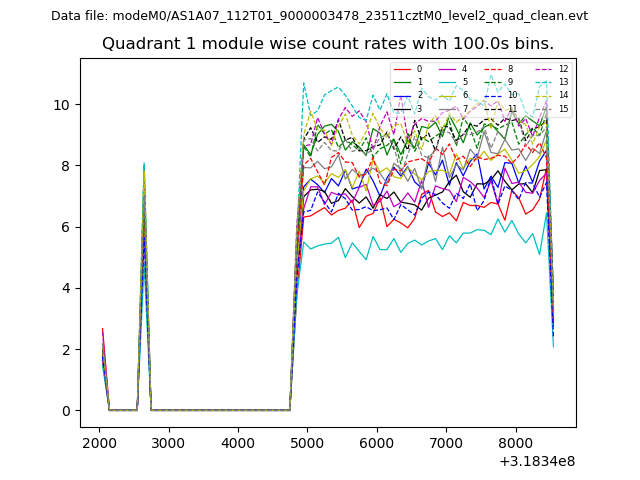
| Module-wise count rates for Quadrant A Data is divided into 100 sec bins |
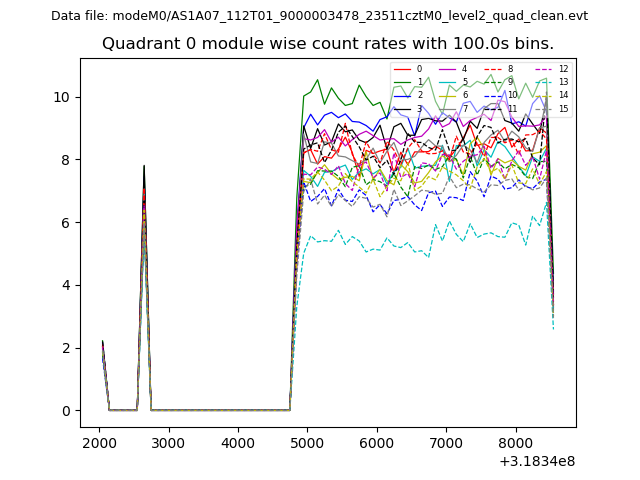 |
 |
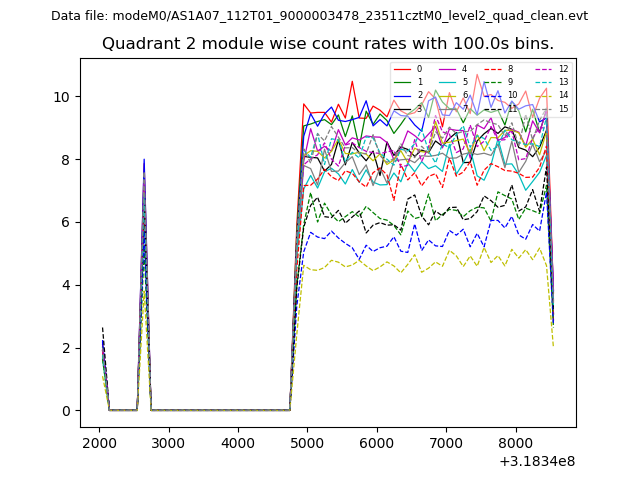
| Module-wise count rates for Quadrant B Data is divided into 100 sec bins |
 |
 |
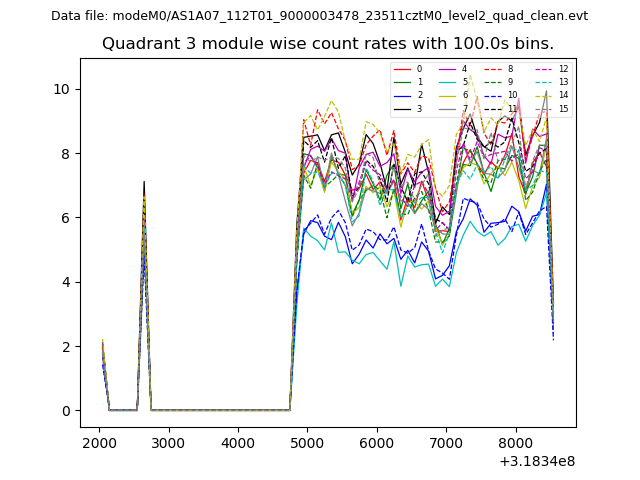
| Module-wise count rates for Quadrant C Data is divided into 100 sec bins |
 |
 |
| Module-wise count rates for Quadrant D Data is divided into 100 sec bins |
 |
 |
| Parameter | Plot |
|---|---|
| CZT HV Monitor | 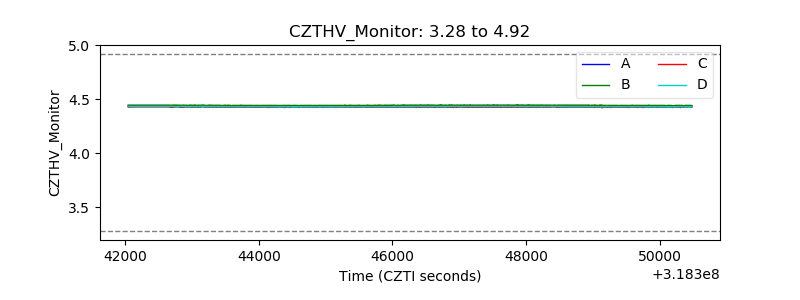 |
| D_VDD | 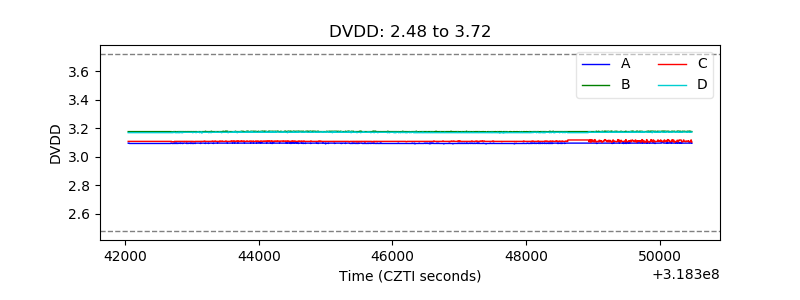 |
| Temperature 1 | 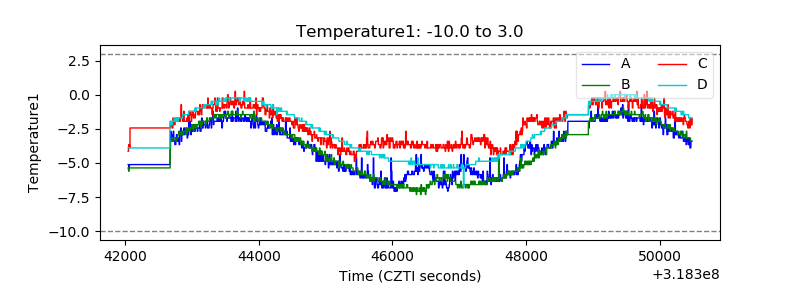 |
| Veto HV Monitor | 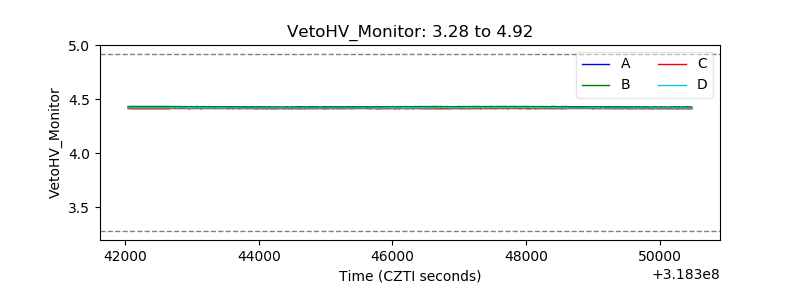 |
| Veto LLD | 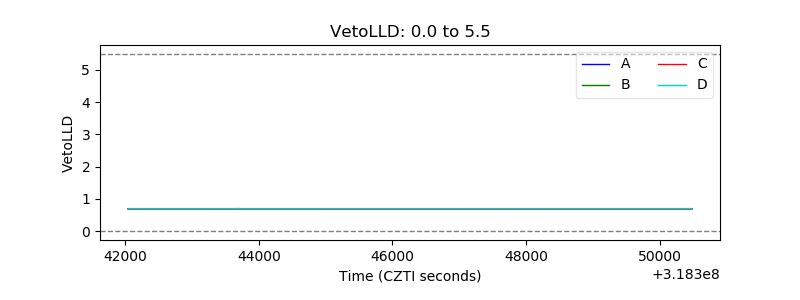 |
| Alpha Counter | 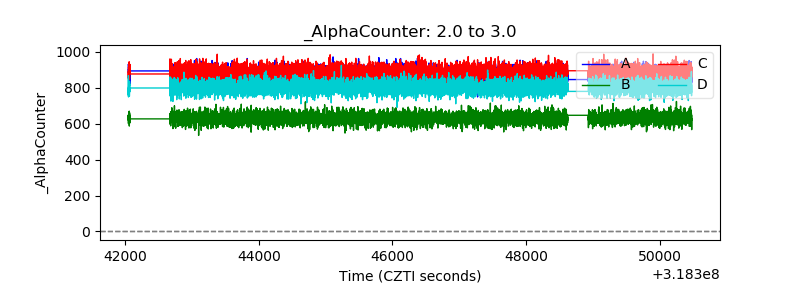 |
| _CPM_Rate | 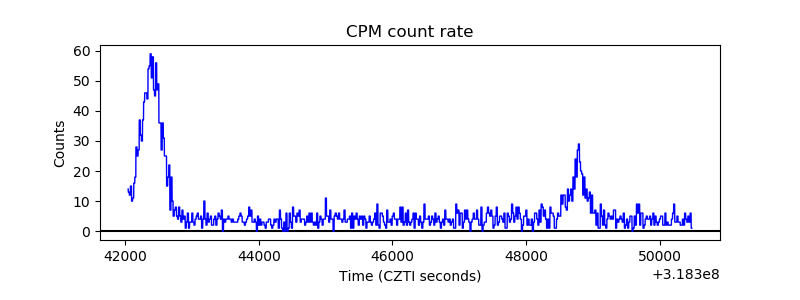 |
| CZT Counter | 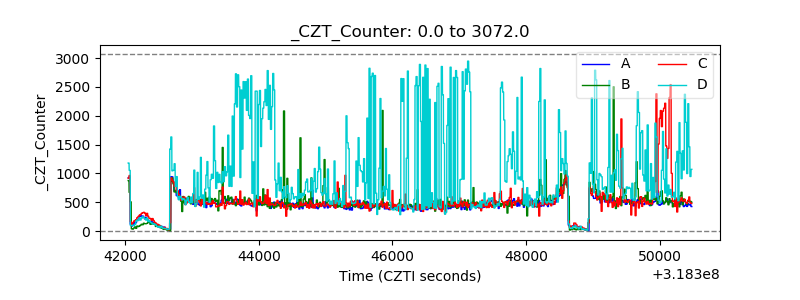 |
| +2.5 Volts monitor |  |
| +5 Volts monitor |  |
| _ROLL_ROT | 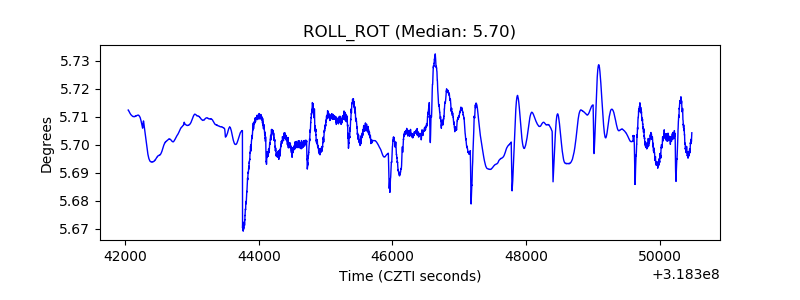 |
| _Roll_DEC | 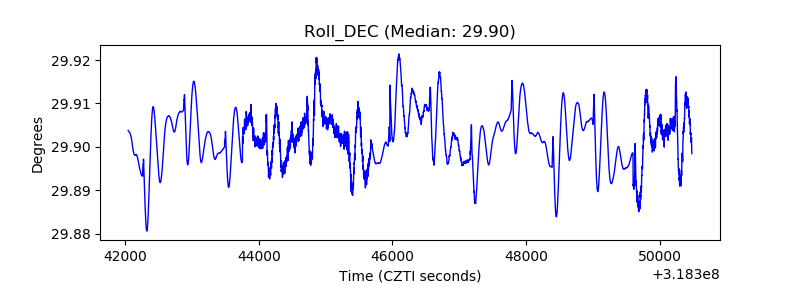 |
| _Roll_RA | 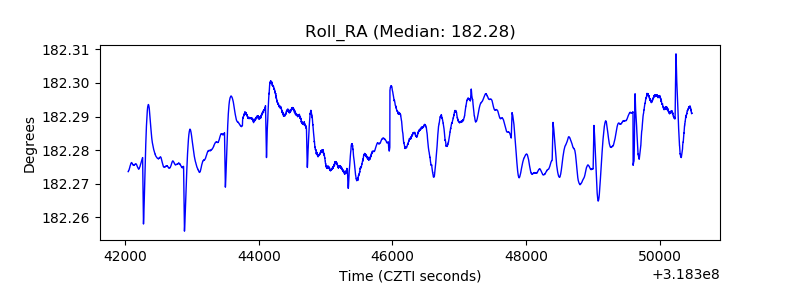 |
| Veto Counter | 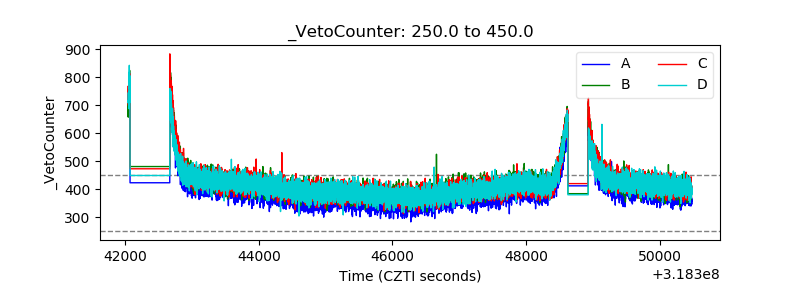 |