| Param | Original file | Final file |
|---|---|---|
| Filename | modeM0/AS1A07_112T01_9000003478_23512cztM0_level2.evt | modeM0/AS1A07_112T01_9000003478_23512cztM0_level2_quad_clean.evt |
| Size (bytes) | 265,394,880 | 32,630,400 |
| Size | 253.1 MB | 31.1 MB |
| Events in quadrant A | 1,389,185 | 199,558 |
| Events in quadrant B | 1,500,758 | 201,019 |
| Events in quadrant C | 1,751,509 | 193,322 |
| Events in quadrant D | 3,185,181 | 174,147 |
| Mode SS | |||
|---|---|---|---|
| Quadrant | BADHDUFLAG | Total packets | Discarded packets |
| A | 0 | 62 | 0 |
| B | 0 | 62 | 0 |
| C | 0 | 62 | 0 |
| D | 0 | 62 | 0 |
| Mode M0 | |||
|---|---|---|---|
| Quadrant | BADHDUFLAG | Total packets | Discarded packets |
| A | 0 | 6185 | 0 |
| B | 0 | 6454 | 0 |
| C | 0 | 7187 | 0 |
| D | 0 | 11617 | 0 |
| Quadrant | Total seconds | Saturated seconds | Saturation percentage |
|---|---|---|---|
| A | 3079 | 2 | 0.064956% |
| B | 3080 | 8 | 0.259740% |
| C | 3080 | 112 | 3.636364% |
| D | 3080 | 401 | 13.019481% |
Noise dominated data is calculated using 1-second bins in cleaned event files. If a bin has >2000 counts, and if more than 50% of those come from <1% of pixels, then it is considered to be noise-dominated and hence unusable.
| Quadrant | # 1 sec bins | Bins with >0 counts | Bins with >2000 counts | High rate bins dominated by noise | Noise dominated (total time) | Noise dominated (detector-on time) | Marked lightcurve |
|---|---|---|---|---|---|---|---|
| A | 3079 | 3079 | 0 | 0 | 0.00% | 0.00% | 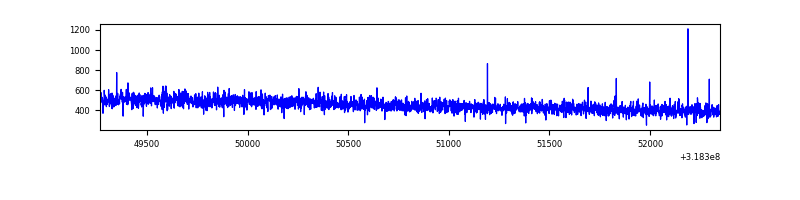 |
| B | 3080 | 3080 | 2 | 2 | 0.06% | 0.06% | 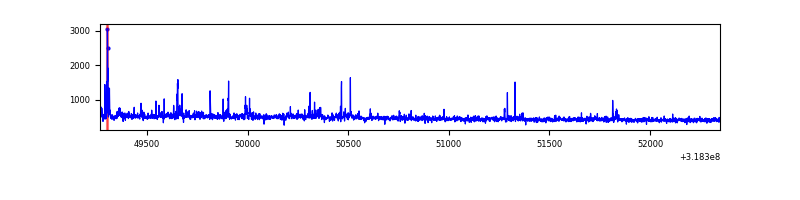 |
| C | 3080 | 3080 | 64 | 64 | 2.08% | 2.08% | 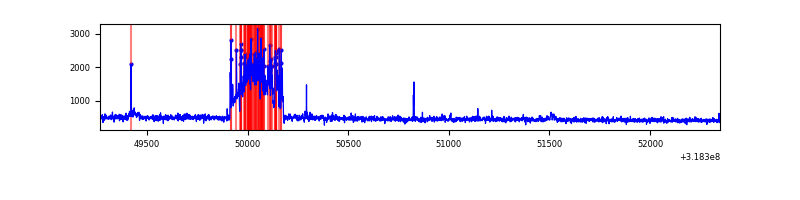 |
| D | 3080 | 3080 | 408 | 408 | 13.25% | 13.25% | 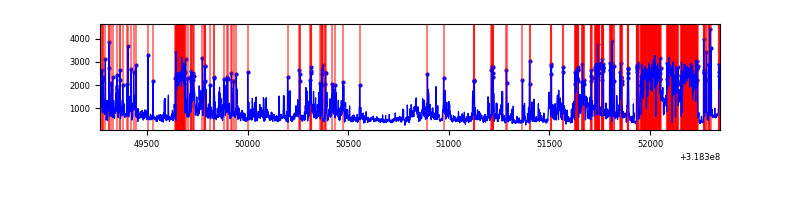 |
Top three noisy pixels from each quadrant. If the there are fewer than three noisy pixels in the level2.evt file, extra rows are filled as -1
| Pixel properties | Quadrant properties | ||||||
|---|---|---|---|---|---|---|---|
| Quadrant | DetID | PixID | Counts | Sigma | Mean | Median | Sigma |
| A | 13 | 254 | 5336 | 67.14 | 360 | 352 | 74.2 |
| A | 0 | 226 | 3188 | 38.21 | 360 | 352 | 74.2 |
| A | 3 | 137 | 3117 | 37.25 | 360 | 352 | 74.2 |
| B | 0 | 189 | 39591 | 564.93 | 359 | 351 | 69.5 |
| B | 0 | 228 | 12276 | 171.68 | 359 | 351 | 69.5 |
| B | 0 | 229 | 10025 | 139.28 | 359 | 351 | 69.5 |
| C | 8 | 208 | 310278 | 3776.77 | 344 | 346 | 82.1 |
| C | 14 | 238 | 54098 | 655.01 | 344 | 346 | 82.1 |
| C | 9 | 54 | 15448 | 184.03 | 344 | 346 | 82.1 |
| D | 1 | 52 | 1521417 | 18072.0 | 337 | 326 | 84.2 |
| D | 9 | 85 | 280071 | 3323.63 | 337 | 326 | 84.2 |
| D | 12 | 233 | 45595 | 537.84 | 337 | 326 | 84.2 |
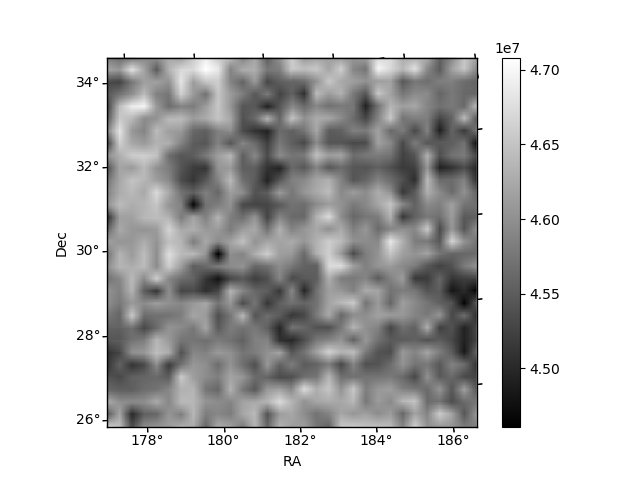
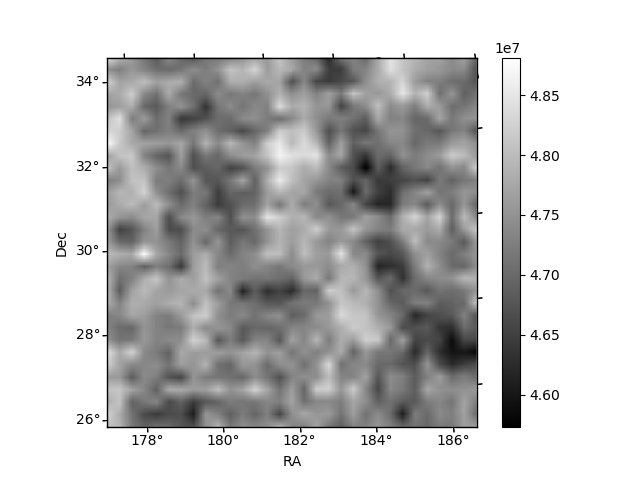
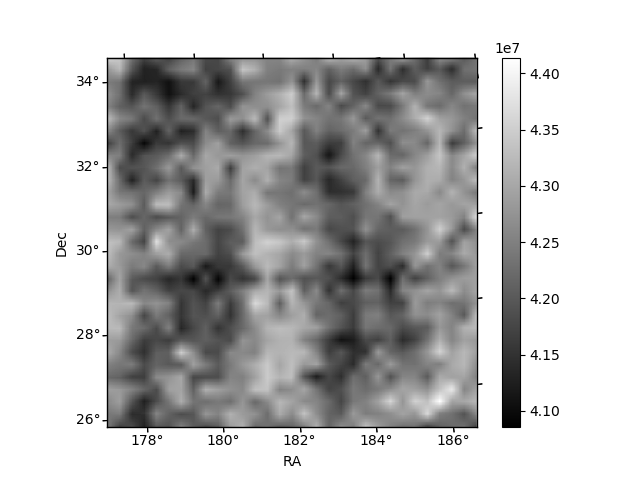
Histogram calculated using DETX and DETY for each event in the final _common_clean file
| Quadrant A | 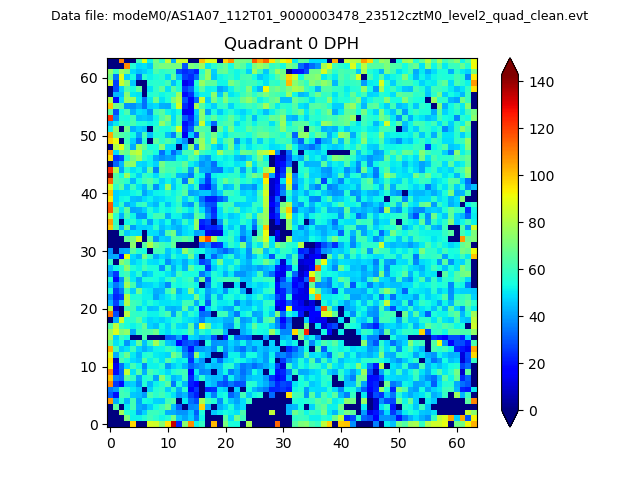 |
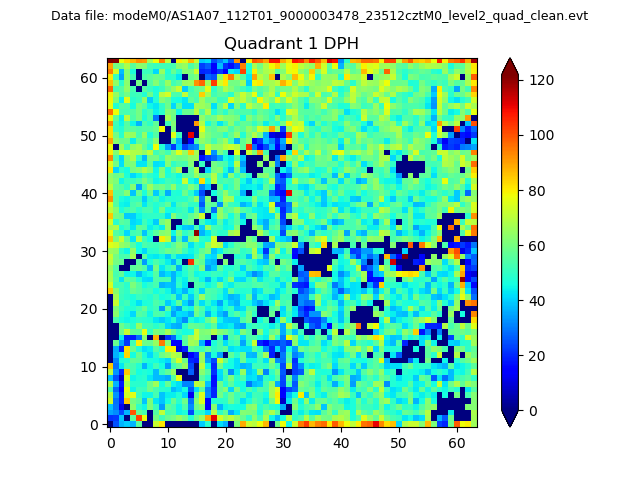 |
Quadrant B |
|---|---|---|---|
| Quadrant D |  |
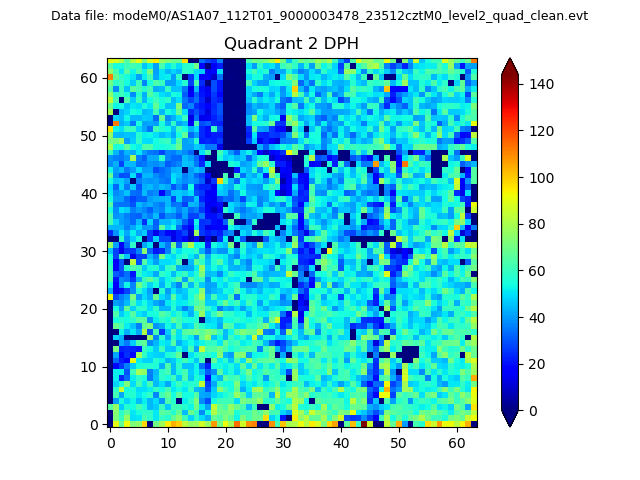 |
Quadrant C |
| Plot type | Count rate plots | Images |
|---|---|---|
| Comparison with Poisson distribution Blue bars denote a histogram of data divided into 1 sec bins. Red curve is a Poisson curve with rate = median count rate of data. |
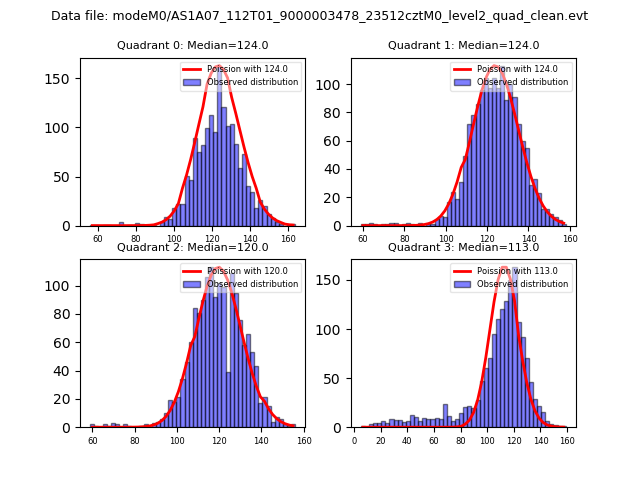 |
 |
| Quadrant-wise count rates Data is divided into 100 sec bins |
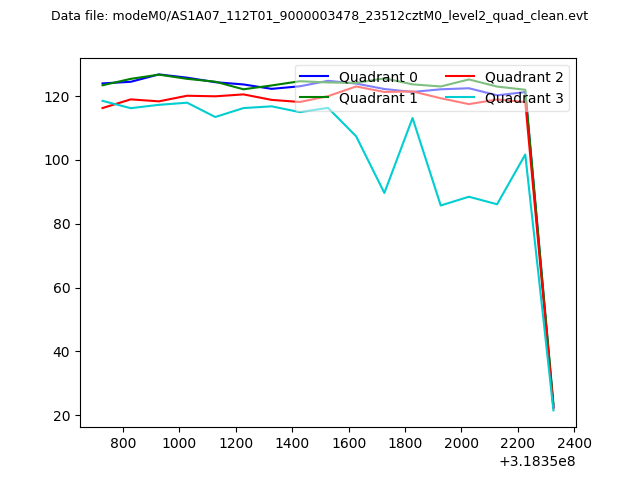 |
|
| Module-wise count rates for Quadrant A Data is divided into 100 sec bins |
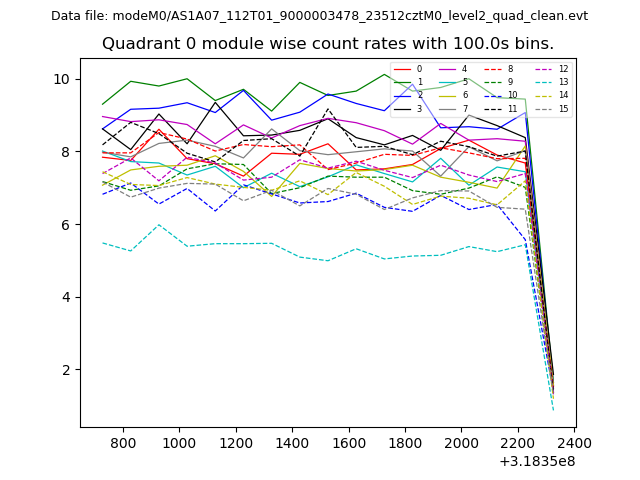 |
 |
| Module-wise count rates for Quadrant B Data is divided into 100 sec bins |
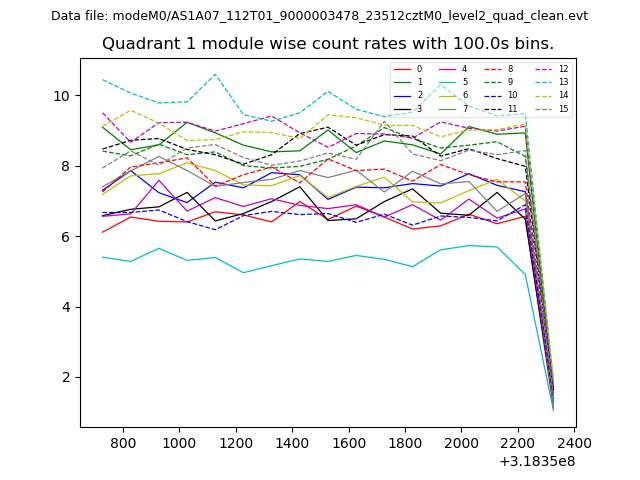 |
 |
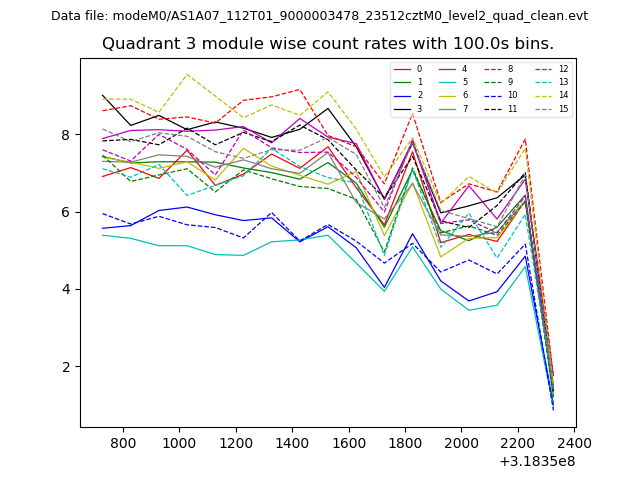
| Module-wise count rates for Quadrant C Data is divided into 100 sec bins |
 |
 |
| Module-wise count rates for Quadrant D Data is divided into 100 sec bins |
 |
 |
| Parameter | Plot |
|---|---|
| CZT HV Monitor |  |
| D_VDD | 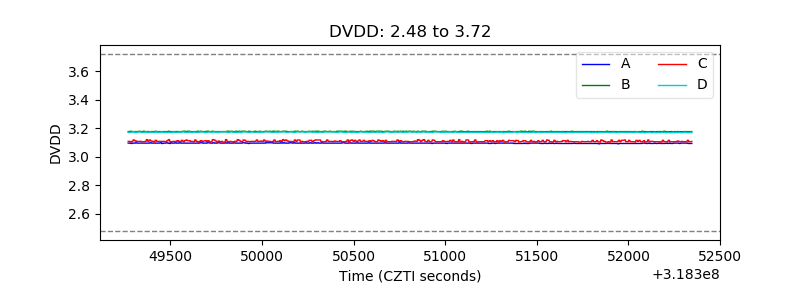 |
| Temperature 1 | 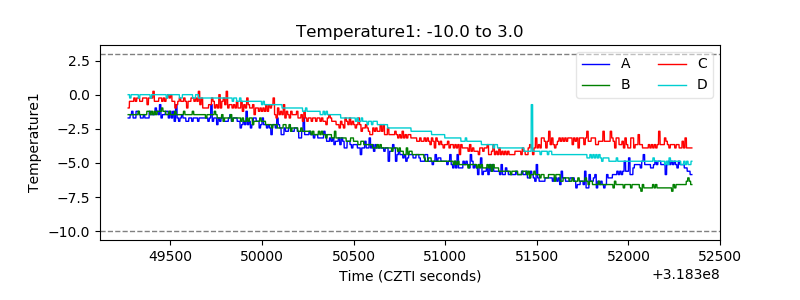 |
| Veto HV Monitor | 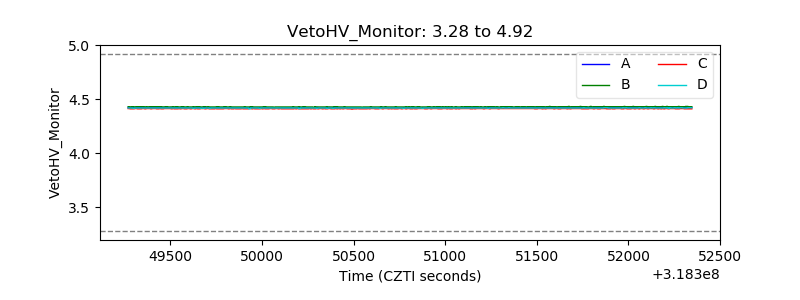 |
| Veto LLD |  |
| Alpha Counter | 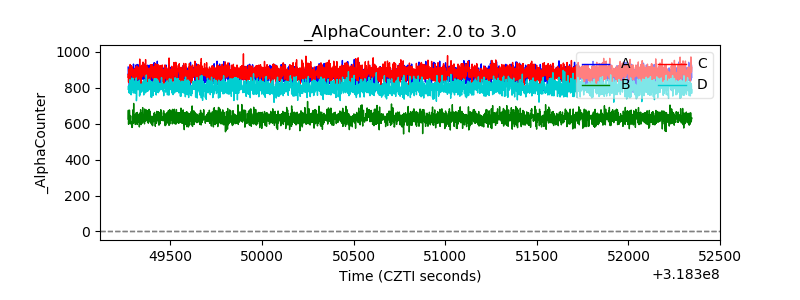 |
| _CPM_Rate | 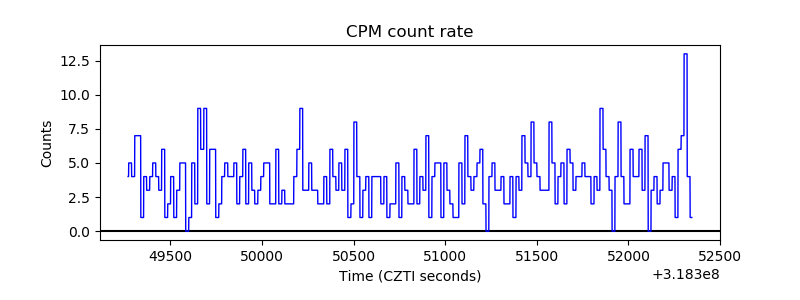 |
| CZT Counter |  |
| +2.5 Volts monitor |  |
| +5 Volts monitor | 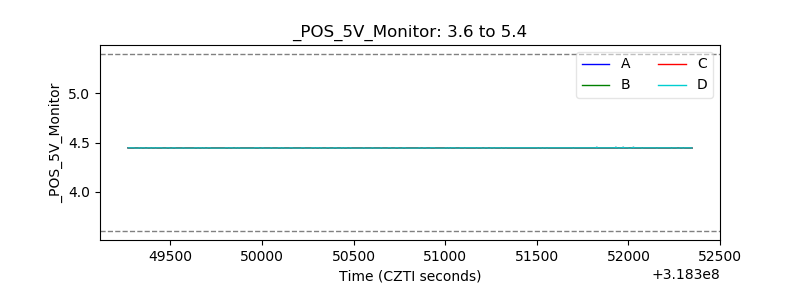 |
| _ROLL_ROT | 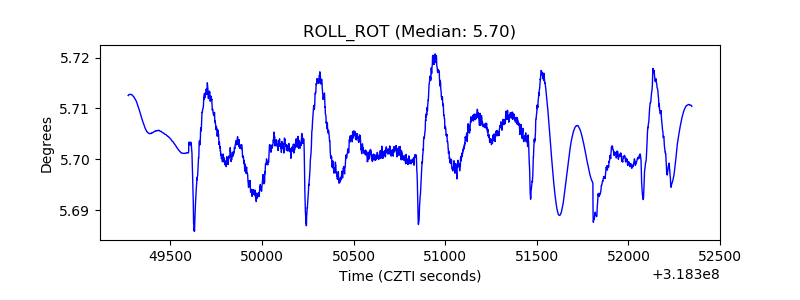 |
| _Roll_DEC | 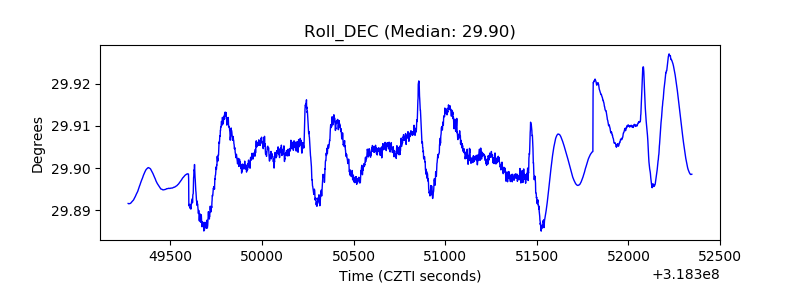 |
| _Roll_RA |  |
| Veto Counter | 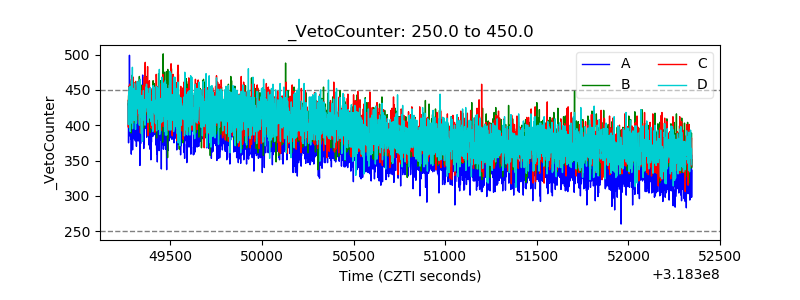 |