| Param | Original file | Final file |
|---|---|---|
| Filename | modeM0/AS1A07_112T01_9000003478_23681cztM0_level2.evt | modeM0/AS1A07_112T01_9000003478_23681cztM0_level2_quad_clean.evt |
| Size (bytes) | 7,050,240 | 2,664,000 |
| Size | 6.7 MB | 2.5 MB |
| Events in quadrant A | 50,629 | 15,894 |
| Events in quadrant B | 50,089 | 15,802 |
| Events in quadrant C | 51,543 | 15,853 |
| Events in quadrant D | 49,388 | 15,642 |
| Mode SS | |||
|---|---|---|---|
| Quadrant | BADHDUFLAG | Total packets | Discarded packets |
| A | 0 | 4 | 2 |
| B | 0 | 4 | 2 |
| C | 0 | 4 | 2 |
| D | 0 | 4 | 2 |
| Mode M0 | |||
|---|---|---|---|
| Quadrant | BADHDUFLAG | Total packets | Discarded packets |
| A | 0 | 314 | 74 |
| B | 0 | 319 | 89 |
| C | 0 | 321 | 83 |
| D | 0 | 314 | 70 |
| Quadrant | Total seconds | Saturated seconds | Saturation percentage |
|---|---|---|---|
| A | 120 | 0 | 0.000000% |
| B | 115 | 0 | 0.000000% |
| C | 119 | 0 | 0.000000% |
| D | 120 | 0 | 0.000000% |
Noise dominated data is calculated using 1-second bins in cleaned event files. If a bin has >2000 counts, and if more than 50% of those come from <1% of pixels, then it is considered to be noise-dominated and hence unusable.
| Quadrant | # 1 sec bins | Bins with >0 counts | Bins with >2000 counts | High rate bins dominated by noise | Noise dominated (total time) | Noise dominated (detector-on time) | Marked lightcurve |
|---|---|---|---|---|---|---|---|
| A | 135 | 130 | 0 | 0 | 0.00% | 0.00% | 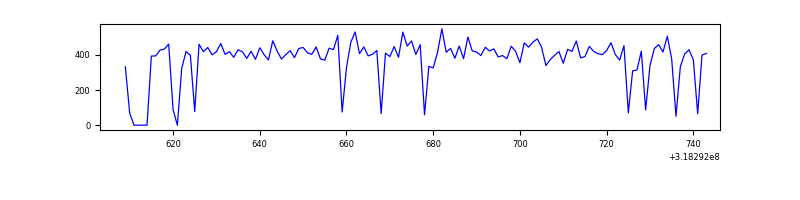 |
| B | 125 | 124 | 0 | 0 | 0.00% | 0.00% | 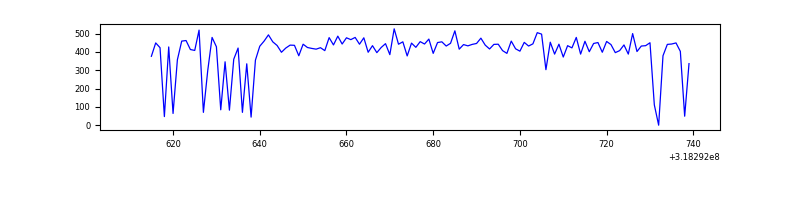 |
| C | 143 | 129 | 0 | 0 | 0.00% | 0.00% | 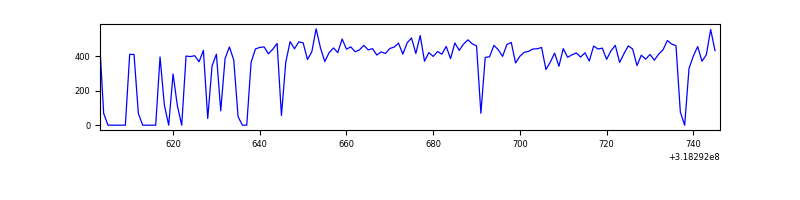 |
| D | 137 | 135 | 0 | 0 | 0.00% | 0.00% | 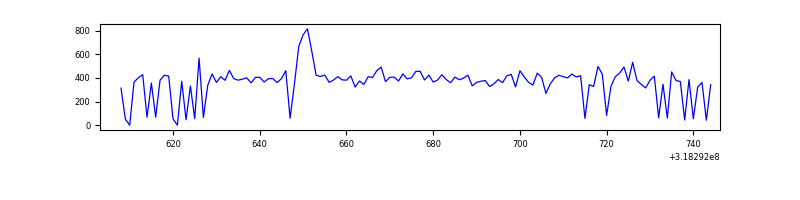 |
Top three noisy pixels from each quadrant. If the there are fewer than three noisy pixels in the level2.evt file, extra rows are filled as -1
| Pixel properties | Quadrant properties | ||||||
|---|---|---|---|---|---|---|---|
| Quadrant | DetID | PixID | Counts | Sigma | Mean | Median | Sigma |
| A | 13 | 254 | 222 | 45.53 | 13 | 12 | 4.6 |
| A | 3 | 137 | 114 | 22.11 | 13 | 12 | 4.6 |
| A | 12 | 194 | 96 | 18.21 | 13 | 12 | 4.6 |
| B | 12 | 111 | 276 | 63.44 | 12 | 12 | 4.2 |
| B | 14 | 111 | 249 | 56.95 | 12 | 12 | 4.2 |
| B | 11 | 111 | 236 | 53.83 | 12 | 12 | 4.2 |
| C | 14 | 238 | 2229 | 467.71 | 12 | 12 | 4.7 |
| C | 13 | 61 | 95 | 17.51 | 12 | 12 | 4.7 |
| C | 14 | 61 | 36 | 5.06 | 12 | 12 | 4.7 |
| D | 1 | 52 | 1770 | 372.28 | 12 | 12 | 4.7 |
| D | 2 | 234 | 574 | 119.01 | 12 | 12 | 4.7 |
| D | 8 | 195 | 142 | 27.53 | 12 | 12 | 4.7 |
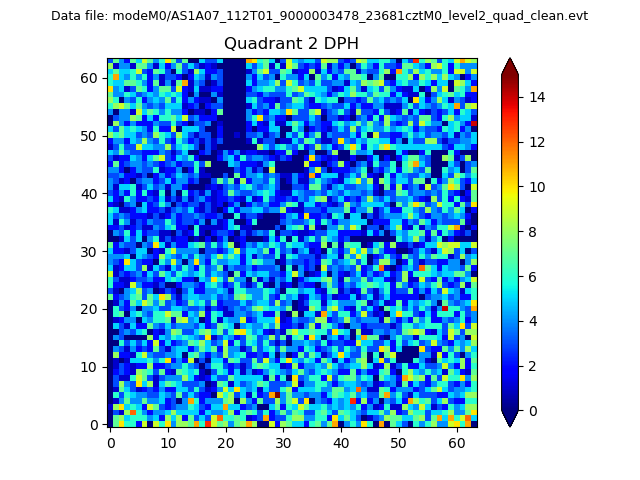
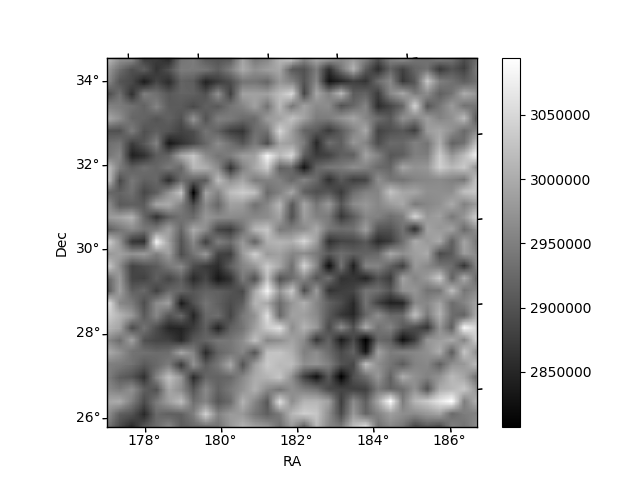
Histogram calculated using DETX and DETY for each event in the final _common_clean file
| Quadrant A | 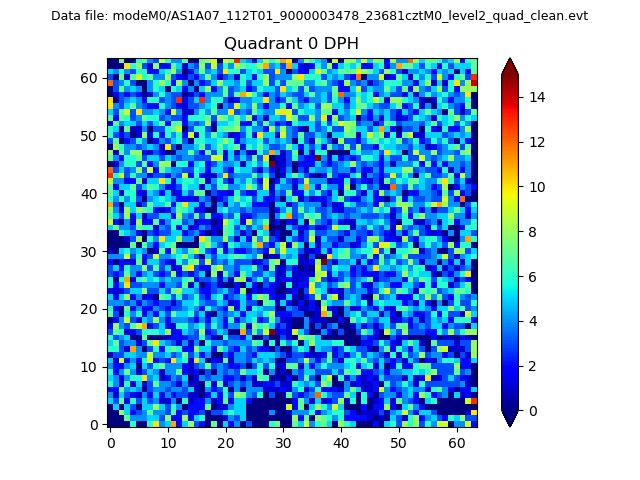 |
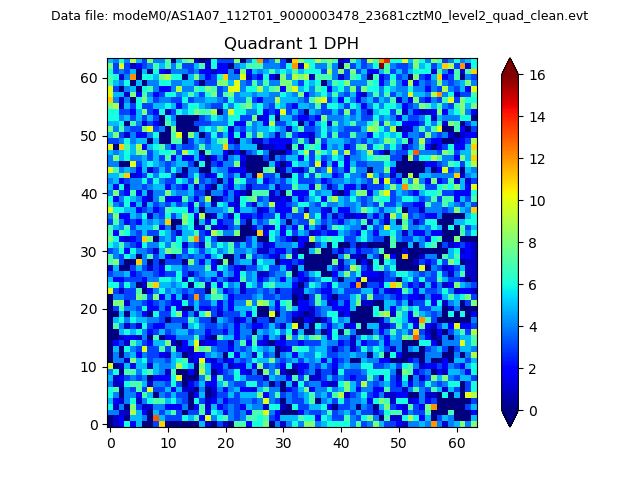 |
Quadrant B |
|---|---|---|---|
| Quadrant D | 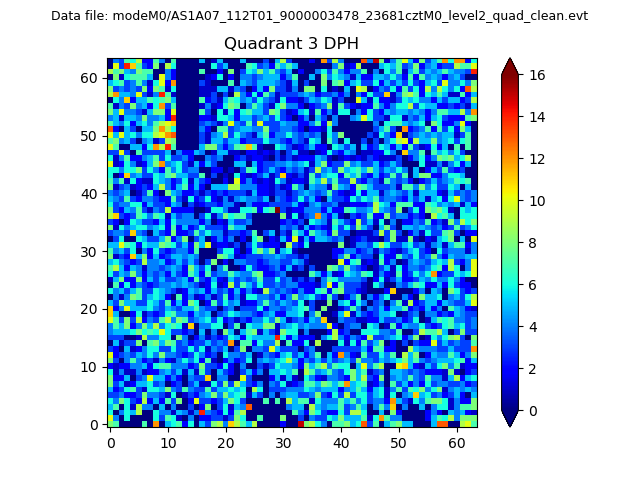 |
 |
Quadrant C |
| Plot type | Count rate plots | Images |
|---|---|---|
| Comparison with Poisson distribution Blue bars denote a histogram of data divided into 1 sec bins. Red curve is a Poisson curve with rate = median count rate of data. |
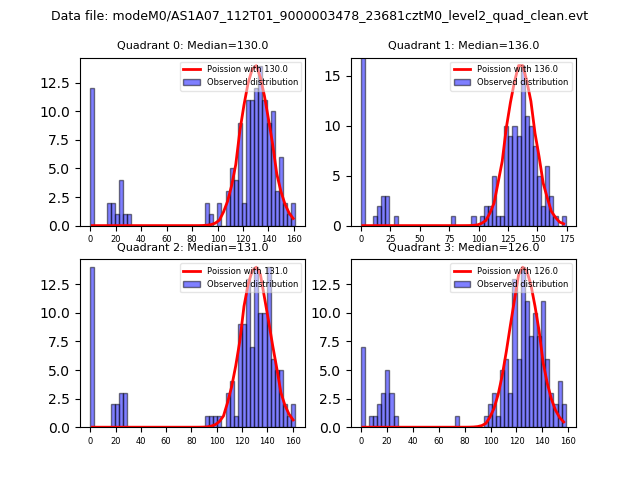 |
 |
| Quadrant-wise count rates Data is divided into 100 sec bins |
 |
|
| Module-wise count rates for Quadrant A Data is divided into 100 sec bins |
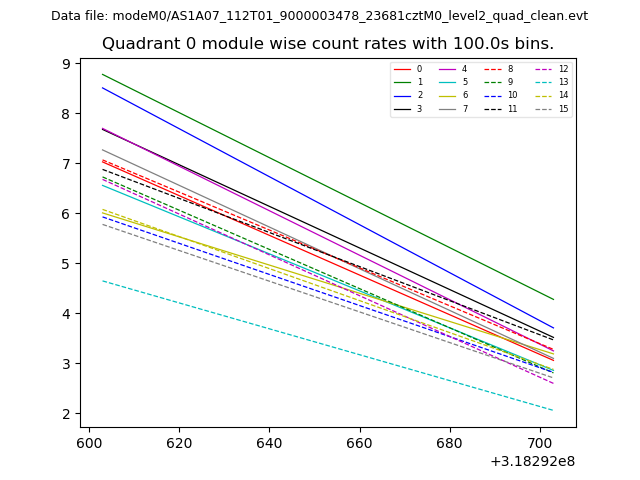 |
 |
| Module-wise count rates for Quadrant B Data is divided into 100 sec bins |
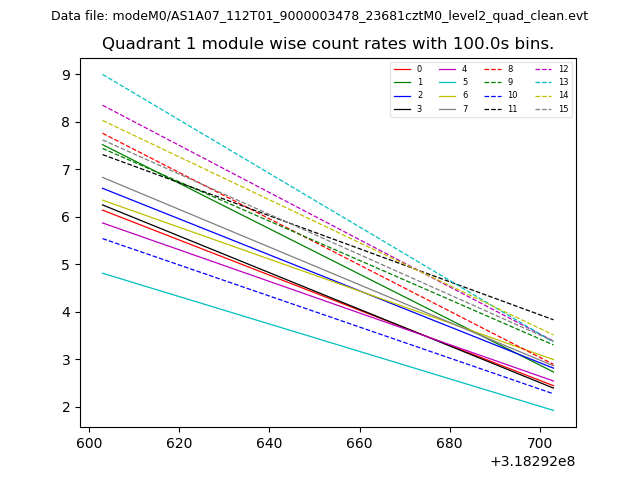 |
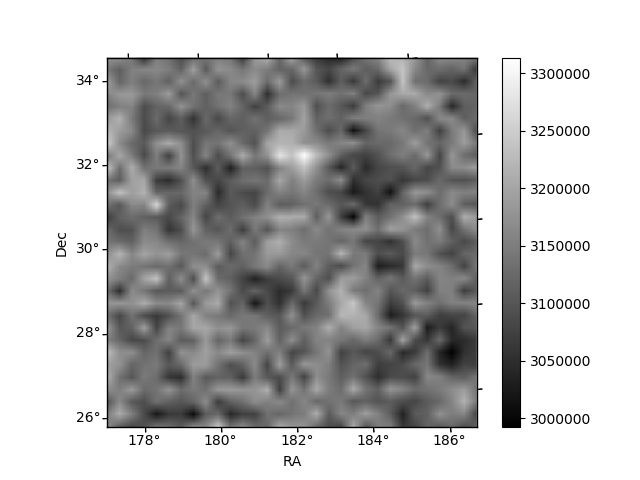 |
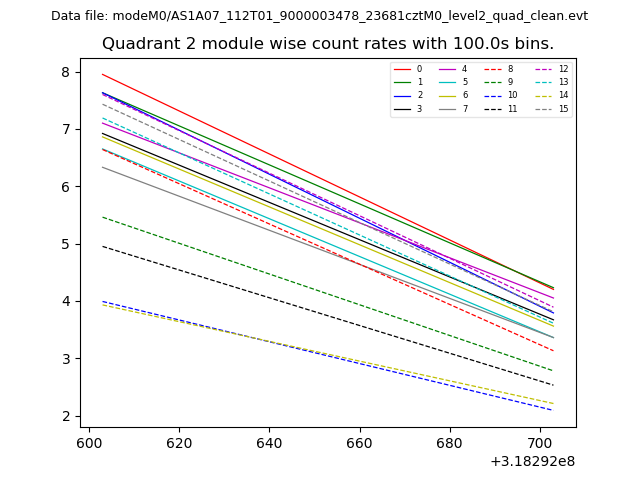
| Module-wise count rates for Quadrant C Data is divided into 100 sec bins |
 |
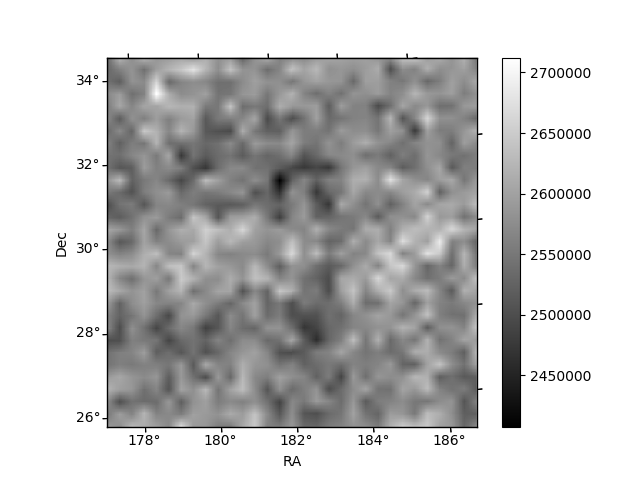 |
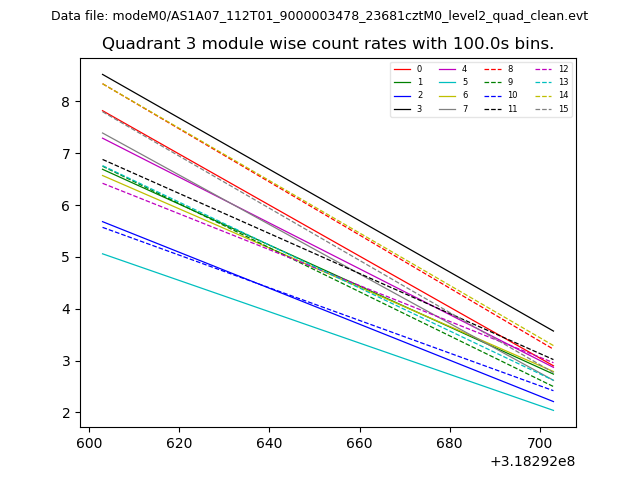
| Module-wise count rates for Quadrant D Data is divided into 100 sec bins |
 |
 |
| Parameter | Plot |
|---|---|
| CZT HV Monitor | 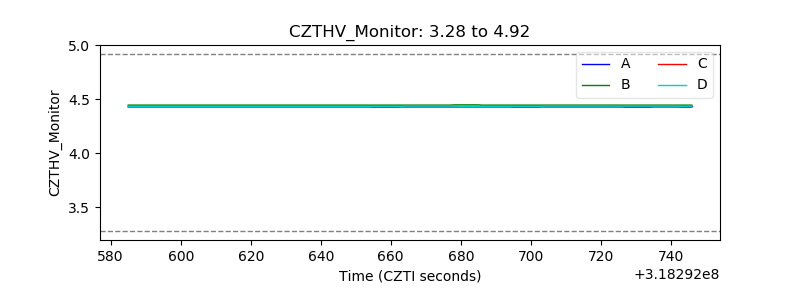 |
| D_VDD | 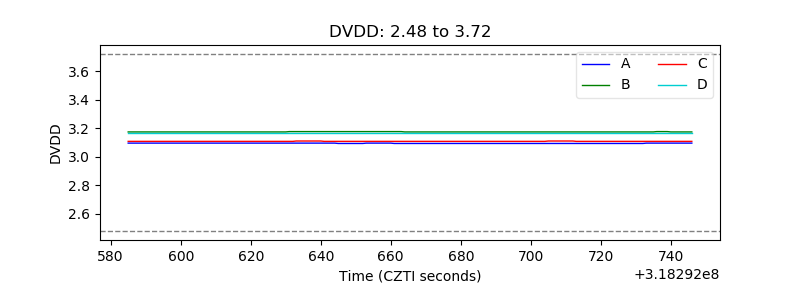 |
| Temperature 1 | 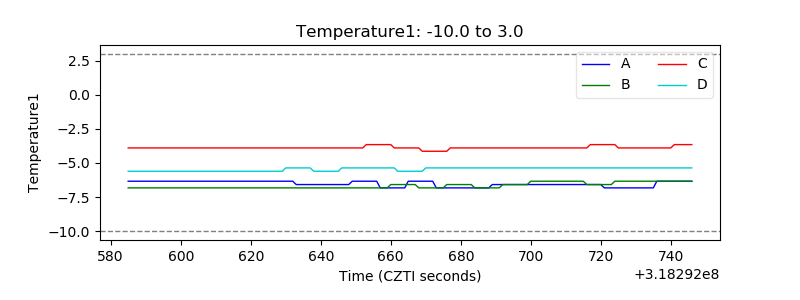 |
| Veto HV Monitor | 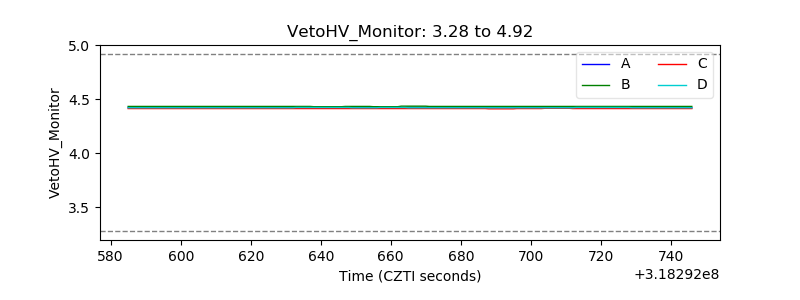 |
| Veto LLD | 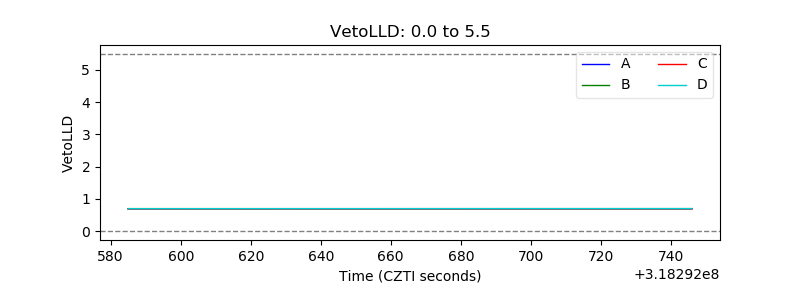 |
| Alpha Counter | 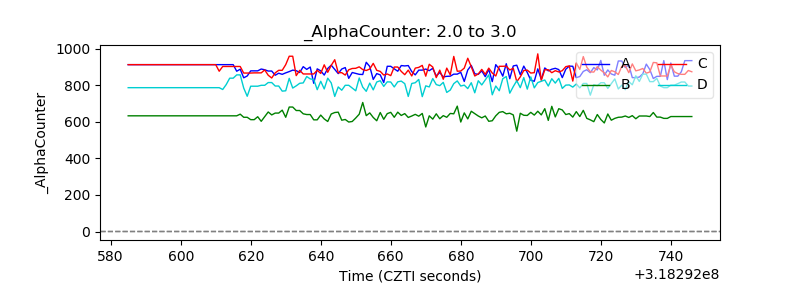 |
| _CPM_Rate | 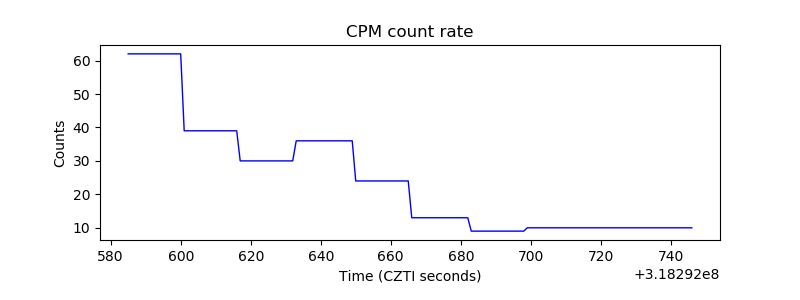 |
| CZT Counter | 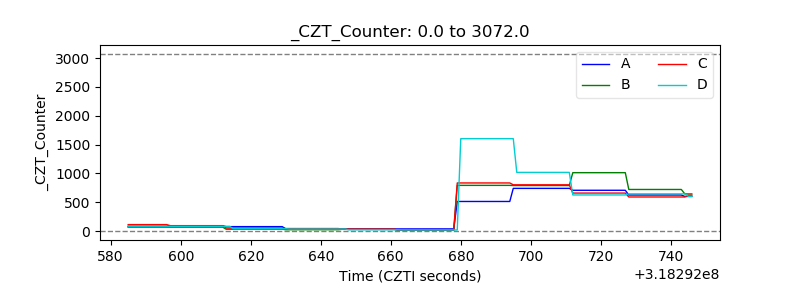 |
| +2.5 Volts monitor |  |
| +5 Volts monitor |  |
| _ROLL_ROT | 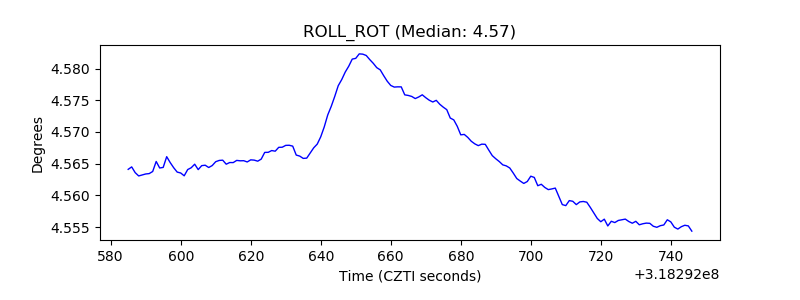 |
| _Roll_DEC | 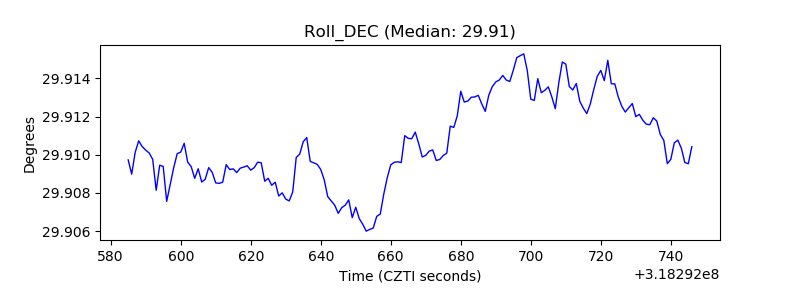 |
| _Roll_RA |  |
| Veto Counter | 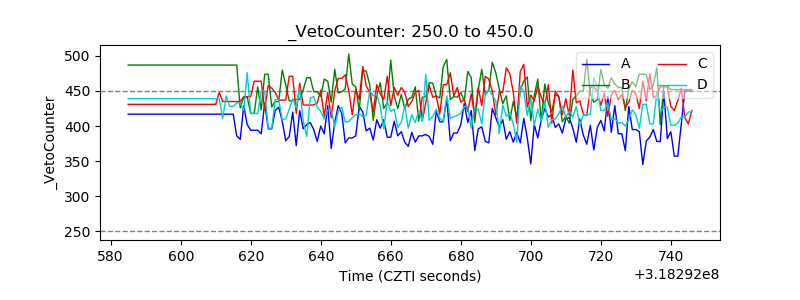 |