| Param | Original file | Final file |
|---|---|---|
| Filename | modeM0/AS1A07_112T02_9000003480cztM0_level2.fits | modeM0/AS1A07_112T02_9000003480cztM0_level2_quad_clean.evt |
| Size (bytes) | 387,541,440 | 405,884,160 |
| Size | 369.6 MB | 387.1 MB |
| Events in quadrant A | 2,391,860 | 2,478,804 |
| Events in quadrant B | 2,267,118 | 2,498,782 |
| Events in quadrant C | 2,309,862 | 2,379,931 |
| Events in quadrant D | 2,016,496 | 2,184,251 |
| Mode M9 | |||
|---|---|---|---|
| Quadrant | BADHDUFLAG | Total packets | Discarded packets |
| A | 0 | 85 | 0 |
| B | 0 | 87 | 0 |
| C | 0 | 86 | 0 |
| D | 0 | 88 | 0 |
| Mode SS | |||
|---|---|---|---|
| Quadrant | BADHDUFLAG | Total packets | Discarded packets |
| A | 0 | 818 | 0 |
| B | 0 | 820 | 0 |
| C | 0 | 816 | 0 |
| D | 0 | 818 | 0 |
| Mode M0 | |||
|---|---|---|---|
| Quadrant | BADHDUFLAG | Total packets | Discarded packets |
| A | 0 | 82045 | 0 |
| B | 0 | 85138 | 0 |
| C | 0 | 84676 | 0 |
| D | 0 | 94130 | 0 |
| Quadrant | Total seconds | Saturated seconds | Saturation percentage |
|---|---|---|---|
| A | 40082 | 199 | 0.496482% |
| B | 40062 | 425 | 1.060856% |
| C | 40053 | 527 | 1.315757% |
| D | 40041 | 940 | 2.347594% |
Noise dominated data is calculated using 1-second bins in cleaned event files. If a bin has >2000 counts, and if more than 50% of those come from <1% of pixels, then it is considered to be noise-dominated and hence unusable.
| Quadrant | # 1 sec bins | Bins with >0 counts | Bins with >2000 counts | High rate bins dominated by noise | Noise dominated (total time) | Noise dominated (detector-on time) | Marked lightcurve |
|---|---|---|---|---|---|---|---|
| A | 48140 | 40395 | 0 | 0 | 0.00% | 0.00% |  |
| B | 48140 | 40369 | 0 | 0 | 0.00% | 0.00% |  |
| C | 48140 | 40366 | 0 | 0 | 0.00% | 0.00% |  |
| D | 48140 | 40340 | 0 | 0 | 0.00% | 0.00% |  |
Top three noisy pixels from each quadrant. If the there are fewer than three noisy pixels in the level2.evt file, extra rows are filled as -1
| Pixel properties | Quadrant properties | ||||||
|---|---|---|---|---|---|---|---|
| Quadrant | DetID | PixID | Counts | Sigma | Mean | Median | Sigma |
| A | 0 | 29 | 2276 | 10.92 | 622 | 583 | 155.1 |
| A | 7 | 110 | 1844 | 8.13 | 622 | 583 | 155.1 |
| A | 9 | 19 | 1789 | 7.78 | 622 | 583 | 155.1 |
| B | 2 | 9 | 1844 | 10.61 | 601 | 575 | 119.6 |
| B | 2 | 8 | 1536 | 8.03 | 601 | 575 | 119.6 |
| B | 3 | 17 | 1512 | 7.83 | 601 | 575 | 119.6 |
| C | 1 | 81 | 1799 | 7.89 | 608 | 569 | 155.8 |
| C | 1 | 80 | 1772 | 7.72 | 608 | 569 | 155.8 |
| C | 12 | 241 | 1637 | 6.85 | 608 | 569 | 155.8 |
| D | 3 | 14 | 1595 | 6.81 | 576 | 525 | 157.1 |
| D | 3 | 31 | 1411 | 5.64 | 576 | 525 | 157.1 |
| D | 15 | 46 | 1400 | 5.57 | 576 | 525 | 157.1 |
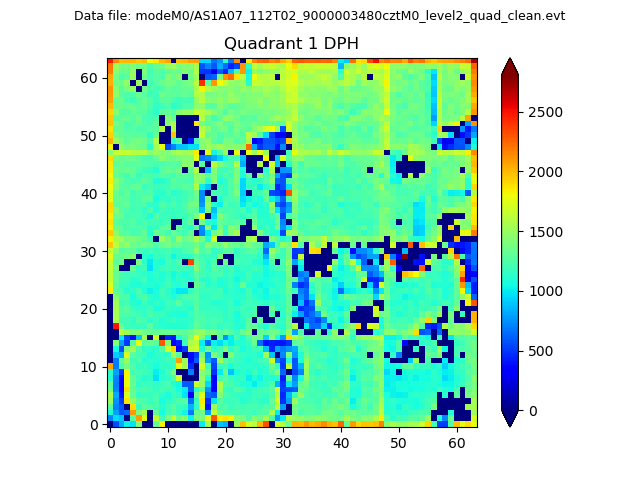
Histogram calculated using DETX and DETY for each event in the final _common_clean file
| Quadrant A |  |
 |
Quadrant B |
|---|---|---|---|
| Quadrant D |  |
 |
Quadrant C |
| Plot type | Count rate plots | Images |
|---|---|---|
| Comparison with Poisson distribution Blue bars denote a histogram of data divided into 1 sec bins. Red curve is a Poisson curve with rate = median count rate of data. |
 |
 |
| Quadrant-wise count rates Data is divided into 100 sec bins |
 |
|
| Module-wise count rates for Quadrant A Data is divided into 100 sec bins |
 |
 |
| Module-wise count rates for Quadrant B Data is divided into 100 sec bins |
 |
 |
| Module-wise count rates for Quadrant C Data is divided into 100 sec bins |
 |
 |
| Module-wise count rates for Quadrant D Data is divided into 100 sec bins |
 |
 |
| Parameter | Plot |
|---|---|
| CZT HV Monitor |  |
| D_VDD |  |
| Temperature 1 |  |
| Veto HV Monitor |  |
| Veto LLD | 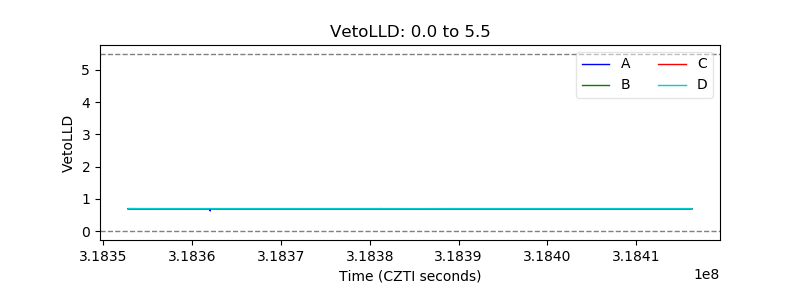 |
| Alpha Counter |  |
| _CPM_Rate |  |
| CZT Counter |  |
| +2.5 Volts monitor |  |
| +5 Volts monitor |  |
| _ROLL_ROT |  |
| _Roll_DEC |  |
| _Roll_RA |  |
| Veto Counter |  |