| Param | Original file | Final file |
|---|---|---|
| Filename | modeM0/AS1A07_112T02_9000003480_23512cztM0_level2.evt | modeM0/AS1A07_112T02_9000003480_23512cztM0_level2_quad_clean.evt |
| Size (bytes) | 291,251,520 | 42,811,200 |
| Size | 277.8 MB | 40.8 MB |
| Events in quadrant A | 1,829,952 | 262,731 |
| Events in quadrant B | 2,051,991 | 265,163 |
| Events in quadrant C | 1,884,071 | 256,500 |
| Events in quadrant D | 2,799,979 | 247,973 |
| Mode M9 | |||
|---|---|---|---|
| Quadrant | BADHDUFLAG | Total packets | Discarded packets |
| A | 0 | 3 | 0 |
| B | 0 | 3 | 0 |
| C | 0 | 3 | 0 |
| D | 0 | 3 | 0 |
| Mode SS | |||
|---|---|---|---|
| Quadrant | BADHDUFLAG | Total packets | Discarded packets |
| A | 0 | 76 | 0 |
| B | 0 | 76 | 0 |
| C | 0 | 76 | 0 |
| D | 0 | 76 | 0 |
| Mode M0 | |||
|---|---|---|---|
| Quadrant | BADHDUFLAG | Total packets | Discarded packets |
| A | 0 | 7719 | 1 |
| B | 0 | 8387 | 1 |
| C | 0 | 7845 | 1 |
| D | 0 | 10779 | 6 |
| Quadrant | Total seconds | Saturated seconds | Saturation percentage |
|---|---|---|---|
| A | 3727 | 49 | 1.314730% |
| B | 3727 | 93 | 2.495305% |
| C | 3727 | 81 | 2.173330% |
| D | 3726 | 315 | 8.454106% |
Noise dominated data is calculated using 1-second bins in cleaned event files. If a bin has >2000 counts, and if more than 50% of those come from <1% of pixels, then it is considered to be noise-dominated and hence unusable.
| Quadrant | # 1 sec bins | Bins with >0 counts | Bins with >2000 counts | High rate bins dominated by noise | Noise dominated (total time) | Noise dominated (detector-on time) | Marked lightcurve |
|---|---|---|---|---|---|---|---|
| A | 4017 | 3728 | 0 | 0 | 0.00% | 0.00% | 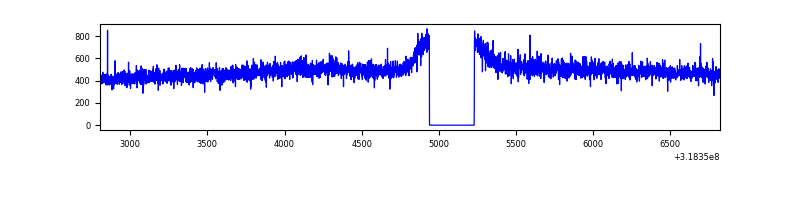 |
| B | 4017 | 3728 | 4 | 4 | 0.10% | 0.11% | 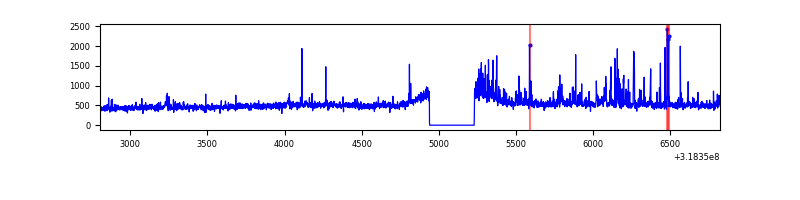 |
| C | 4017 | 3727 | 0 | 0 | 0.00% | 0.00% | 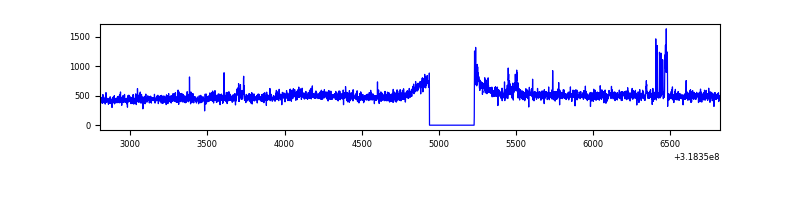 |
| D | 4016 | 3726 | 166 | 166 | 4.13% | 4.46% | 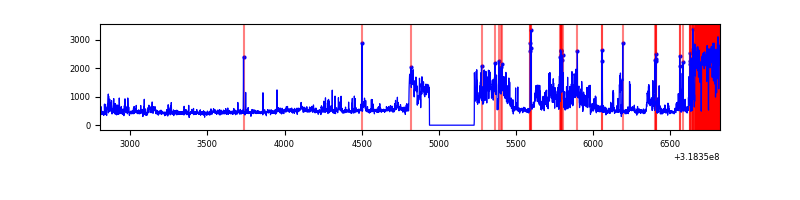 |
Top three noisy pixels from each quadrant. If the there are fewer than three noisy pixels in the level2.evt file, extra rows are filled as -1
| Pixel properties | Quadrant properties | ||||||
|---|---|---|---|---|---|---|---|
| Quadrant | DetID | PixID | Counts | Sigma | Mean | Median | Sigma |
| A | 13 | 254 | 6351 | 60.5 | 474 | 464 | 97.3 |
| A | 3 | 137 | 4204 | 38.43 | 474 | 464 | 97.3 |
| A | 0 | 226 | 4081 | 37.17 | 474 | 464 | 97.3 |
| B | 0 | 189 | 162934 | 1784.61 | 466 | 453 | 91.0 |
| B | 0 | 229 | 34512 | 374.09 | 466 | 453 | 91.0 |
| B | 12 | 111 | 10904 | 114.79 | 466 | 453 | 91.0 |
| C | 14 | 238 | 70247 | 666.01 | 445 | 447 | 104.8 |
| C | 9 | 54 | 29649 | 278.64 | 445 | 447 | 104.8 |
| C | 3 | 233 | 18172 | 169.13 | 445 | 447 | 104.8 |
| D | 1 | 52 | 733067 | 6663.22 | 447 | 432 | 110.0 |
| D | 9 | 85 | 287063 | 2606.87 | 447 | 432 | 110.0 |
| D | 7 | 238 | 36933 | 331.97 | 447 | 432 | 110.0 |
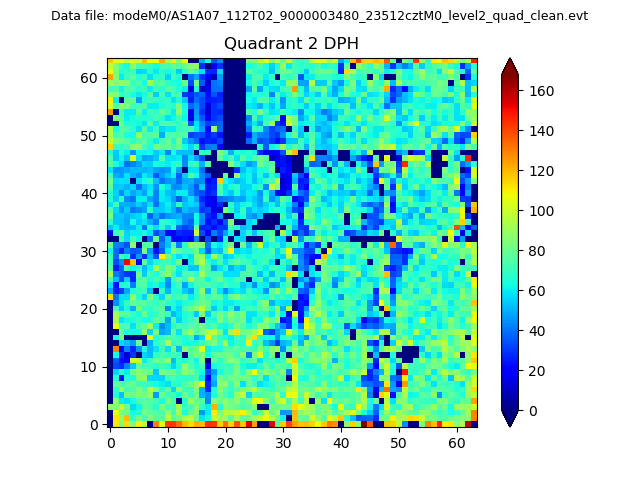
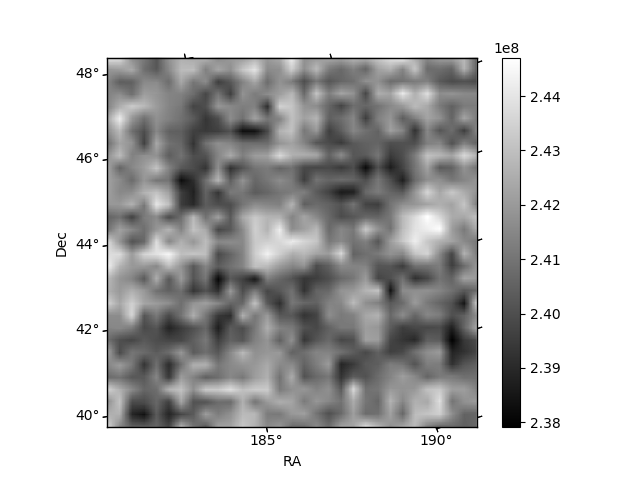
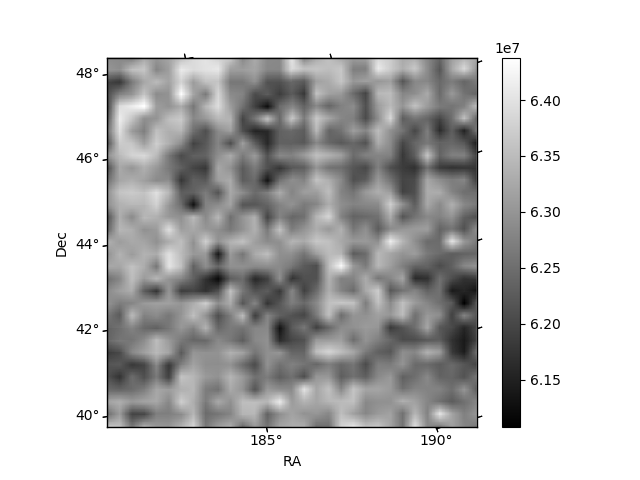
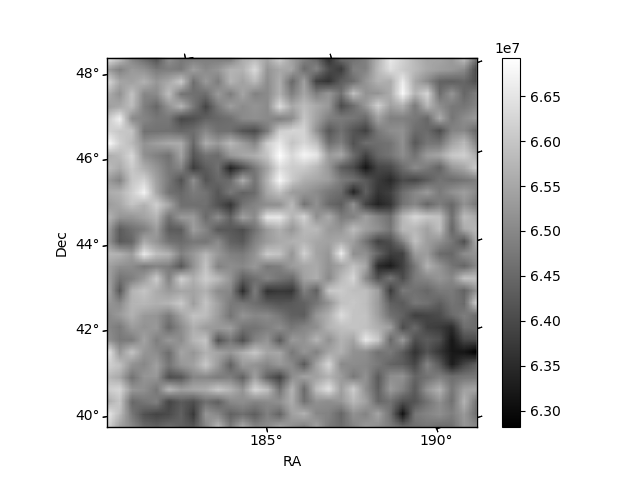
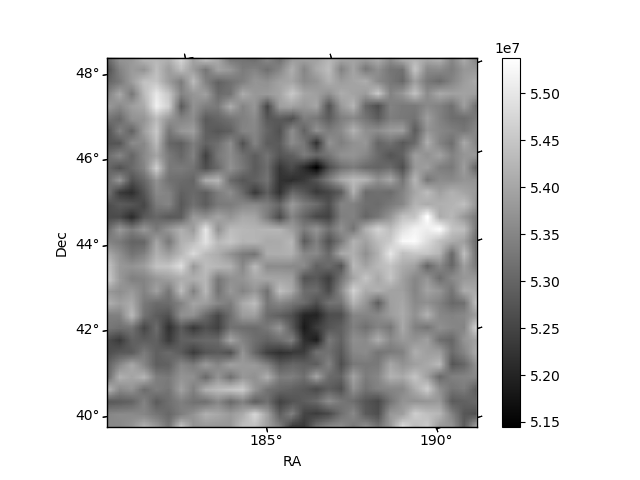
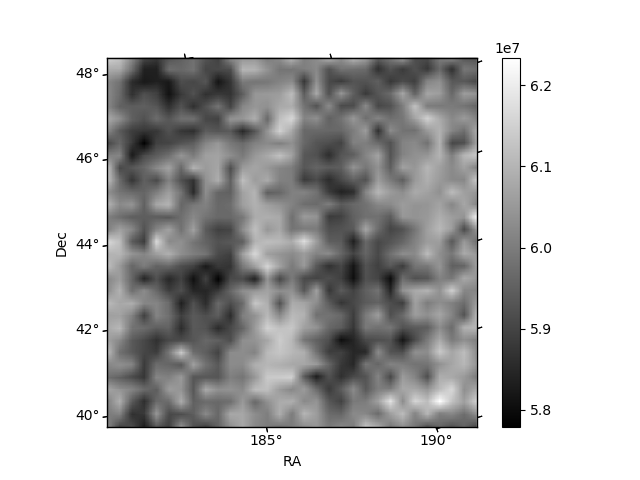
Histogram calculated using DETX and DETY for each event in the final _common_clean file
| Quadrant A | 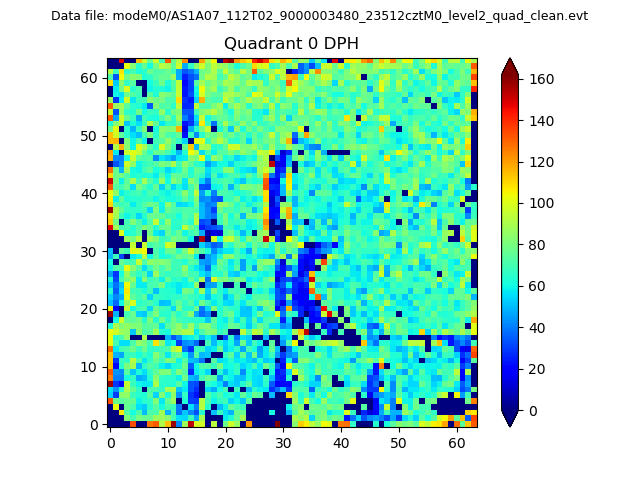 |
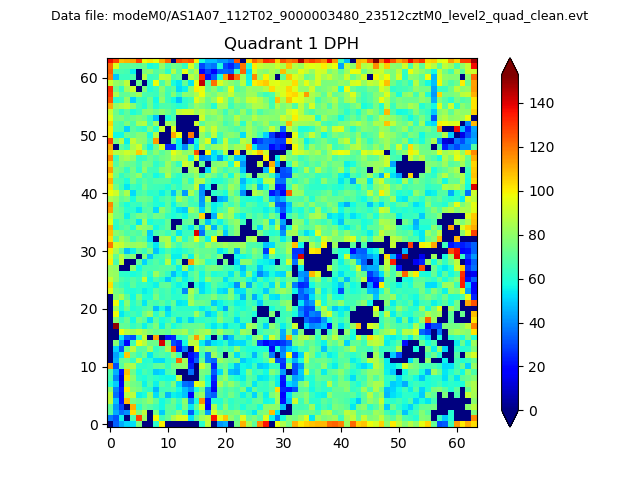 |
Quadrant B |
|---|---|---|---|
| Quadrant D | 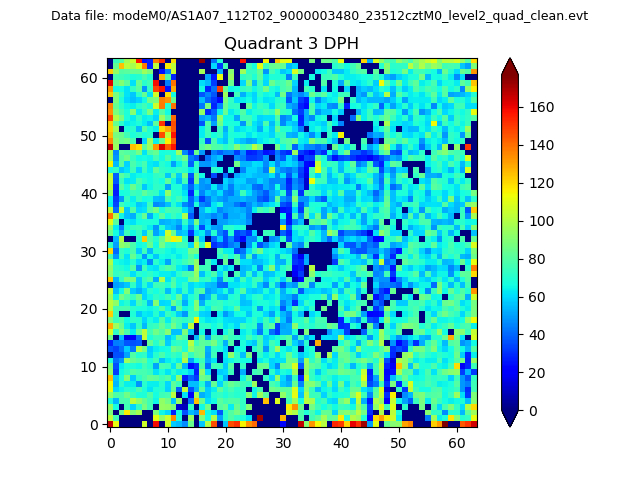 |
 |
Quadrant C |
| Plot type | Count rate plots | Images |
|---|---|---|
| Comparison with Poisson distribution Blue bars denote a histogram of data divided into 1 sec bins. Red curve is a Poisson curve with rate = median count rate of data. |
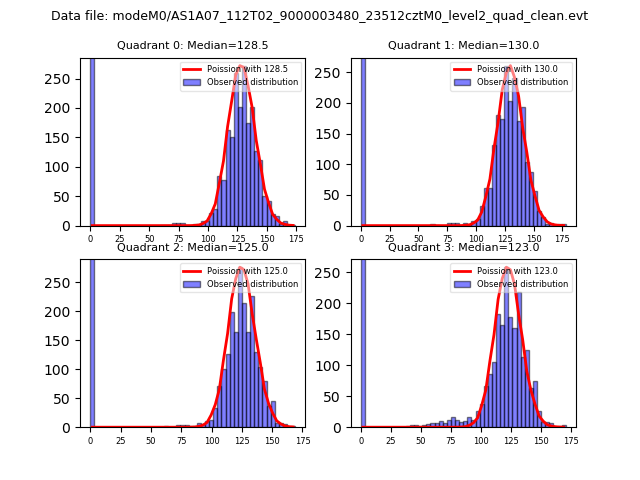 |
 |
| Quadrant-wise count rates Data is divided into 100 sec bins |
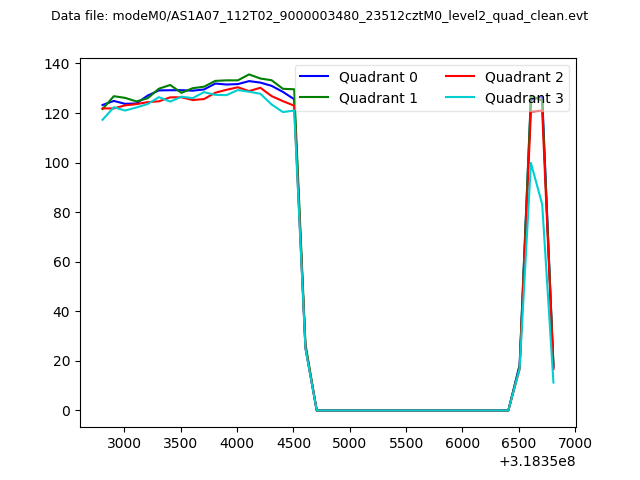 |
|
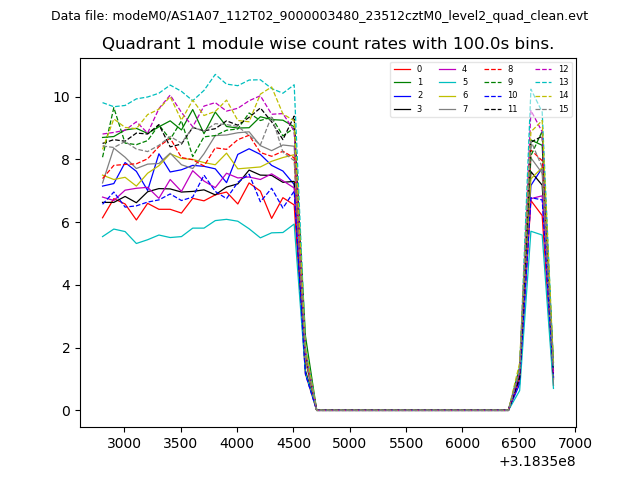
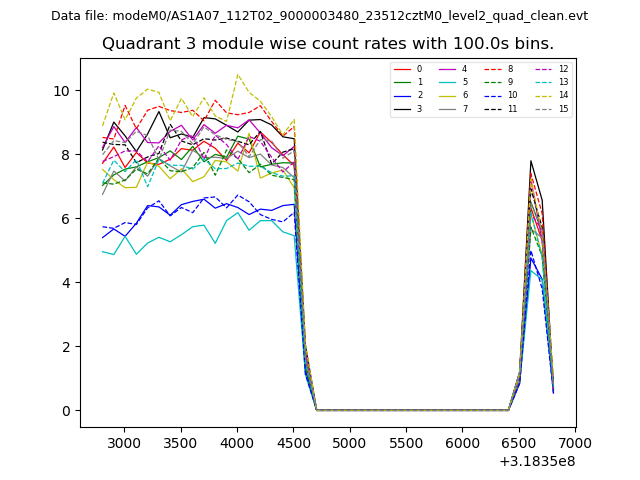
| Module-wise count rates for Quadrant A Data is divided into 100 sec bins |
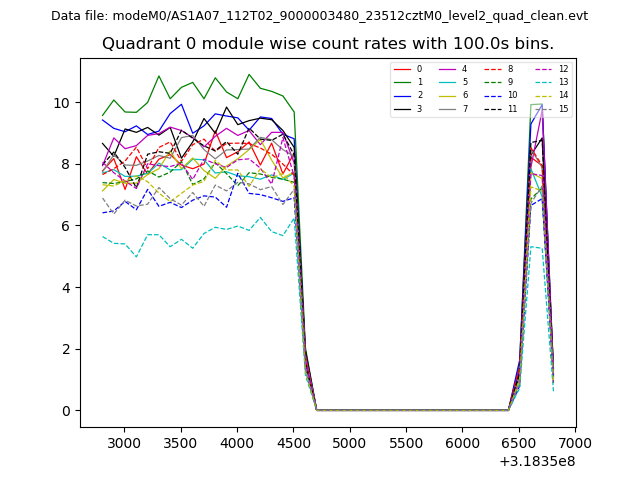 |
 |
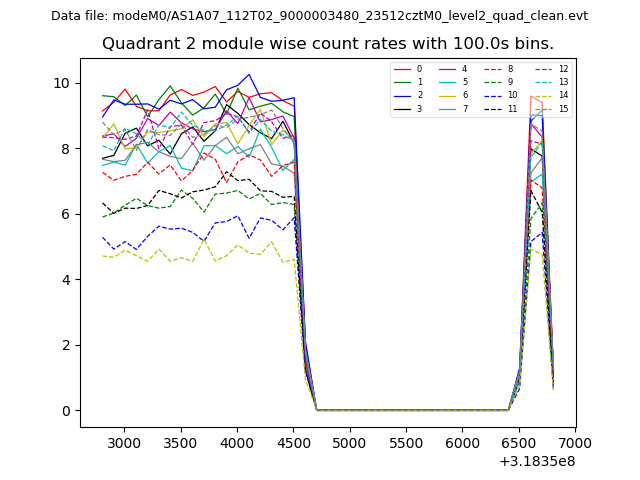
| Module-wise count rates for Quadrant B Data is divided into 100 sec bins |
 |
 |
| Module-wise count rates for Quadrant C Data is divided into 100 sec bins |
 |
 |
| Module-wise count rates for Quadrant D Data is divided into 100 sec bins |
 |
 |
| Parameter | Plot |
|---|---|
| CZT HV Monitor | 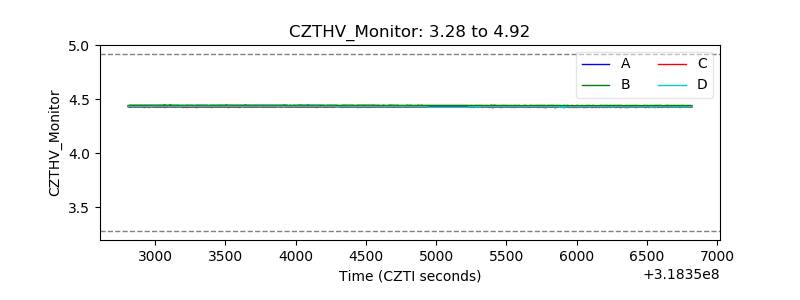 |
| D_VDD | 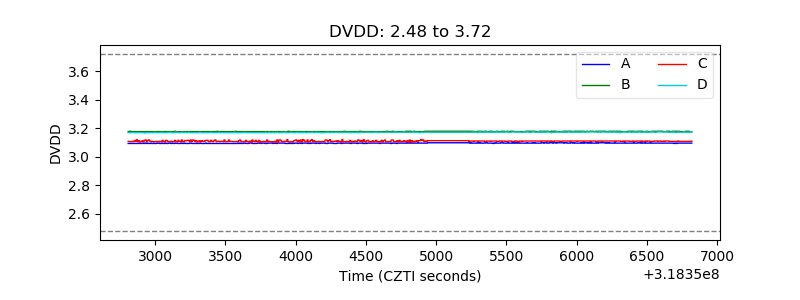 |
| Temperature 1 | 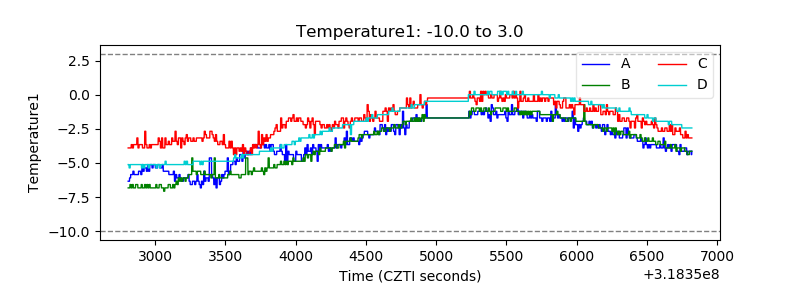 |
| Veto HV Monitor | 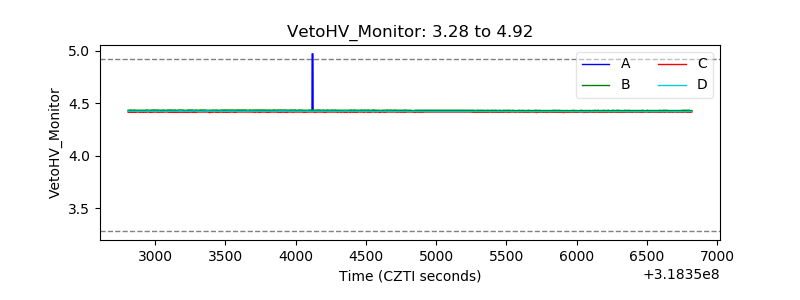 |
| Veto LLD | 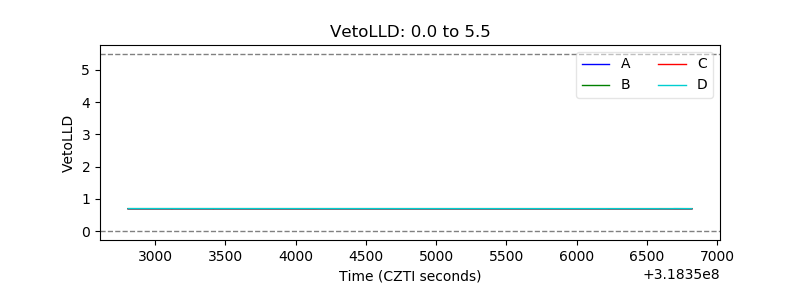 |
| Alpha Counter | 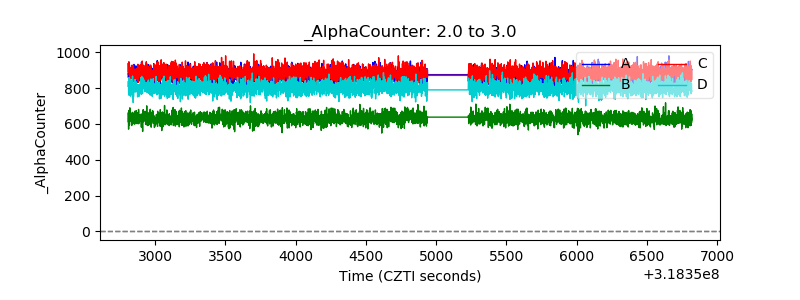 |
| _CPM_Rate | 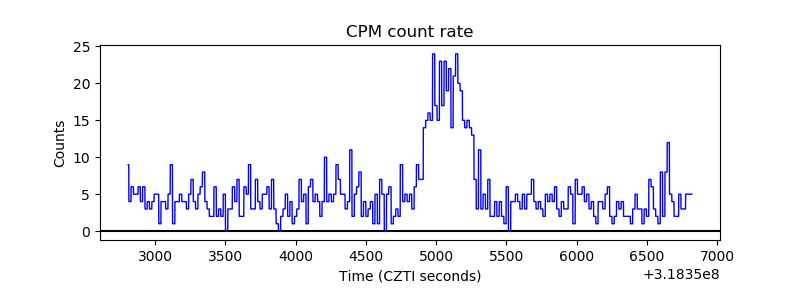 |
| CZT Counter | 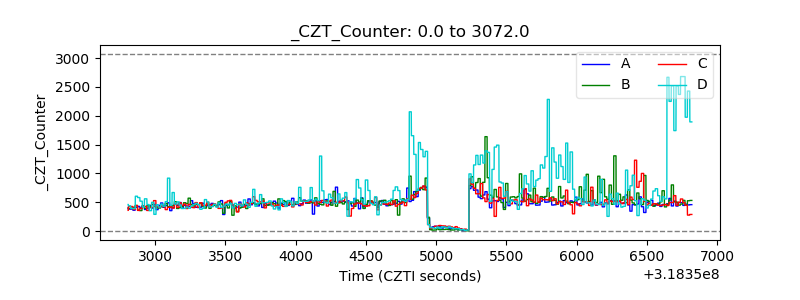 |
| +2.5 Volts monitor |  |
| +5 Volts monitor | 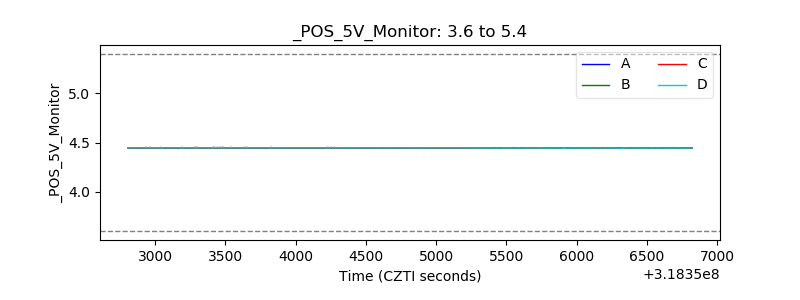 |
| _ROLL_ROT | 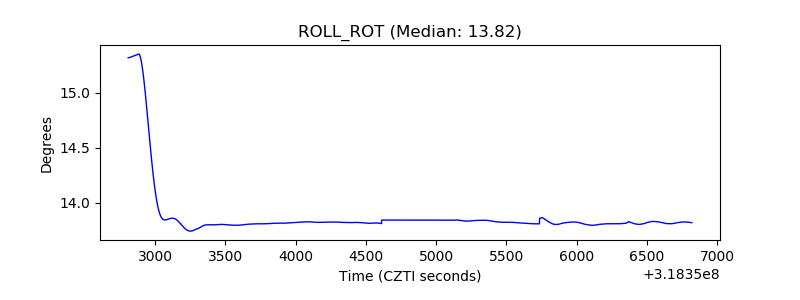 |
| _Roll_DEC | 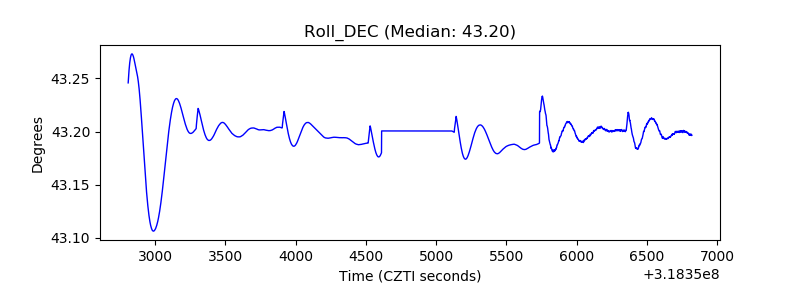 |
| _Roll_RA | 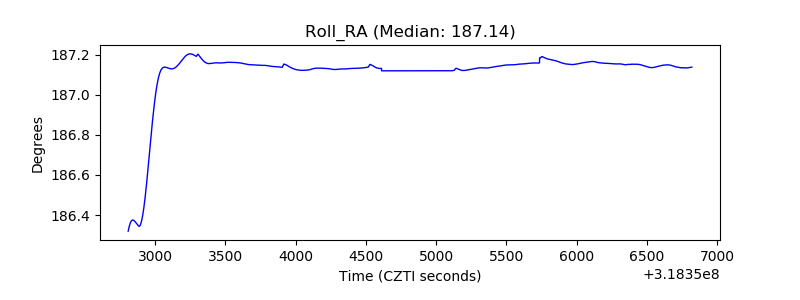 |
| Veto Counter | 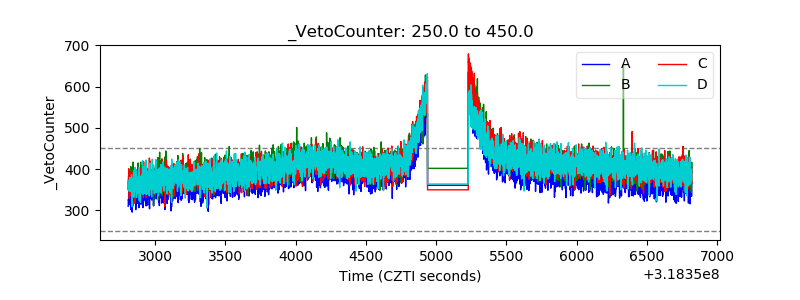 |