| Param | Original file | Final file |
|---|---|---|
| Filename | modeM0/AS1A07_112T02_9000003480_23518cztM0_level2.evt | modeM0/AS1A07_112T02_9000003480_23518cztM0_level2_quad_clean.evt |
| Size (bytes) | 731,640,960 | 157,803,840 |
| Size | 697.7 MB | 150.5 MB |
| Events in quadrant A | 5,106,079 | 1,006,997 |
| Events in quadrant B | 5,391,565 | 1,031,870 |
| Events in quadrant C | 5,394,485 | 993,669 |
| Events in quadrant D | 5,504,777 | 970,382 |
| Mode M9 | |||
|---|---|---|---|
| Quadrant | BADHDUFLAG | Total packets | Discarded packets |
| A | 0 | 21 | 0 |
| B | 0 | 21 | 0 |
| C | 0 | 21 | 0 |
| D | 0 | 21 | 0 |
| Mode SS | |||
|---|---|---|---|
| Quadrant | BADHDUFLAG | Total packets | Discarded packets |
| A | 0 | 230 | 0 |
| B | 0 | 230 | 0 |
| C | 0 | 230 | 0 |
| D | 0 | 230 | 0 |
| Mode M0 | |||
|---|---|---|---|
| Quadrant | BADHDUFLAG | Total packets | Discarded packets |
| A | 0 | 22921 | 58 |
| B | 0 | 23628 | 56 |
| C | 0 | 23487 | 52 |
| D | 0 | 24507 | 54 |
| Quadrant | Total seconds | Saturated seconds | Saturation percentage |
|---|---|---|---|
| A | 11217 | 34 | 0.303111% |
| B | 11218 | 62 | 0.552683% |
| C | 11220 | 104 | 0.926916% |
| D | 11220 | 124 | 1.105169% |
Noise dominated data is calculated using 1-second bins in cleaned event files. If a bin has >2000 counts, and if more than 50% of those come from <1% of pixels, then it is considered to be noise-dominated and hence unusable.
| Quadrant | # 1 sec bins | Bins with >0 counts | Bins with >2000 counts | High rate bins dominated by noise | Noise dominated (total time) | Noise dominated (detector-on time) | Marked lightcurve |
|---|---|---|---|---|---|---|---|
| A | 13315 | 11220 | 0 | 0 | 0.00% | 0.00% | 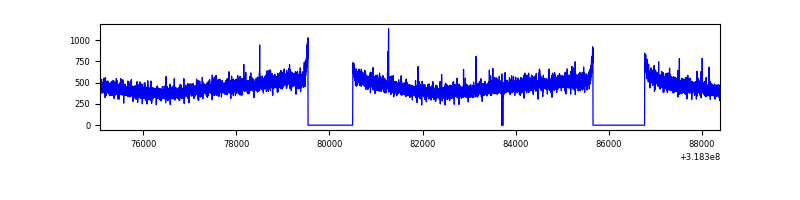 |
| B | 13315 | 11221 | 8 | 8 | 0.06% | 0.07% | 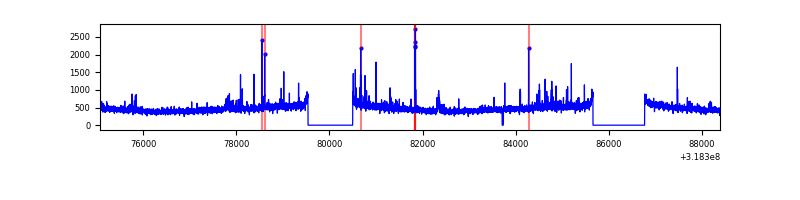 |
| C | 13315 | 11225 | 11 | 11 | 0.08% | 0.10% | 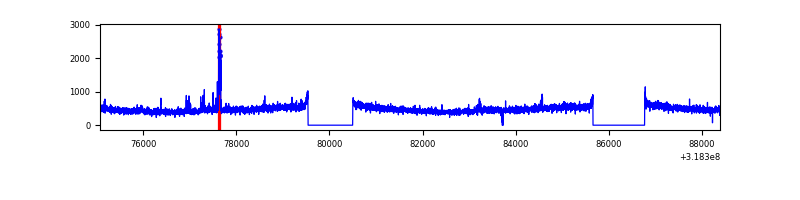 |
| D | 13316 | 11225 | 87 | 87 | 0.65% | 0.78% | 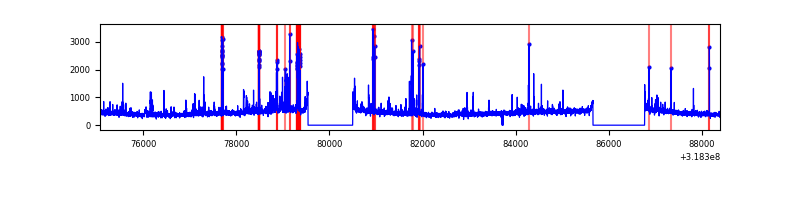 |
Top three noisy pixels from each quadrant. If the there are fewer than three noisy pixels in the level2.evt file, extra rows are filled as -1
| Pixel properties | Quadrant properties | ||||||
|---|---|---|---|---|---|---|---|
| Quadrant | DetID | PixID | Counts | Sigma | Mean | Median | Sigma |
| A | 13 | 254 | 17145 | 60.11 | 1322 | 1296 | 263.7 |
| A | 3 | 137 | 11569 | 38.96 | 1322 | 1296 | 263.7 |
| A | 0 | 226 | 11163 | 37.42 | 1322 | 1296 | 263.7 |
| B | 0 | 189 | 149603 | 595.29 | 1321 | 1289 | 249.1 |
| B | 12 | 111 | 30089 | 115.6 | 1321 | 1289 | 249.1 |
| B | 11 | 111 | 26790 | 102.35 | 1321 | 1289 | 249.1 |
| C | 14 | 238 | 202758 | 685.89 | 1269 | 1278 | 293.7 |
| C | 7 | 247 | 148261 | 500.37 | 1269 | 1278 | 293.7 |
| C | 10 | 91 | 50328 | 166.98 | 1269 | 1278 | 293.7 |
| D | 1 | 52 | 576126 | 1859.24 | 1274 | 1235 | 309.2 |
| D | 2 | 234 | 46499 | 146.39 | 1274 | 1235 | 309.2 |
| D | 5 | 222 | 33799 | 105.31 | 1274 | 1235 | 309.2 |
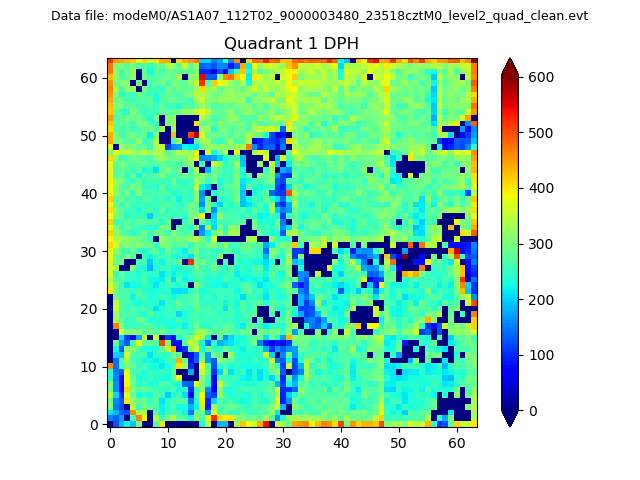
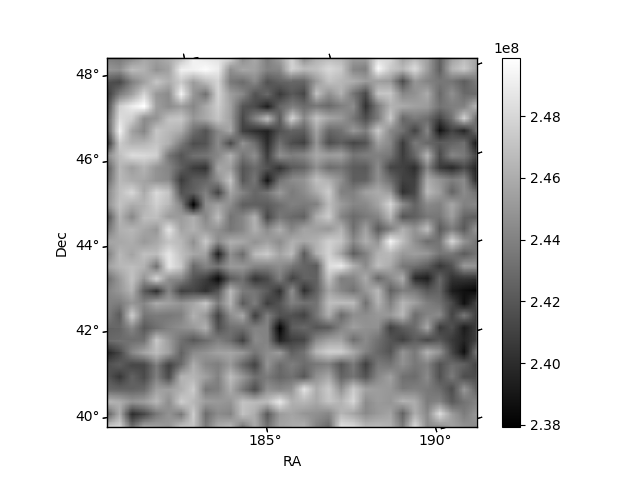
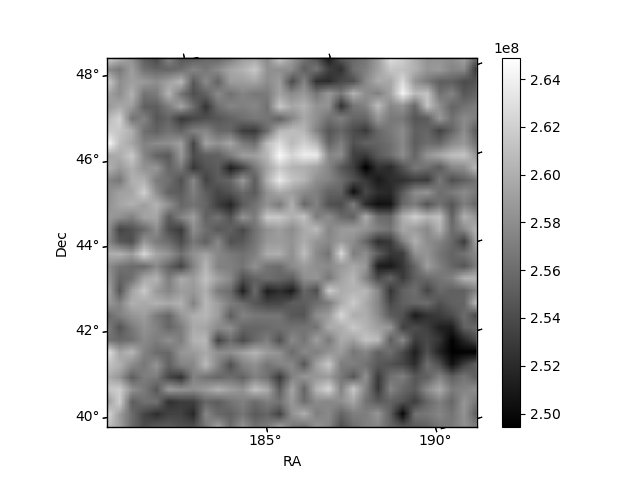
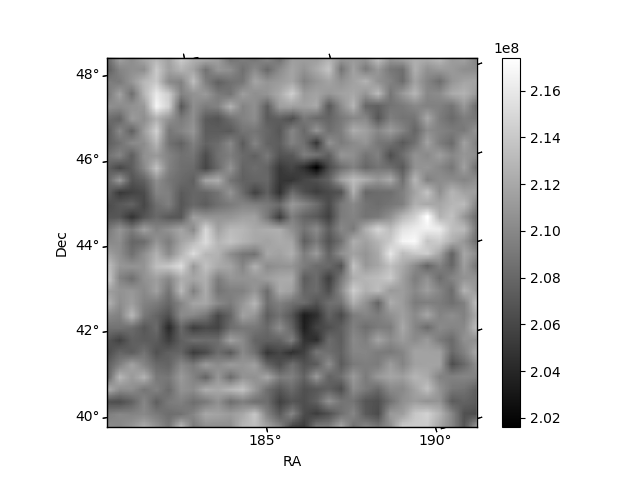
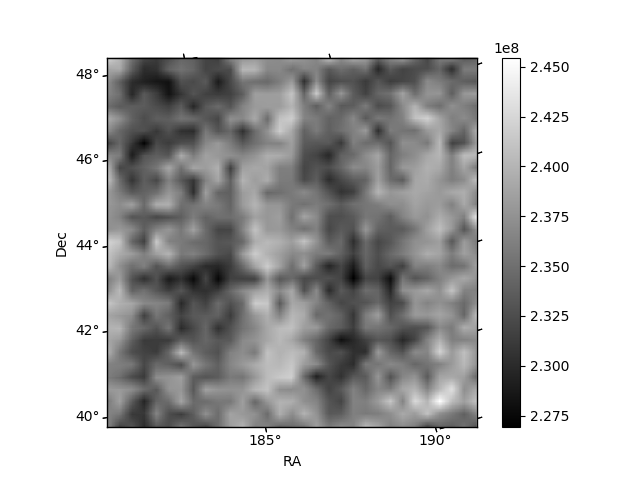
Histogram calculated using DETX and DETY for each event in the final _common_clean file
| Quadrant A |  |
 |
Quadrant B |
|---|---|---|---|
| Quadrant D | 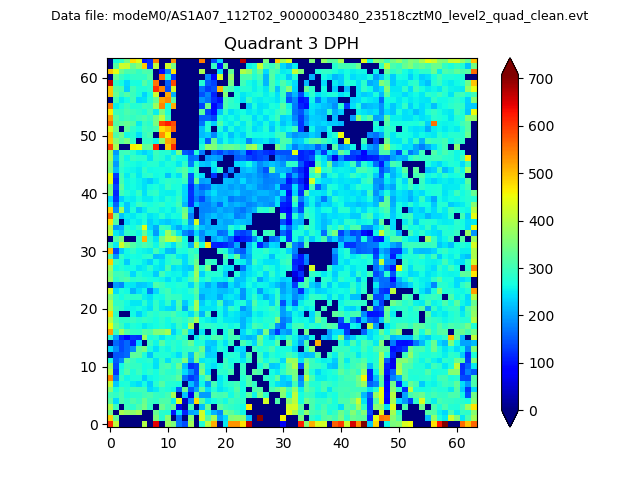 |
 |
Quadrant C |
| Plot type | Count rate plots | Images |
|---|---|---|
| Comparison with Poisson distribution Blue bars denote a histogram of data divided into 1 sec bins. Red curve is a Poisson curve with rate = median count rate of data. |
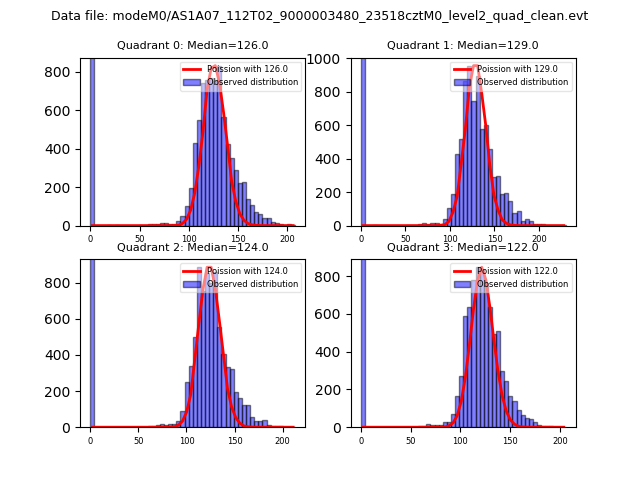 |
 |
| Quadrant-wise count rates Data is divided into 100 sec bins |
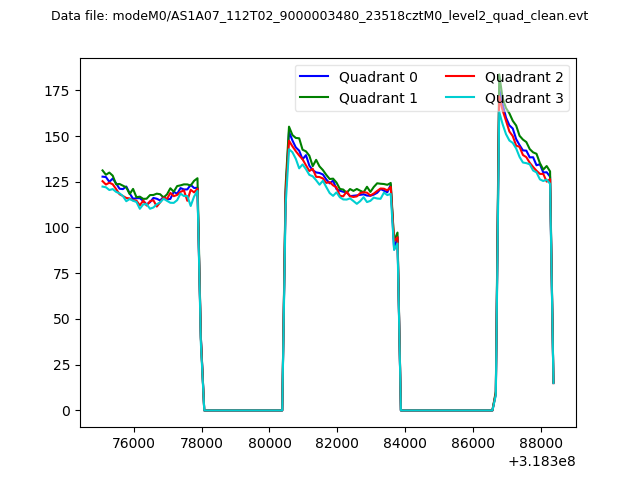 |
|
| Module-wise count rates for Quadrant A Data is divided into 100 sec bins |
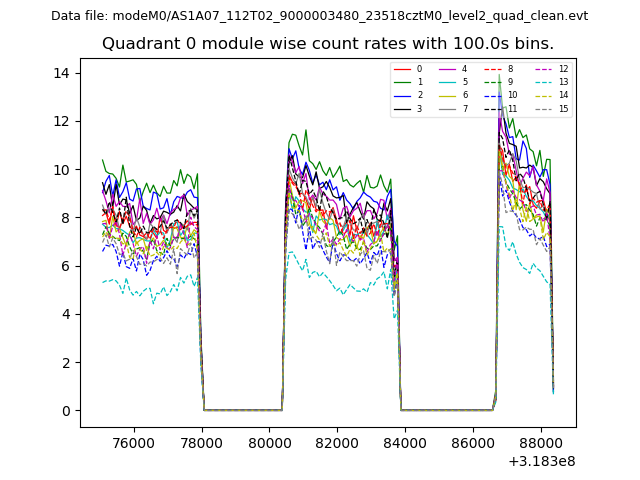 |
 |
| Module-wise count rates for Quadrant B Data is divided into 100 sec bins |
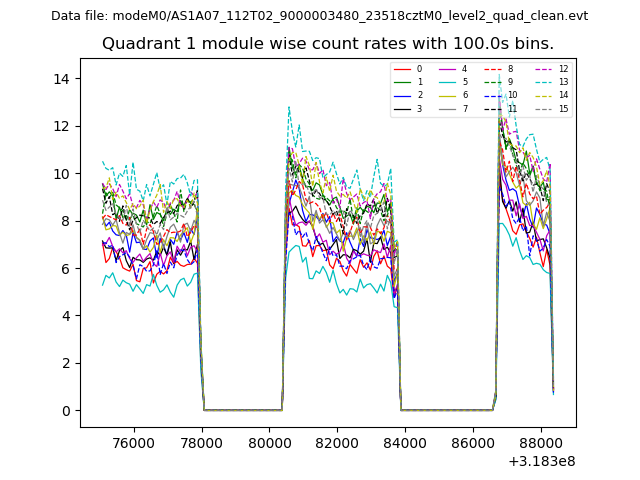 |
 |
| Module-wise count rates for Quadrant C Data is divided into 100 sec bins |
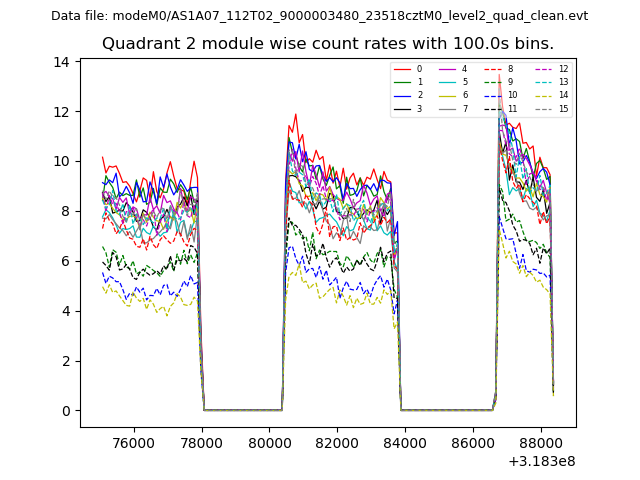 |
 |
| Module-wise count rates for Quadrant D Data is divided into 100 sec bins |
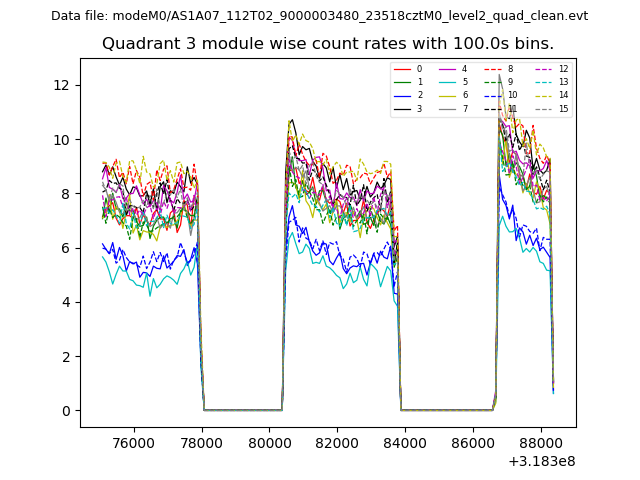 |
 |
| Parameter | Plot |
|---|---|
| CZT HV Monitor | 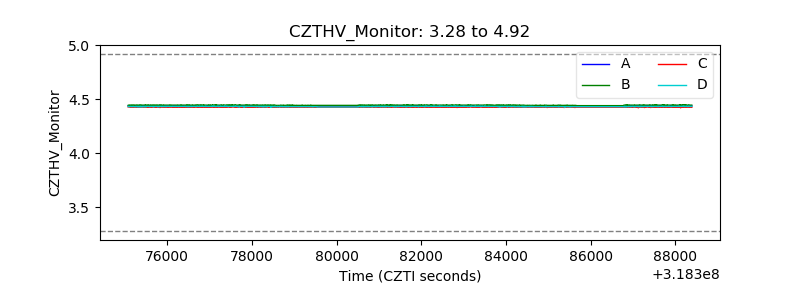 |
| D_VDD | 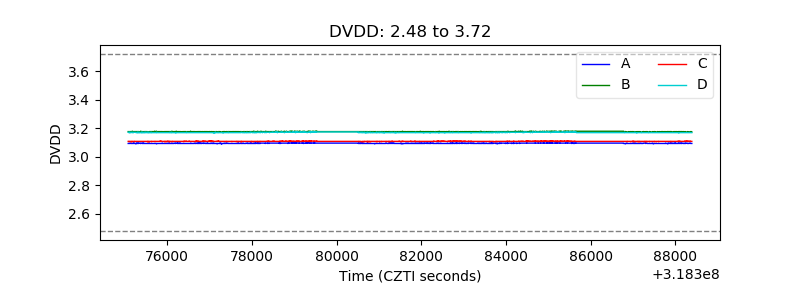 |
| Temperature 1 | 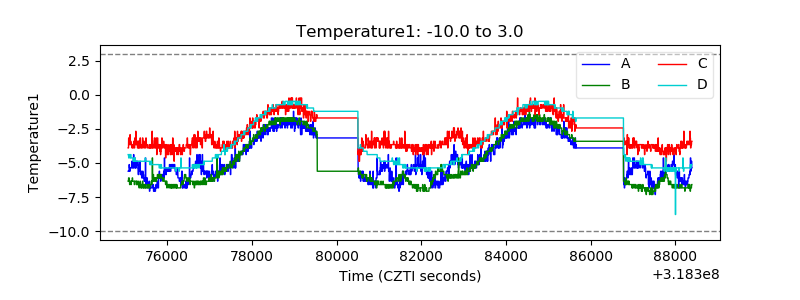 |
| Veto HV Monitor | 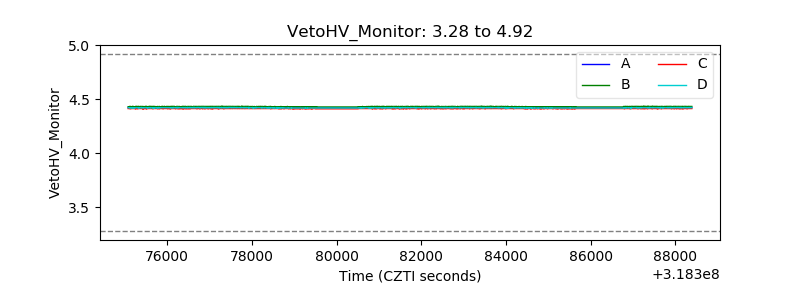 |
| Veto LLD | 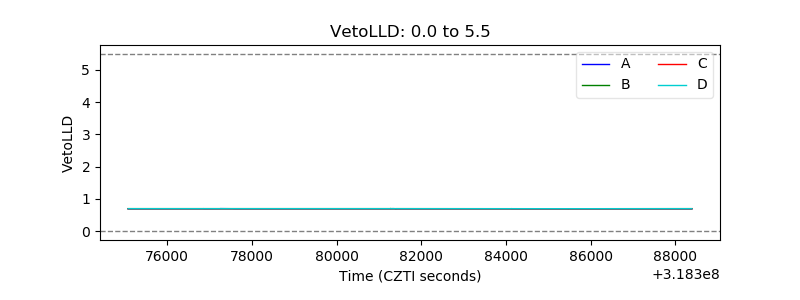 |
| Alpha Counter | 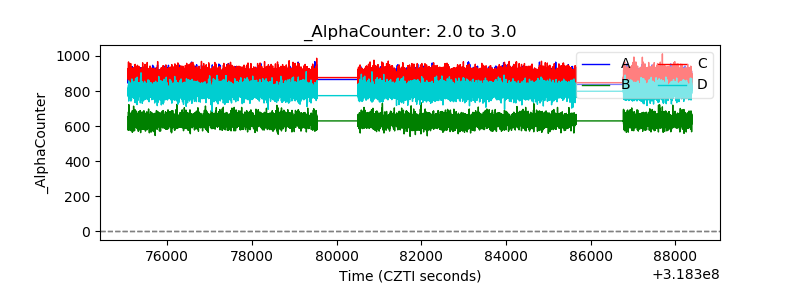 |
| _CPM_Rate | 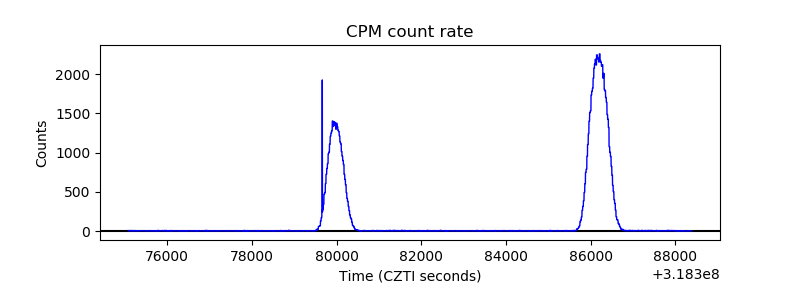 |
| CZT Counter | 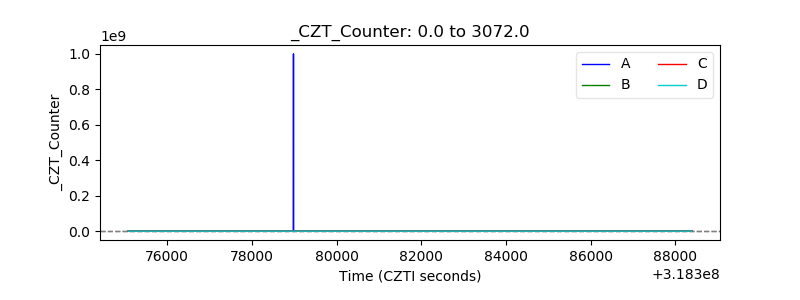 |
| +2.5 Volts monitor |  |
| +5 Volts monitor |  |
| _ROLL_ROT | 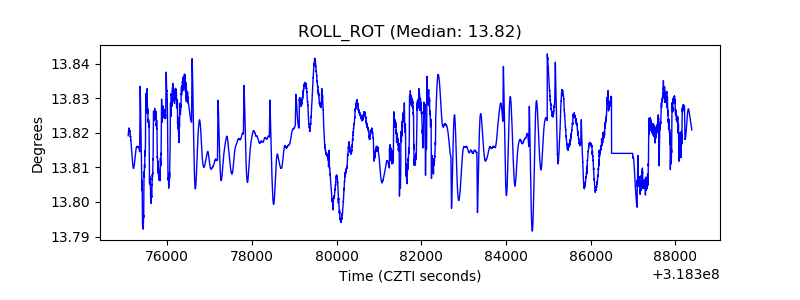 |
| _Roll_DEC | 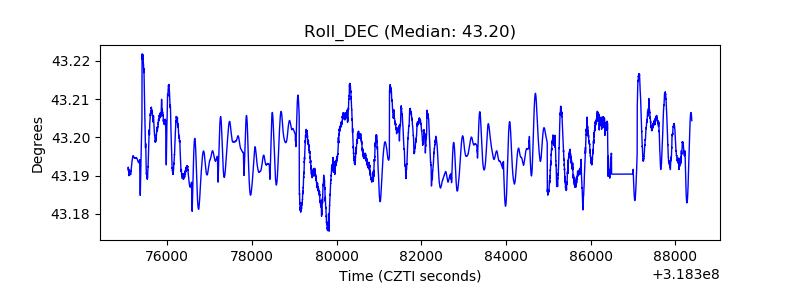 |
| _Roll_RA | 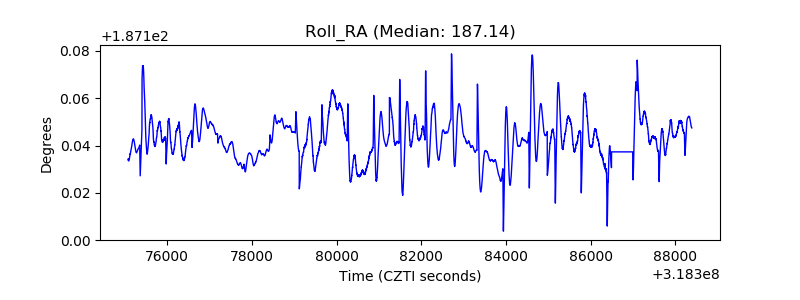 |
| Veto Counter | 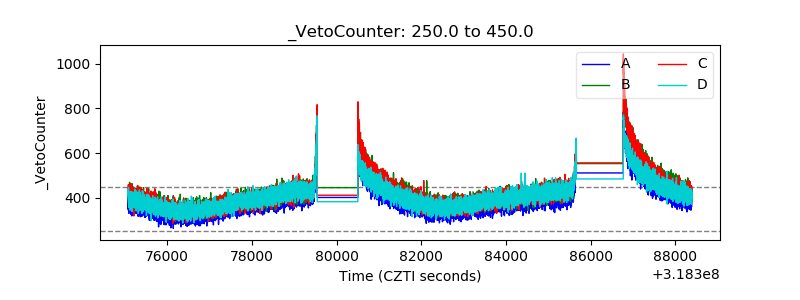 |