| Param | Original file | Final file |
|---|---|---|
| Filename | modeM0/AS1A07_112T02_9000003480_23520cztM0_level2.evt | modeM0/AS1A07_112T02_9000003480_23520cztM0_level2_quad_clean.evt |
| Size (bytes) | 804,052,800 | 169,032,960 |
| Size | 766.8 MB | 161.2 MB |
| Events in quadrant A | 5,590,371 | 1,101,212 |
| Events in quadrant B | 5,924,440 | 1,128,404 |
| Events in quadrant C | 6,268,325 | 1,058,344 |
| Events in quadrant D | 5,793,567 | 1,040,631 |
| Mode M9 | |||
|---|---|---|---|
| Quadrant | BADHDUFLAG | Total packets | Discarded packets |
| A | 0 | 25 | 0 |
| B | 0 | 25 | 0 |
| C | 0 | 25 | 0 |
| D | 0 | 25 | 0 |
| Mode SS | |||
|---|---|---|---|
| Quadrant | BADHDUFLAG | Total packets | Discarded packets |
| A | 0 | 232 | 0 |
| B | 0 | 232 | 0 |
| C | 0 | 232 | 0 |
| D | 0 | 232 | 0 |
| Mode M0 | |||
|---|---|---|---|
| Quadrant | BADHDUFLAG | Total packets | Discarded packets |
| A | 0 | 23689 | 2 |
| B | 0 | 24553 | 2 |
| C | 0 | 25618 | 2 |
| D | 0 | 24947 | 2 |
| Quadrant | Total seconds | Saturated seconds | Saturation percentage |
|---|---|---|---|
| A | 11438 | 48 | 0.419654% |
| B | 11438 | 111 | 0.970449% |
| C | 11438 | 206 | 1.801014% |
| D | 11439 | 65 | 0.568231% |
Noise dominated data is calculated using 1-second bins in cleaned event files. If a bin has >2000 counts, and if more than 50% of those come from <1% of pixels, then it is considered to be noise-dominated and hence unusable.
| Quadrant | # 1 sec bins | Bins with >0 counts | Bins with >2000 counts | High rate bins dominated by noise | Noise dominated (total time) | Noise dominated (detector-on time) | Marked lightcurve |
|---|---|---|---|---|---|---|---|
| A | 13953 | 11440 | 0 | 0 | 0.00% | 0.00% | 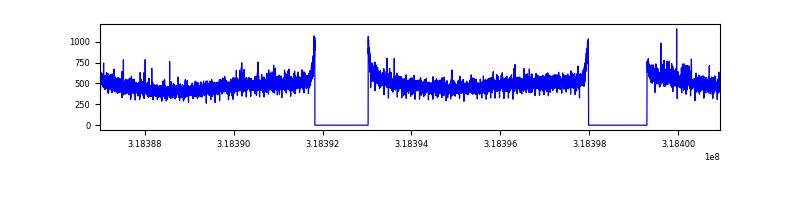 |
| B | 13953 | 11439 | 16 | 16 | 0.11% | 0.14% | 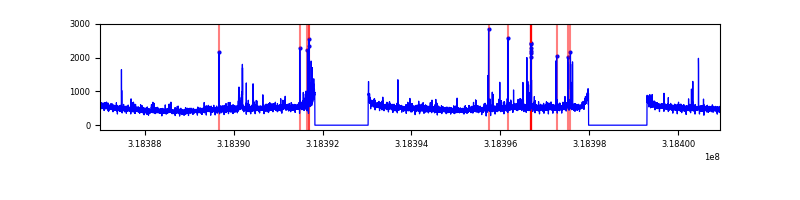 |
| C | 13953 | 11439 | 80 | 80 | 0.57% | 0.70% | 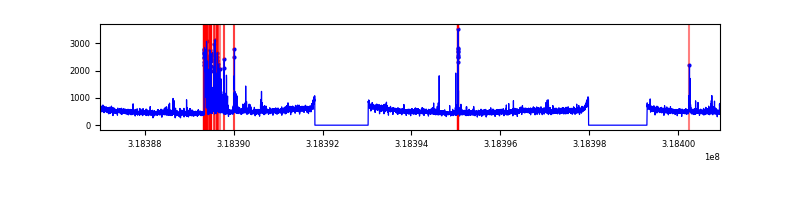 |
| D | 13954 | 11441 | 31 | 31 | 0.22% | 0.27% | 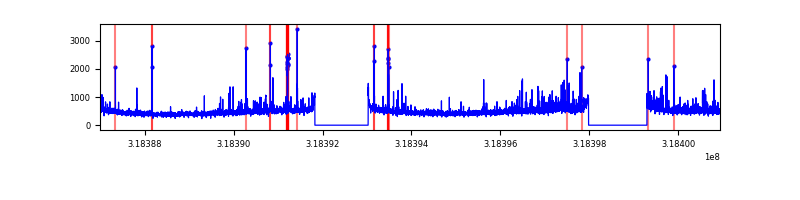 |
Top three noisy pixels from each quadrant. If the there are fewer than three noisy pixels in the level2.evt file, extra rows are filled as -1
| Pixel properties | Quadrant properties | ||||||
|---|---|---|---|---|---|---|---|
| Quadrant | DetID | PixID | Counts | Sigma | Mean | Median | Sigma |
| A | 4 | 2 | 26875 | 88.68 | 1444 | 1417 | 287.1 |
| A | 13 | 254 | 18016 | 57.82 | 1444 | 1417 | 287.1 |
| A | 0 | 226 | 12619 | 39.02 | 1444 | 1417 | 287.1 |
| B | 0 | 189 | 141732 | 525.9 | 1434 | 1400 | 266.8 |
| B | 12 | 17 | 60834 | 222.73 | 1434 | 1400 | 266.8 |
| B | 12 | 111 | 31423 | 112.51 | 1434 | 1400 | 266.8 |
| C | 2 | 16 | 464327 | 1474.6 | 1364 | 1370 | 314.0 |
| C | 14 | 238 | 221159 | 700.07 | 1364 | 1370 | 314.0 |
| C | 10 | 91 | 172522 | 545.15 | 1364 | 1370 | 314.0 |
| D | 1 | 52 | 474087 | 1411.72 | 1386 | 1345 | 334.9 |
| D | 2 | 234 | 46079 | 133.59 | 1386 | 1345 | 334.9 |
| D | 8 | 195 | 19063 | 52.91 | 1386 | 1345 | 334.9 |
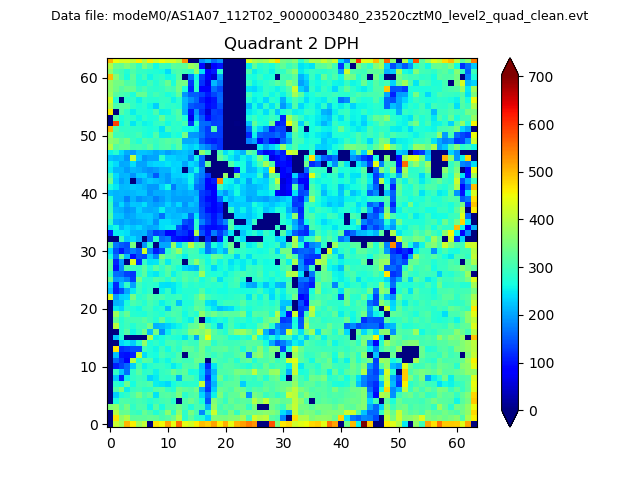
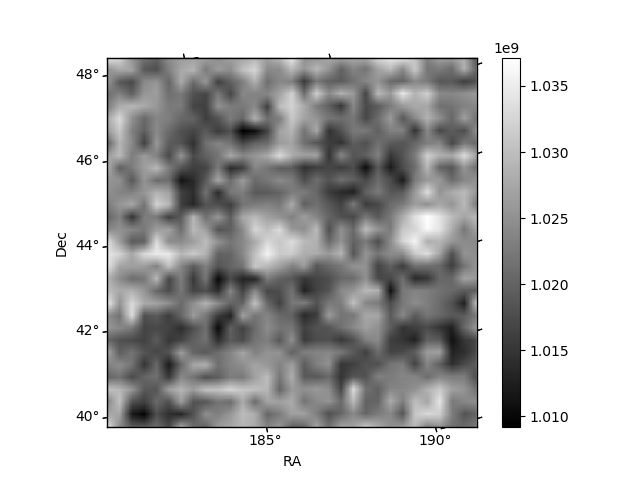
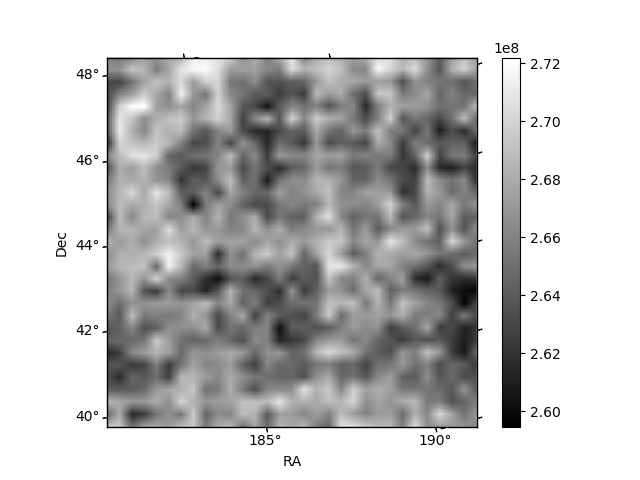
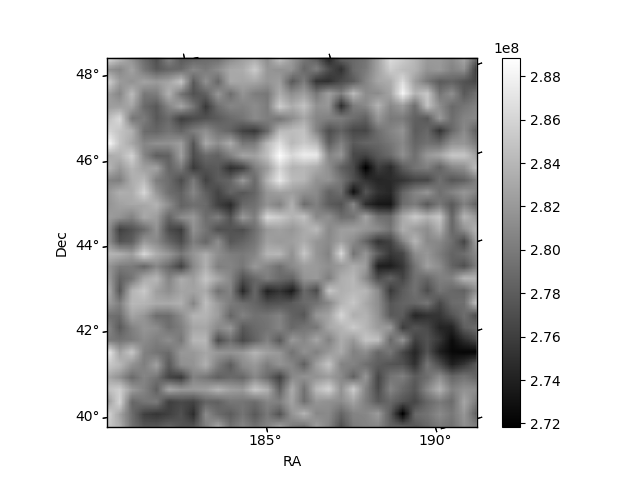
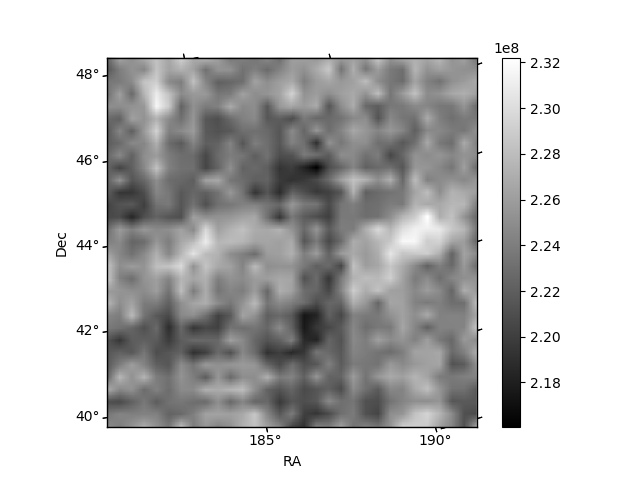
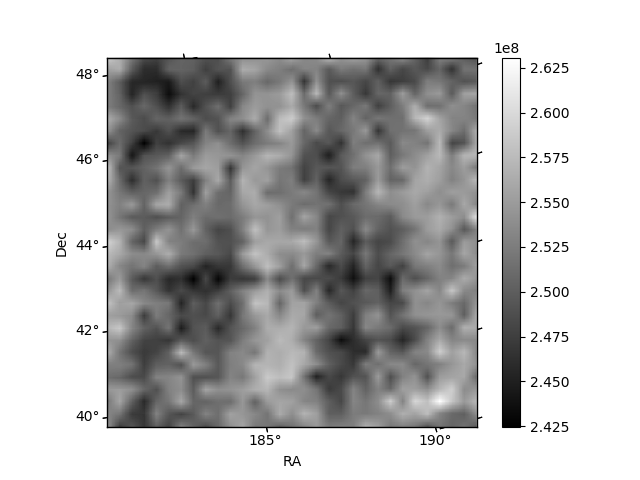
Histogram calculated using DETX and DETY for each event in the final _common_clean file
| Quadrant A | 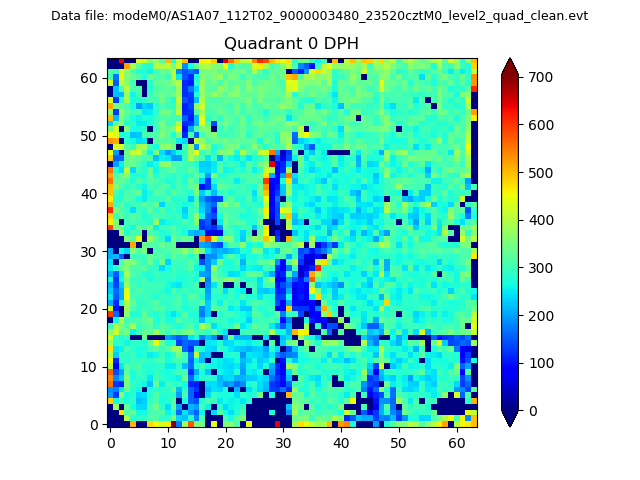 |
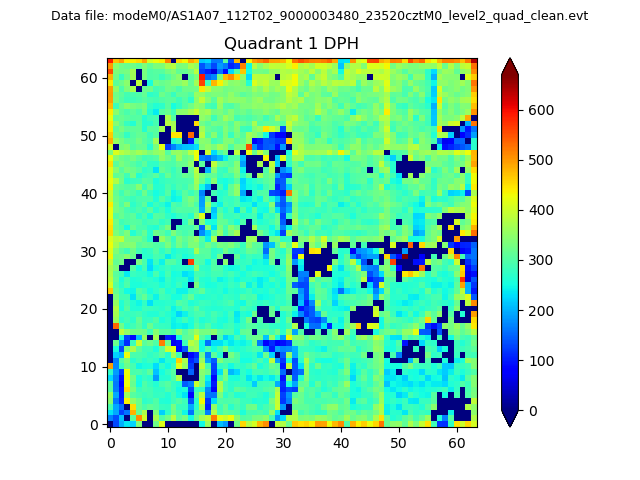 |
Quadrant B |
|---|---|---|---|
| Quadrant D | 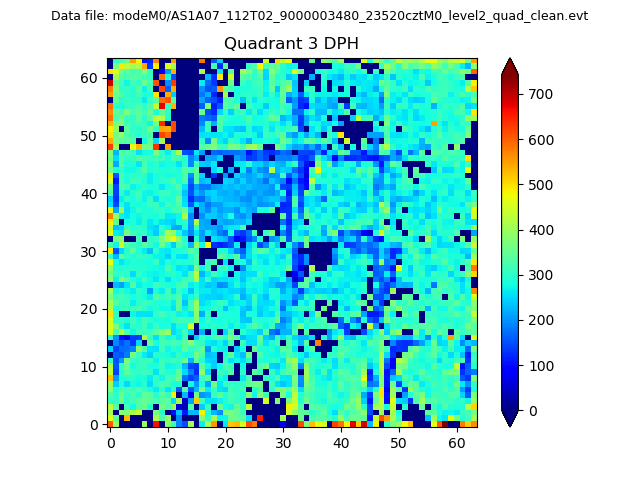 |
 |
Quadrant C |
| Plot type | Count rate plots | Images |
|---|---|---|
| Comparison with Poisson distribution Blue bars denote a histogram of data divided into 1 sec bins. Red curve is a Poisson curve with rate = median count rate of data. |
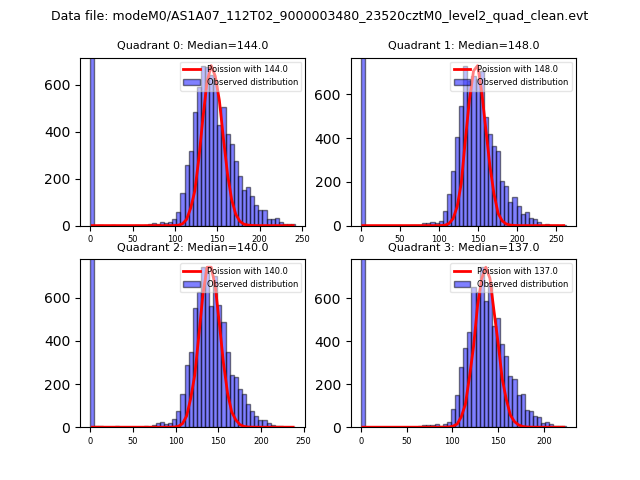 |
 |
| Quadrant-wise count rates Data is divided into 100 sec bins |
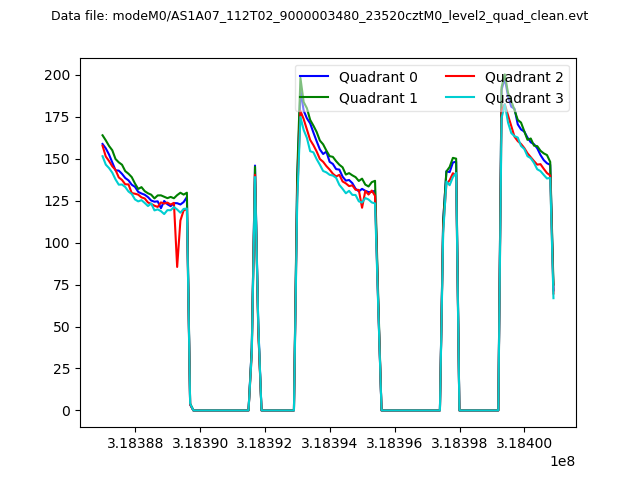 |
|
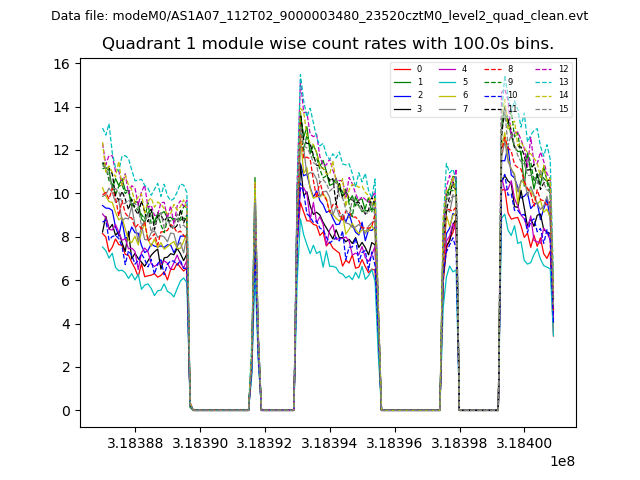
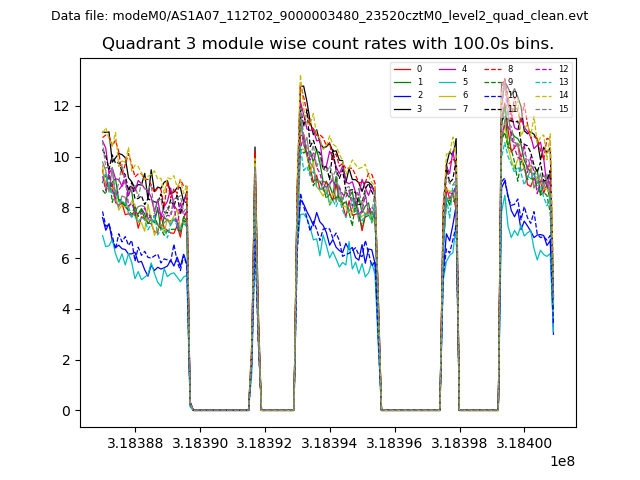
| Module-wise count rates for Quadrant A Data is divided into 100 sec bins |
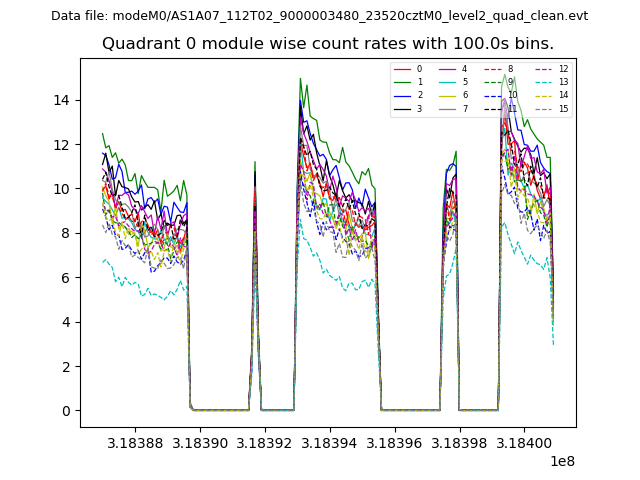 |
 |
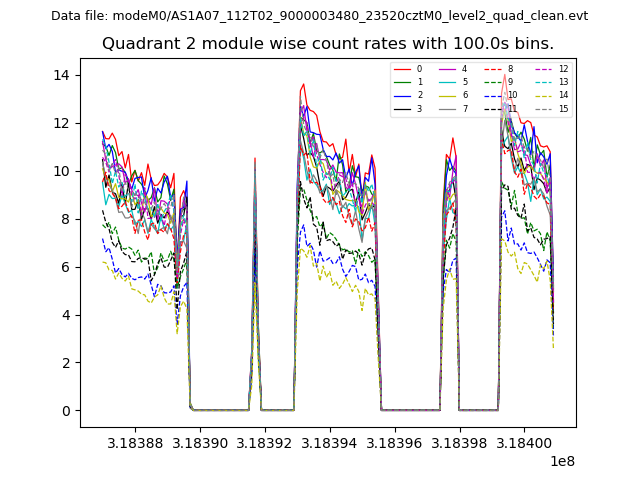
| Module-wise count rates for Quadrant B Data is divided into 100 sec bins |
 |
 |
| Module-wise count rates for Quadrant C Data is divided into 100 sec bins |
 |
 |
| Module-wise count rates for Quadrant D Data is divided into 100 sec bins |
 |
 |
| Parameter | Plot |
|---|---|
| CZT HV Monitor | 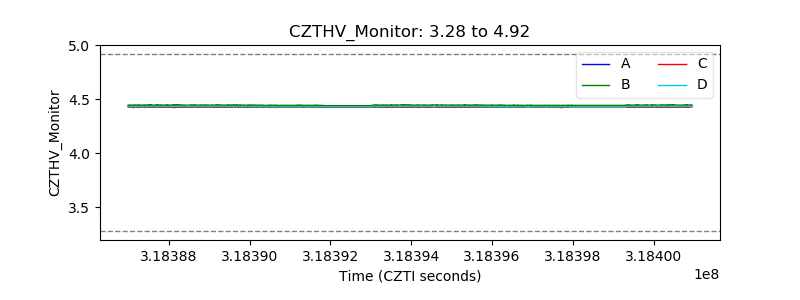 |
| D_VDD | 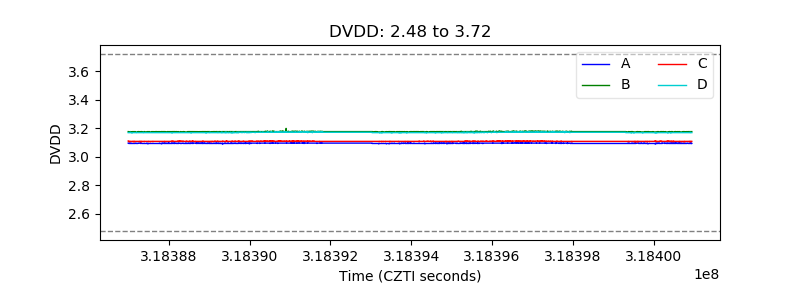 |
| Temperature 1 |  |
| Veto HV Monitor | 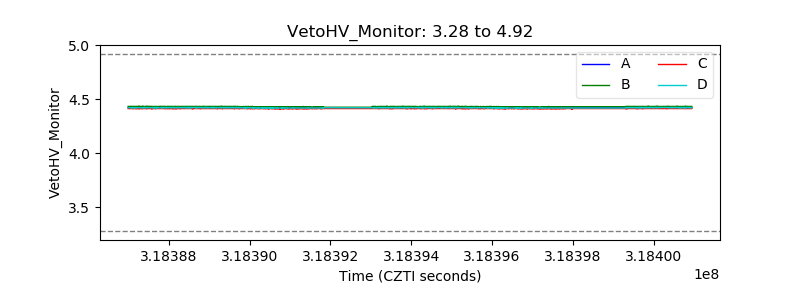 |
| Veto LLD | 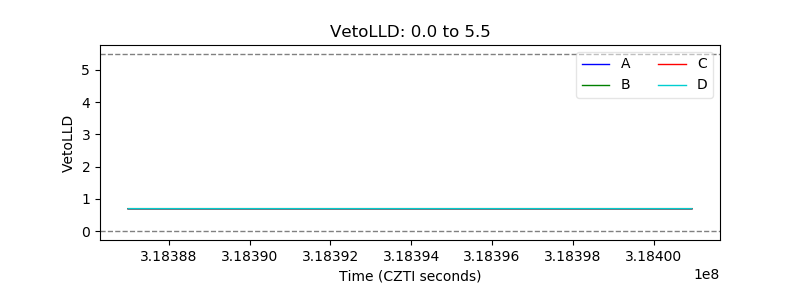 |
| Alpha Counter | 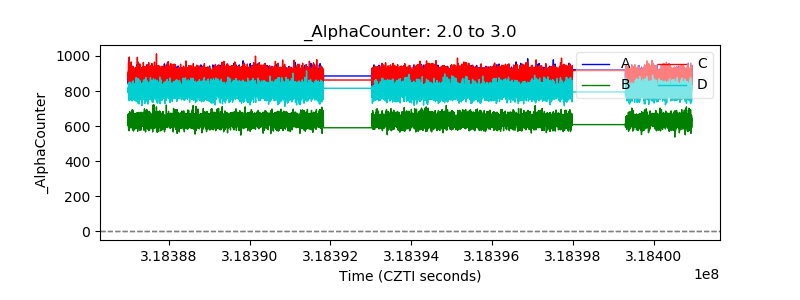 |
| _CPM_Rate | 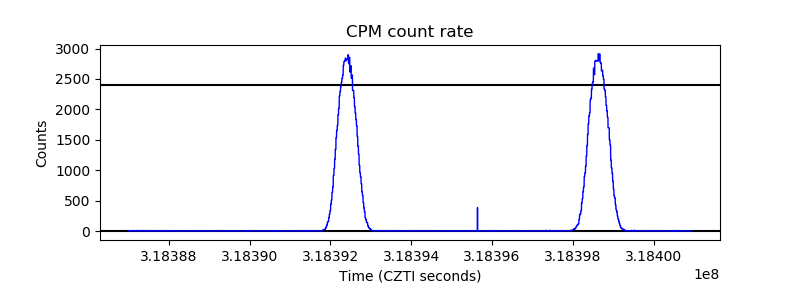 |
| CZT Counter | 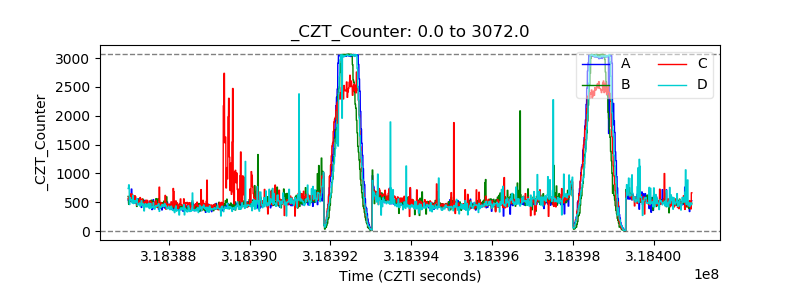 |
| +2.5 Volts monitor |  |
| +5 Volts monitor | 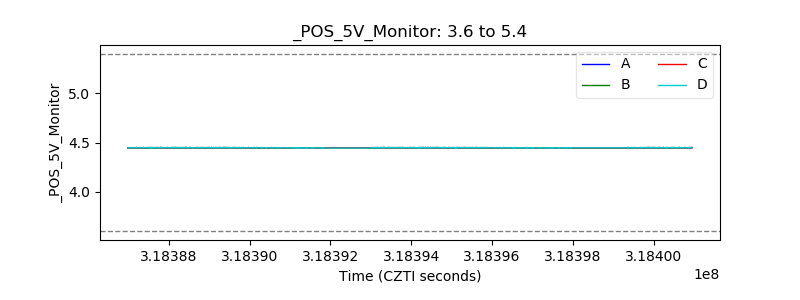 |
| _ROLL_ROT | 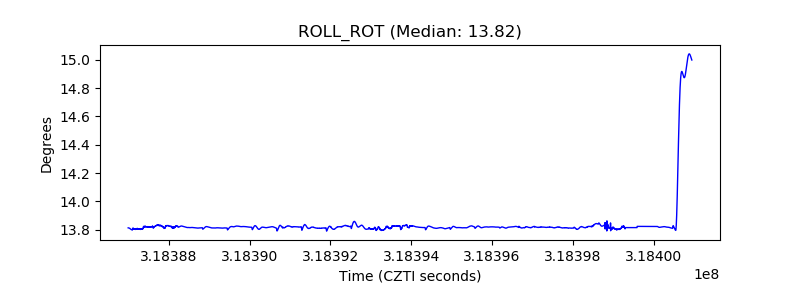 |
| _Roll_DEC | 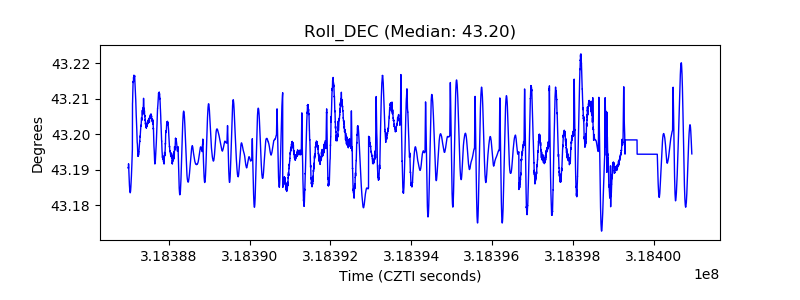 |
| _Roll_RA | 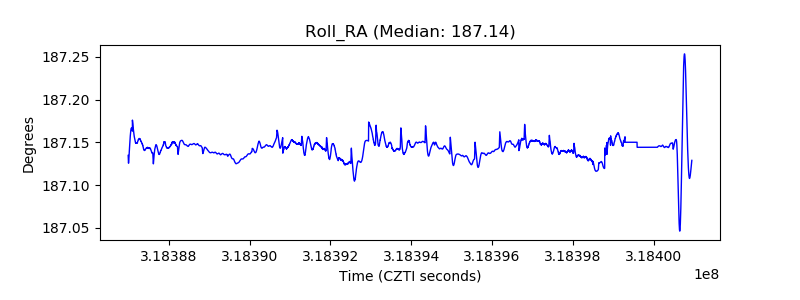 |
| Veto Counter | 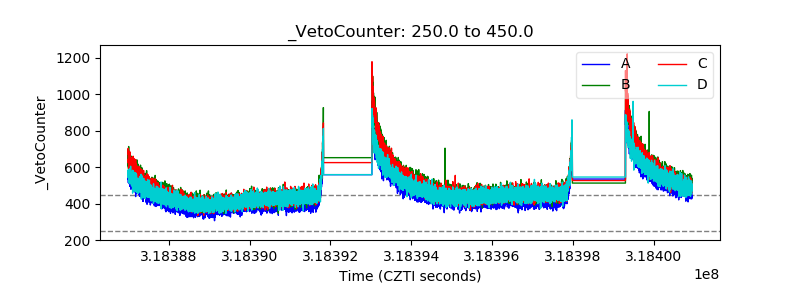 |