| Param | Original file | Final file |
|---|---|---|
| Filename | modeM0/AS1A07_112T02_9000003480_23521cztM0_level2.evt | modeM0/AS1A07_112T02_9000003480_23521cztM0_level2_quad_clean.evt |
| Size (bytes) | 398,171,520 | 85,472,640 |
| Size | 379.7 MB | 81.5 MB |
| Events in quadrant A | 2,861,906 | 563,653 |
| Events in quadrant B | 2,903,197 | 569,831 |
| Events in quadrant C | 2,893,637 | 536,418 |
| Events in quadrant D | 3,021,689 | 529,433 |
| Mode M9 | |||
|---|---|---|---|
| Quadrant | BADHDUFLAG | Total packets | Discarded packets |
| A | 0 | 13 | 0 |
| B | 0 | 13 | 0 |
| C | 0 | 13 | 0 |
| D | 0 | 13 | 0 |
| Mode SS | |||
|---|---|---|---|
| Quadrant | BADHDUFLAG | Total packets | Discarded packets |
| A | 0 | 114 | 0 |
| B | 0 | 114 | 0 |
| C | 0 | 114 | 0 |
| D | 0 | 114 | 0 |
| Mode M0 | |||
|---|---|---|---|
| Quadrant | BADHDUFLAG | Total packets | Discarded packets |
| A | 0 | 11602 | 1 |
| B | 0 | 11750 | 1 |
| C | 0 | 11767 | 1 |
| D | 0 | 12291 | 1 |
| Quadrant | Total seconds | Saturated seconds | Saturation percentage |
|---|---|---|---|
| A | 5558 | 44 | 0.791652% |
| B | 5558 | 59 | 1.061533% |
| C | 5558 | 85 | 1.529327% |
| D | 5558 | 35 | 0.629723% |
Noise dominated data is calculated using 1-second bins in cleaned event files. If a bin has >2000 counts, and if more than 50% of those come from <1% of pixels, then it is considered to be noise-dominated and hence unusable.
| Quadrant | # 1 sec bins | Bins with >0 counts | Bins with >2000 counts | High rate bins dominated by noise | Noise dominated (total time) | Noise dominated (detector-on time) | Marked lightcurve |
|---|---|---|---|---|---|---|---|
| A | 6903 | 5558 | 0 | 0 | 0.00% | 0.00% | 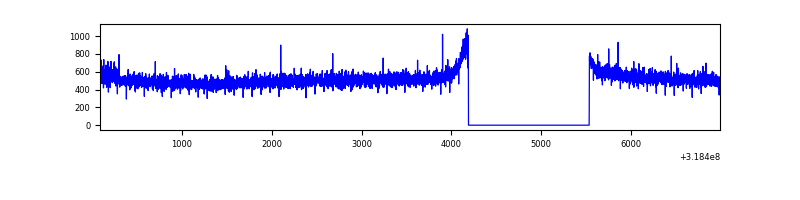 |
| B | 6903 | 5558 | 3 | 3 | 0.04% | 0.05% | 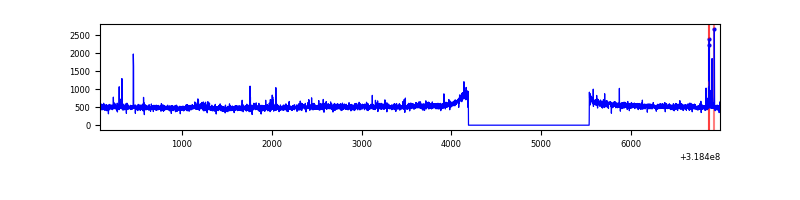 |
| C | 6903 | 5559 | 11 | 11 | 0.16% | 0.20% | 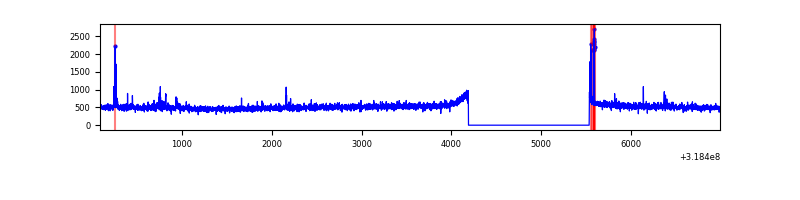 |
| D | 6903 | 5559 | 4 | 4 | 0.06% | 0.07% | 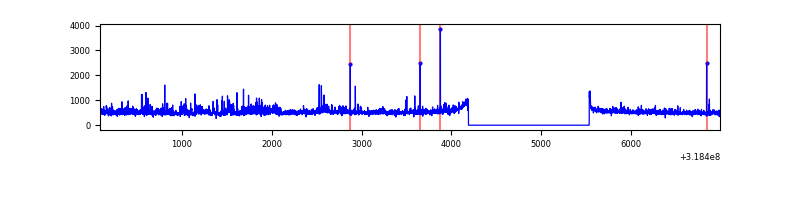 |
Top three noisy pixels from each quadrant. If the there are fewer than three noisy pixels in the level2.evt file, extra rows are filled as -1
| Pixel properties | Quadrant properties | ||||||
|---|---|---|---|---|---|---|---|
| Quadrant | DetID | PixID | Counts | Sigma | Mean | Median | Sigma |
| A | 4 | 2 | 14495 | 92.75 | 739 | 725 | 148.5 |
| A | 13 | 254 | 9103 | 56.43 | 739 | 725 | 148.5 |
| A | 0 | 226 | 6508 | 38.95 | 739 | 725 | 148.5 |
| B | 5 | 172 | 21756 | 156.52 | 723 | 708 | 134.5 |
| B | 0 | 189 | 19180 | 137.36 | 723 | 708 | 134.5 |
| B | 12 | 111 | 15442 | 109.56 | 723 | 708 | 134.5 |
| C | 14 | 238 | 114088 | 709.44 | 690 | 693 | 159.8 |
| C | 7 | 247 | 36872 | 226.35 | 690 | 693 | 159.8 |
| C | 0 | 10 | 28953 | 176.8 | 690 | 693 | 159.8 |
| D | 1 | 52 | 276686 | 1606.93 | 709 | 689 | 171.8 |
| D | 8 | 195 | 28710 | 163.15 | 709 | 689 | 171.8 |
| D | 2 | 234 | 22906 | 129.35 | 709 | 689 | 171.8 |
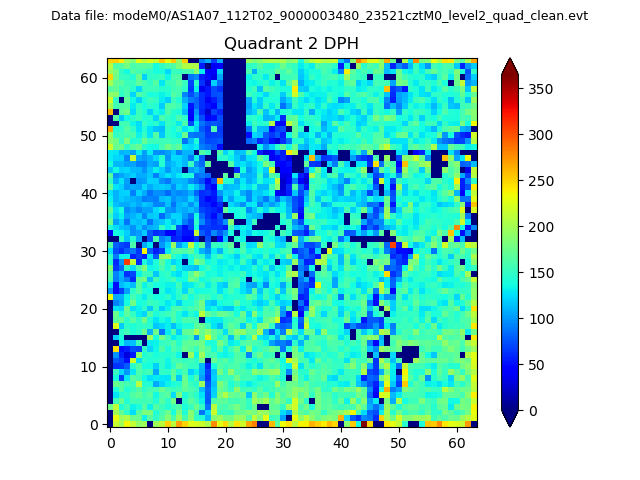
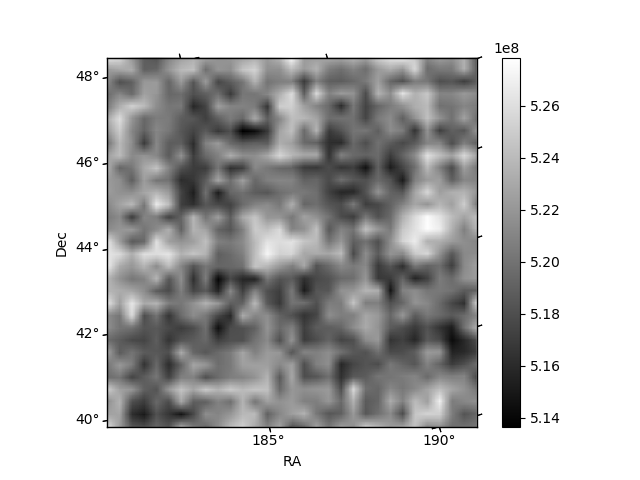
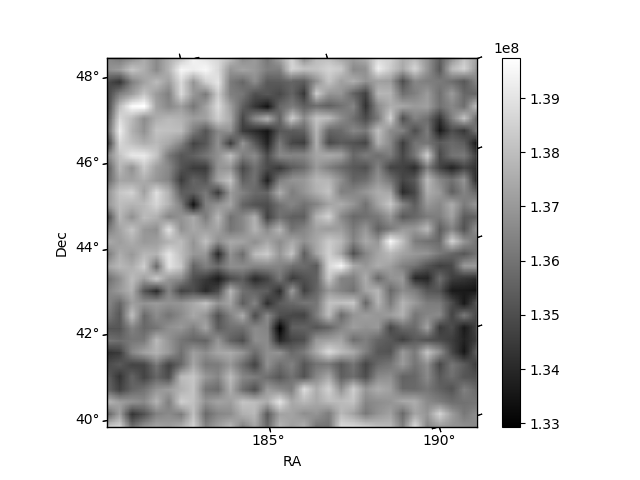
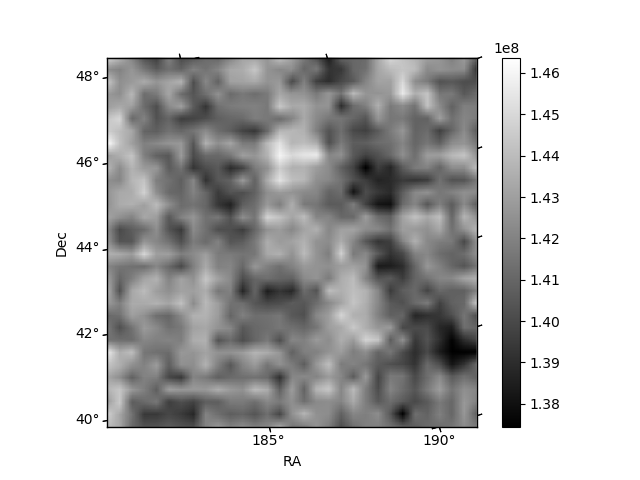
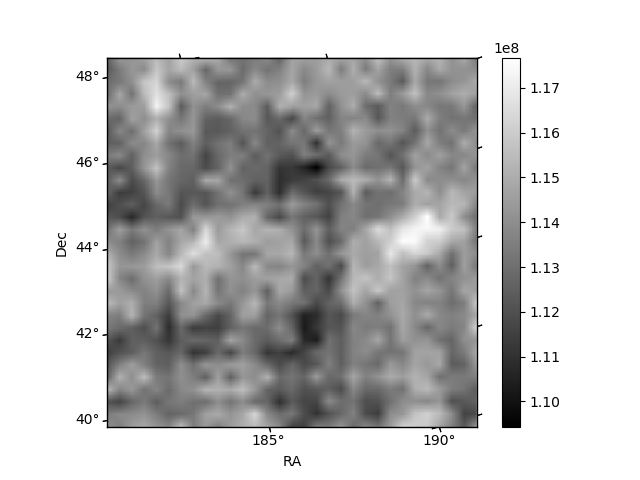
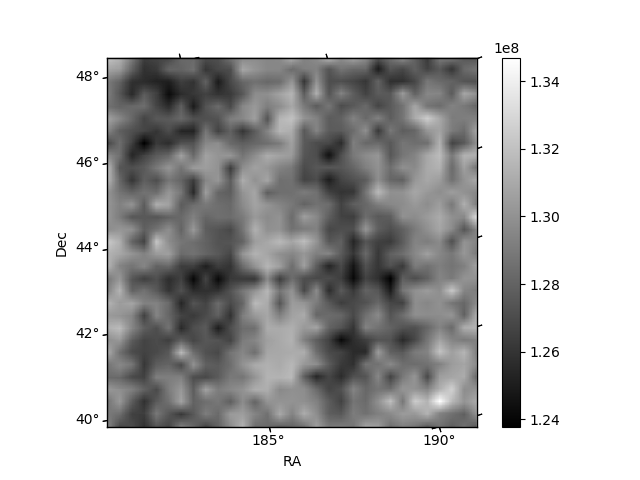
Histogram calculated using DETX and DETY for each event in the final _common_clean file
| Quadrant A | 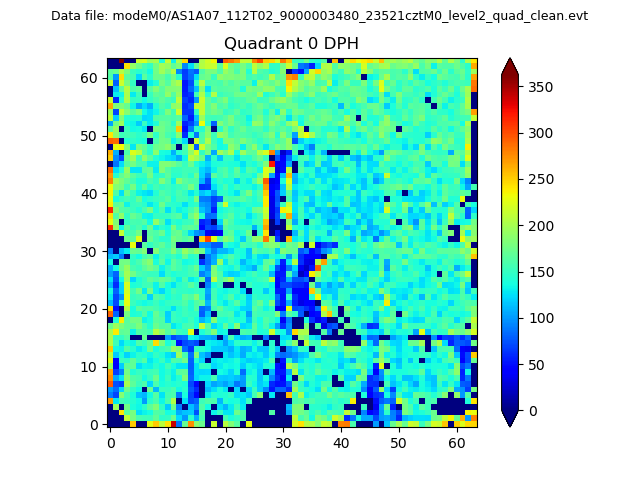 |
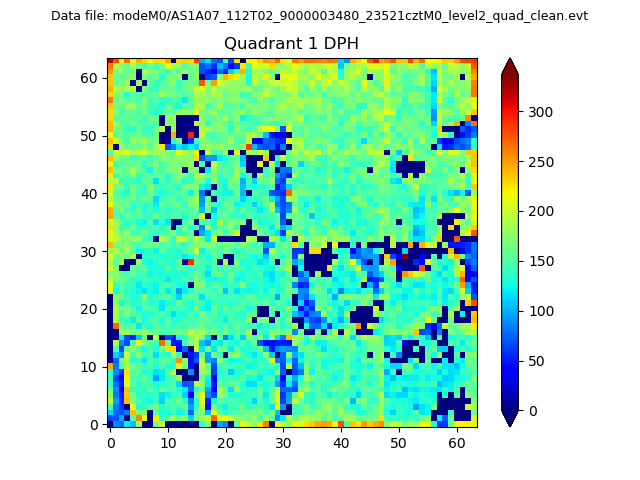 |
Quadrant B |
|---|---|---|---|
| Quadrant D | 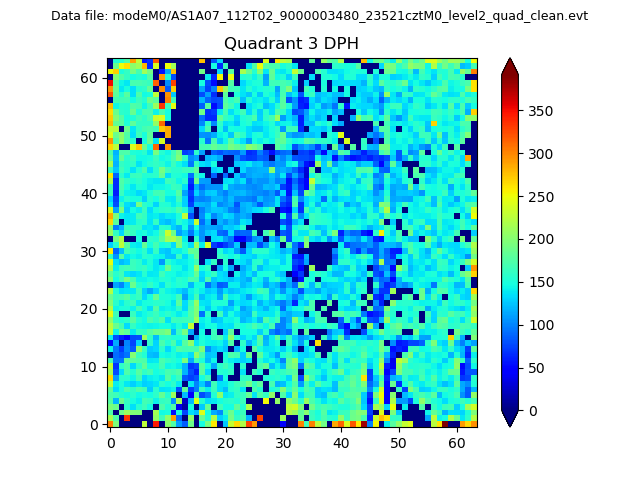 |
 |
Quadrant C |
| Plot type | Count rate plots | Images |
|---|---|---|
| Comparison with Poisson distribution Blue bars denote a histogram of data divided into 1 sec bins. Red curve is a Poisson curve with rate = median count rate of data. |
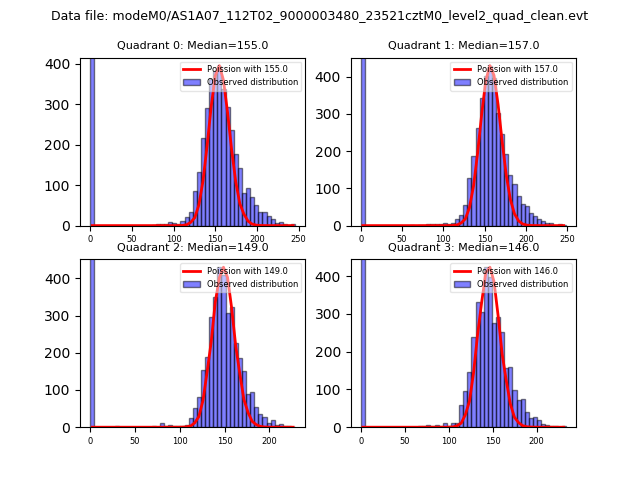 |
 |
| Quadrant-wise count rates Data is divided into 100 sec bins |
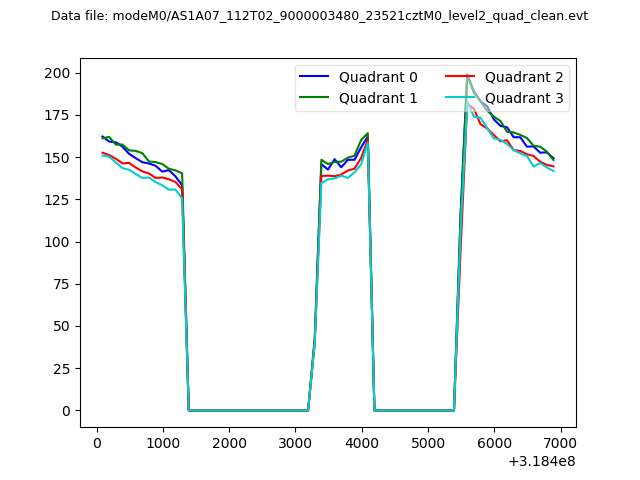 |
|
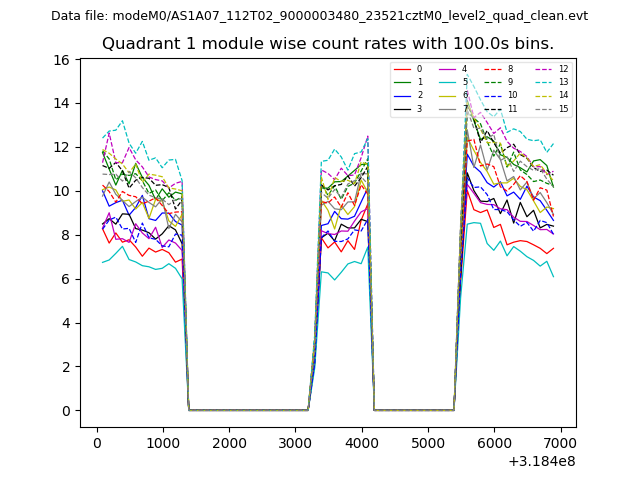
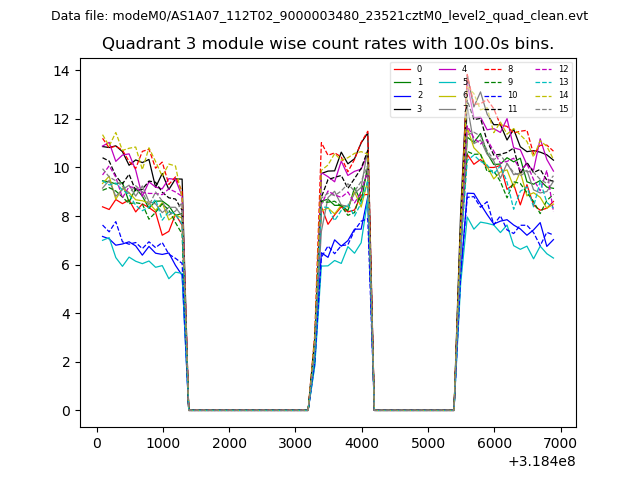
| Module-wise count rates for Quadrant A Data is divided into 100 sec bins |
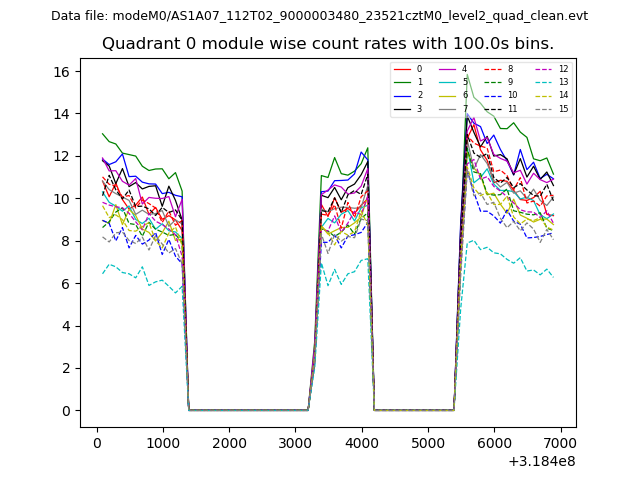 |
 |
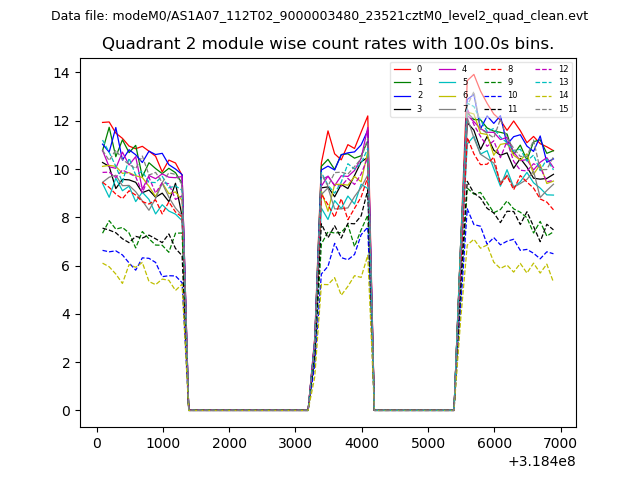
| Module-wise count rates for Quadrant B Data is divided into 100 sec bins |
 |
 |
| Module-wise count rates for Quadrant C Data is divided into 100 sec bins |
 |
 |
| Module-wise count rates for Quadrant D Data is divided into 100 sec bins |
 |
 |
| Parameter | Plot |
|---|---|
| CZT HV Monitor | 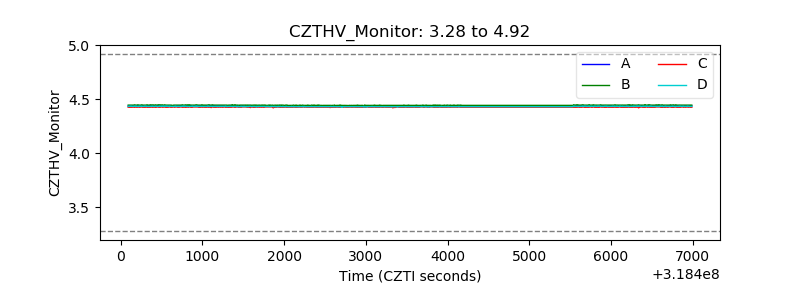 |
| D_VDD | 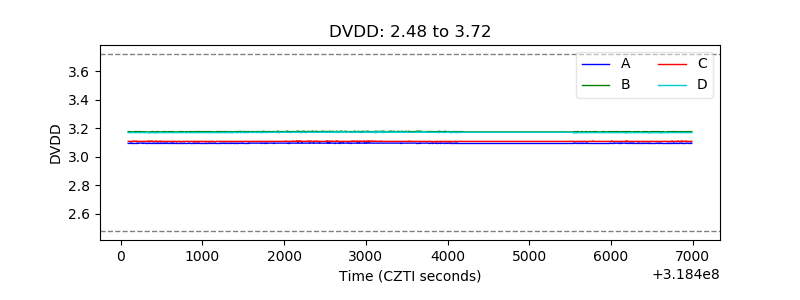 |
| Temperature 1 | 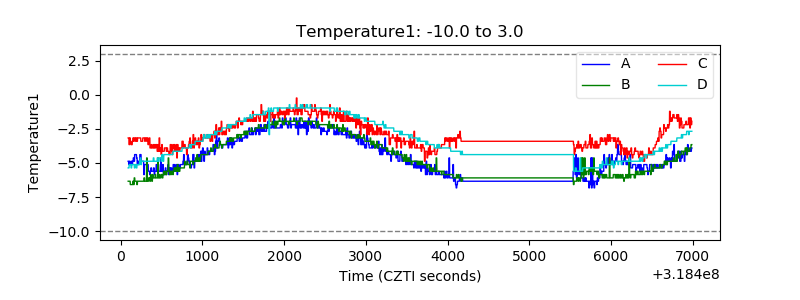 |
| Veto HV Monitor | 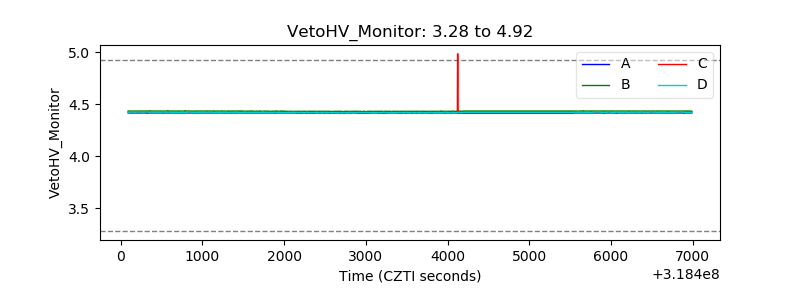 |
| Veto LLD | 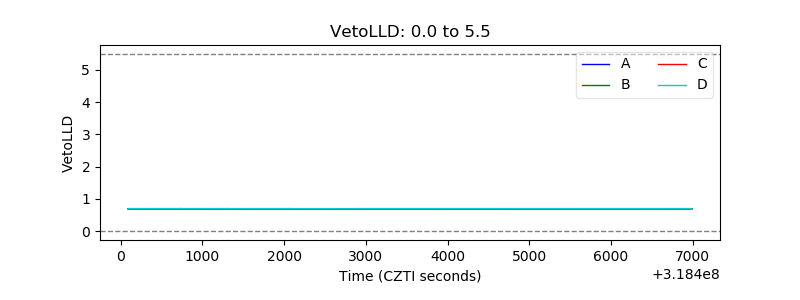 |
| Alpha Counter | 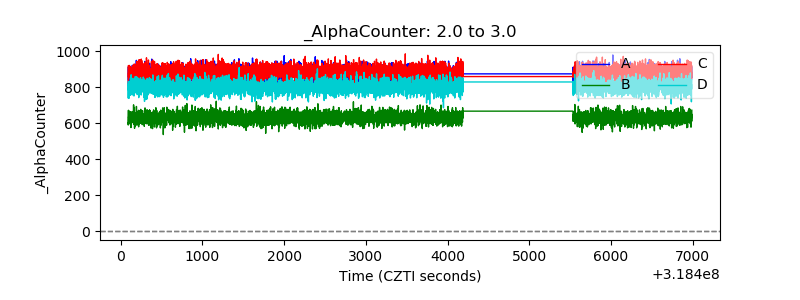 |
| _CPM_Rate | 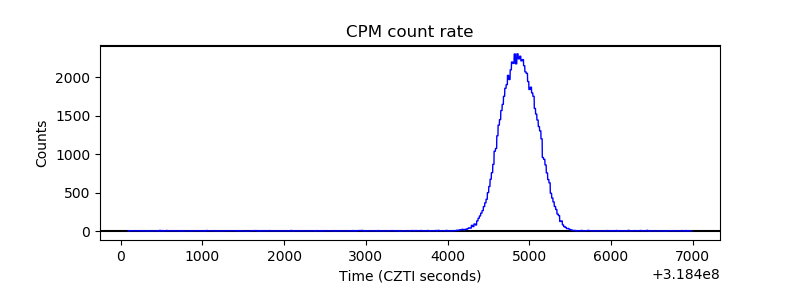 |
| CZT Counter | 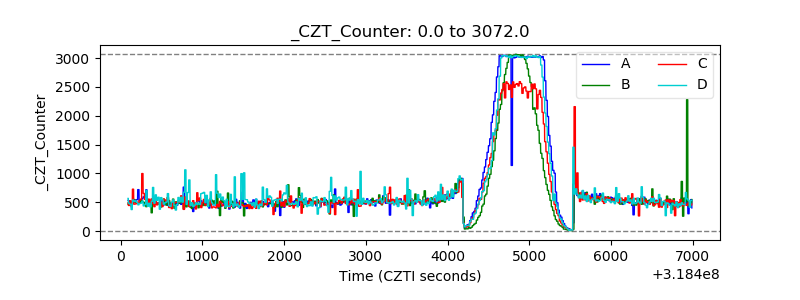 |
| +2.5 Volts monitor |  |
| +5 Volts monitor | 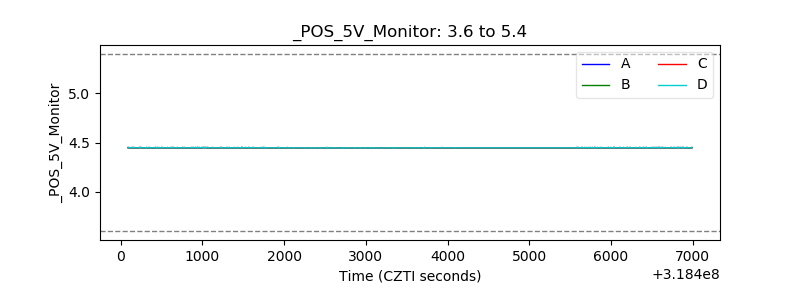 |
| _ROLL_ROT | 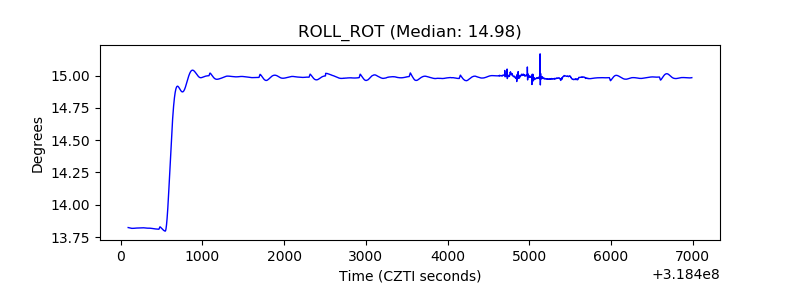 |
| _Roll_DEC | 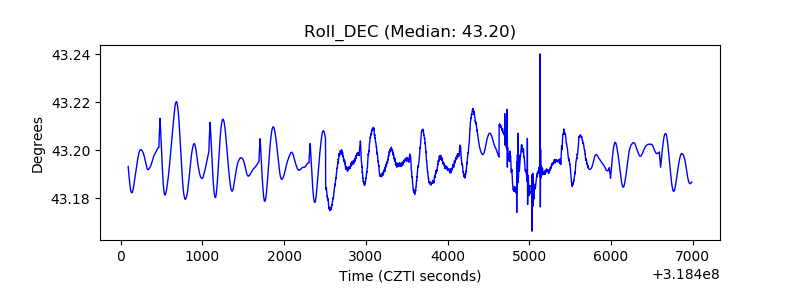 |
| _Roll_RA | 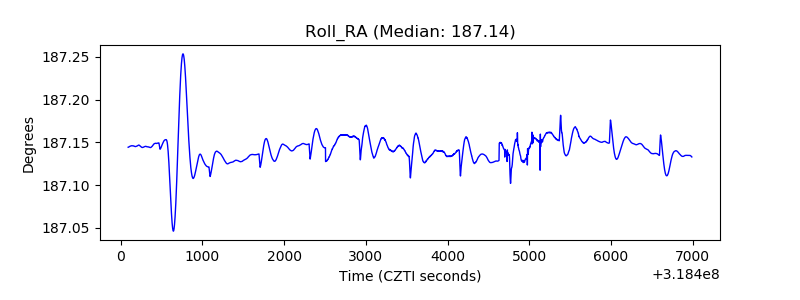 |
| Veto Counter | 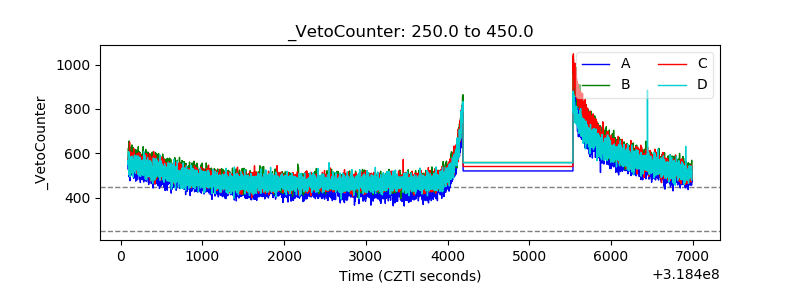 |