| Param | Original file | Final file |
|---|---|---|
| Filename | modeM0/AS1A07_112T02_9000003480_23522cztM0_level2.evt | modeM0/AS1A07_112T02_9000003480_23522cztM0_level2_quad_clean.evt |
| Size (bytes) | 430,286,400 | 92,882,880 |
| Size | 410.4 MB | 88.6 MB |
| Events in quadrant A | 3,056,184 | 614,580 |
| Events in quadrant B | 3,172,732 | 618,356 |
| Events in quadrant C | 3,034,264 | 585,954 |
| Events in quadrant D | 3,364,395 | 578,960 |
| Mode M9 | |||
|---|---|---|---|
| Quadrant | BADHDUFLAG | Total packets | Discarded packets |
| A | 0 | 13 | 0 |
| B | 0 | 13 | 0 |
| C | 0 | 13 | 0 |
| D | 0 | 13 | 0 |
| Mode SS | |||
|---|---|---|---|
| Quadrant | BADHDUFLAG | Total packets | Discarded packets |
| A | 0 | 122 | 0 |
| B | 0 | 122 | 0 |
| C | 0 | 122 | 0 |
| D | 0 | 122 | 0 |
| Mode M0 | |||
|---|---|---|---|
| Quadrant | BADHDUFLAG | Total packets | Discarded packets |
| A | 0 | 12306 | 1 |
| B | 0 | 12735 | 1 |
| C | 0 | 12338 | 1 |
| D | 0 | 13482 | 1 |
| Quadrant | Total seconds | Saturated seconds | Saturation percentage |
|---|---|---|---|
| A | 5935 | 45 | 0.758214% |
| B | 5936 | 60 | 1.010782% |
| C | 5936 | 69 | 1.162399% |
| D | 5936 | 62 | 1.044474% |
Noise dominated data is calculated using 1-second bins in cleaned event files. If a bin has >2000 counts, and if more than 50% of those come from <1% of pixels, then it is considered to be noise-dominated and hence unusable.
| Quadrant | # 1 sec bins | Bins with >0 counts | Bins with >2000 counts | High rate bins dominated by noise | Noise dominated (total time) | Noise dominated (detector-on time) | Marked lightcurve |
|---|---|---|---|---|---|---|---|
| A | 7285 | 5935 | 1 | 1 | 0.01% | 0.02% | 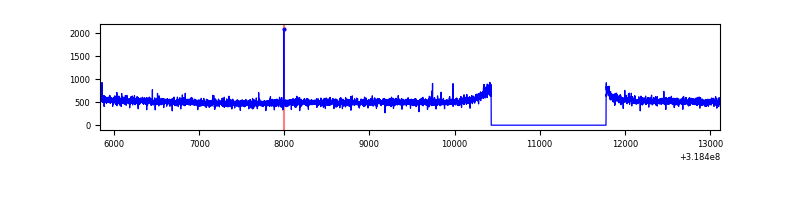 |
| B | 7286 | 5937 | 3 | 3 | 0.04% | 0.05% | 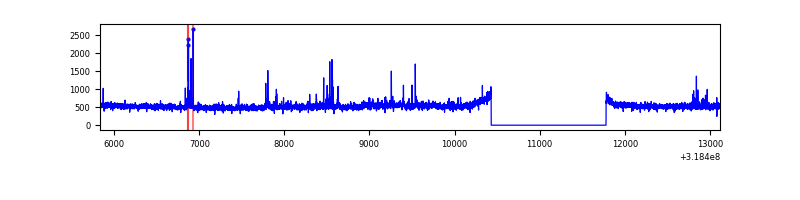 |
| C | 7286 | 5937 | 0 | 0 | 0.00% | 0.00% | 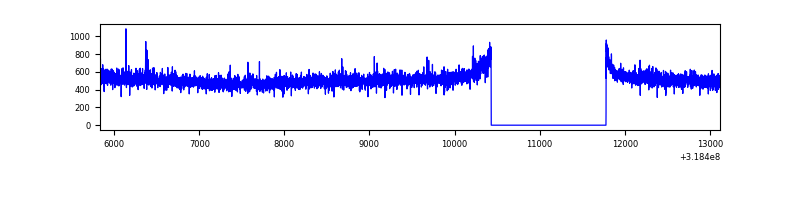 |
| D | 7286 | 5937 | 33 | 33 | 0.45% | 0.56% | 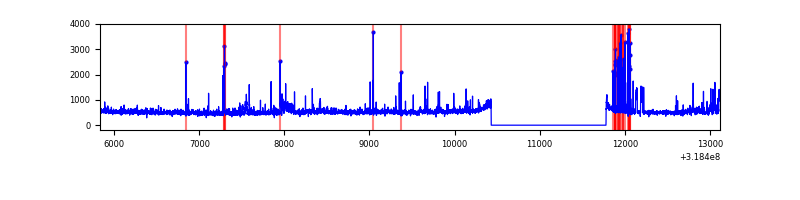 |
Top three noisy pixels from each quadrant. If the there are fewer than three noisy pixels in the level2.evt file, extra rows are filled as -1
| Pixel properties | Quadrant properties | ||||||
|---|---|---|---|---|---|---|---|
| Quadrant | DetID | PixID | Counts | Sigma | Mean | Median | Sigma |
| A | 13 | 254 | 10190 | 59.91 | 791 | 776 | 157.1 |
| A | 0 | 226 | 6849 | 38.65 | 791 | 776 | 157.1 |
| A | 3 | 137 | 6401 | 35.8 | 791 | 776 | 157.1 |
| B | 0 | 189 | 49733 | 339.96 | 774 | 758 | 144.1 |
| B | 0 | 230 | 33332 | 226.11 | 774 | 758 | 144.1 |
| B | 5 | 172 | 22325 | 149.7 | 774 | 758 | 144.1 |
| C | 14 | 238 | 121207 | 704.4 | 739 | 745 | 171.0 |
| C | 2 | 16 | 14176 | 78.54 | 739 | 745 | 171.0 |
| C | 7 | 247 | 11206 | 61.17 | 739 | 745 | 171.0 |
| D | 1 | 52 | 376824 | 2065.32 | 760 | 739 | 182.1 |
| D | 8 | 195 | 41910 | 226.1 | 760 | 739 | 182.1 |
| D | 2 | 234 | 23681 | 125.99 | 760 | 739 | 182.1 |
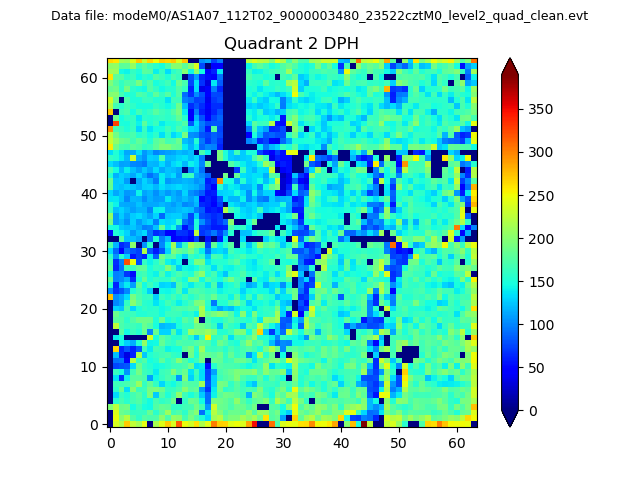
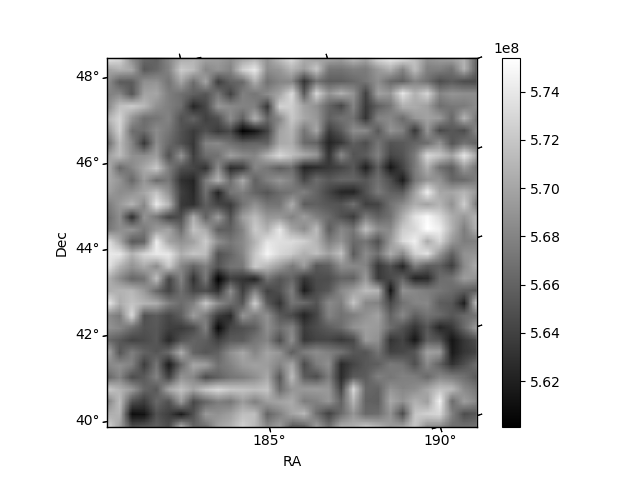
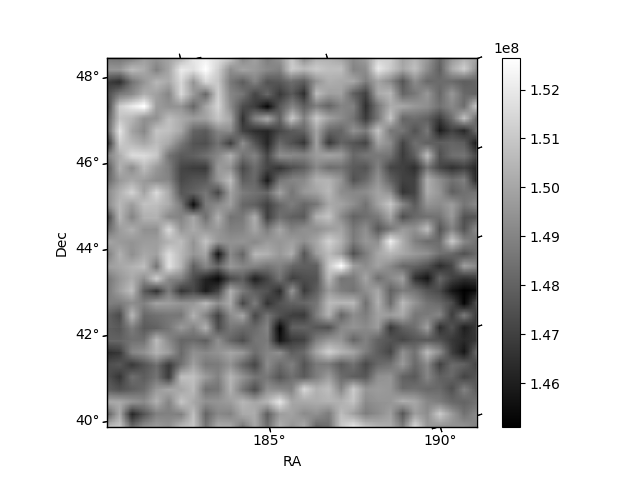
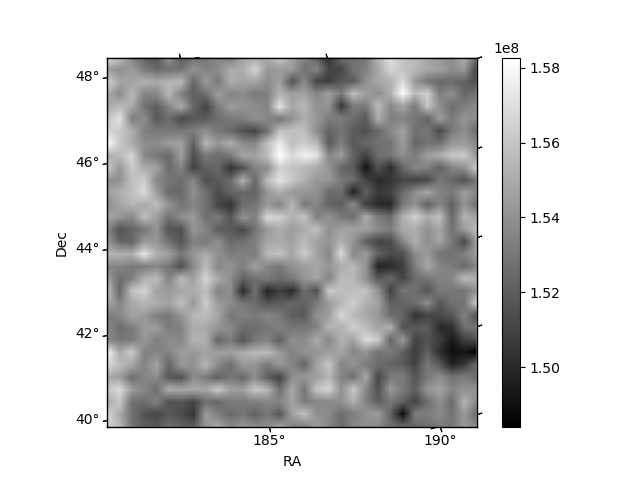
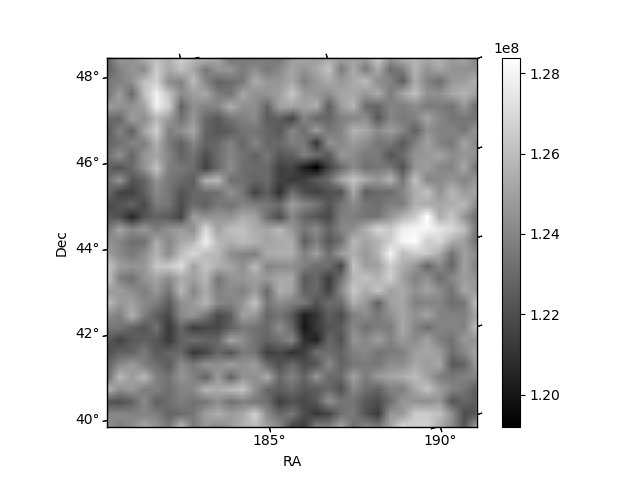
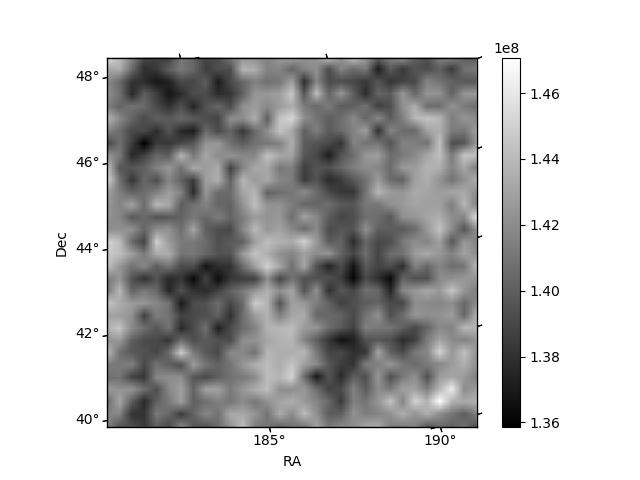
Histogram calculated using DETX and DETY for each event in the final _common_clean file
| Quadrant A | 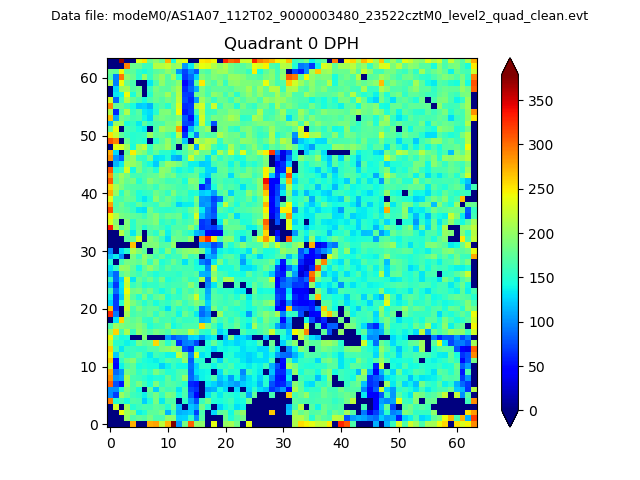 |
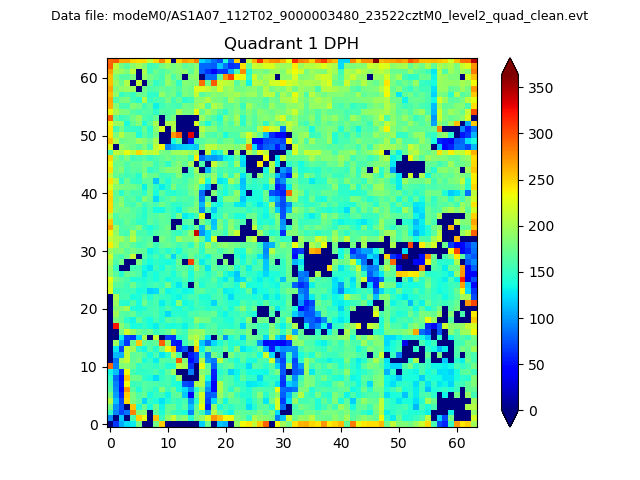 |
Quadrant B |
|---|---|---|---|
| Quadrant D | 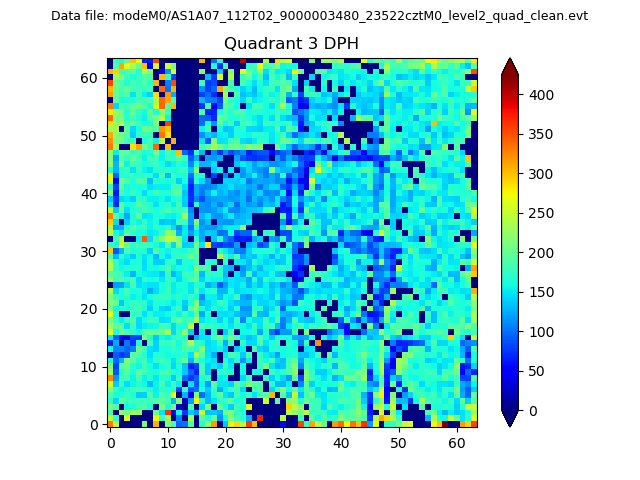 |
 |
Quadrant C |
| Plot type | Count rate plots | Images |
|---|---|---|
| Comparison with Poisson distribution Blue bars denote a histogram of data divided into 1 sec bins. Red curve is a Poisson curve with rate = median count rate of data. |
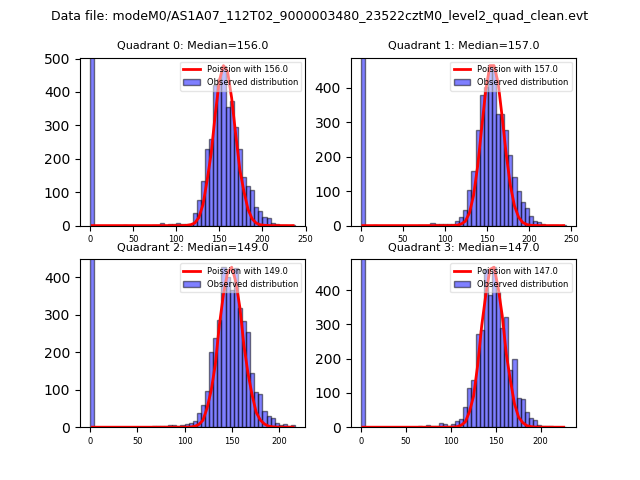 |
 |
| Quadrant-wise count rates Data is divided into 100 sec bins |
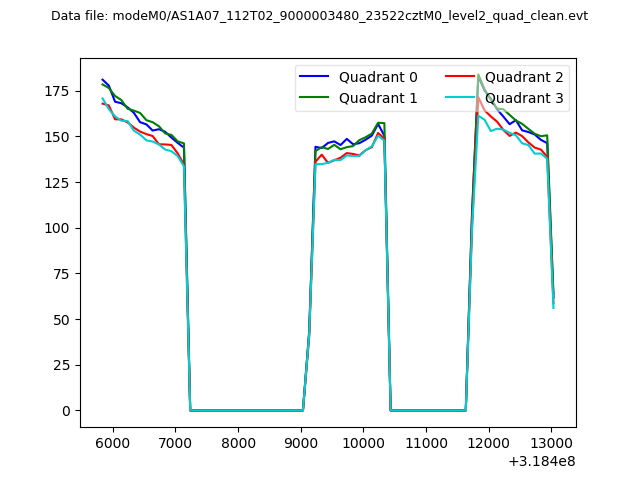 |
|
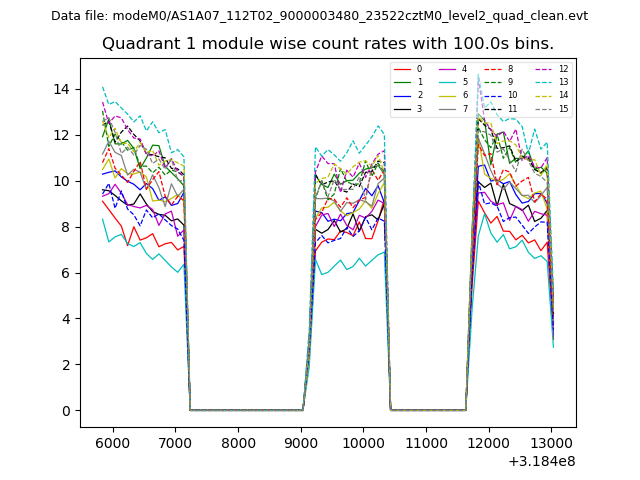
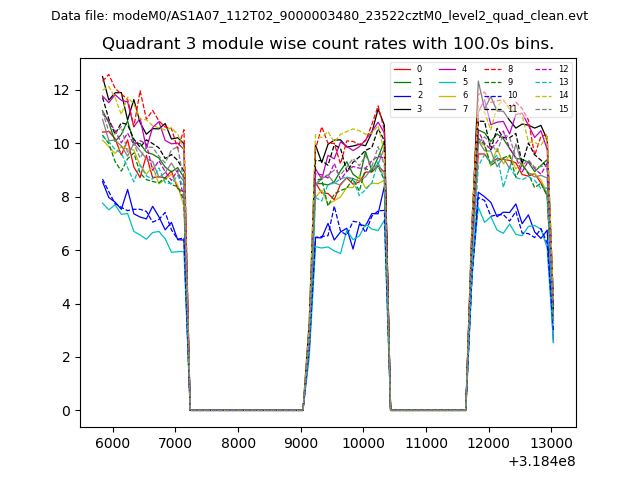
| Module-wise count rates for Quadrant A Data is divided into 100 sec bins |
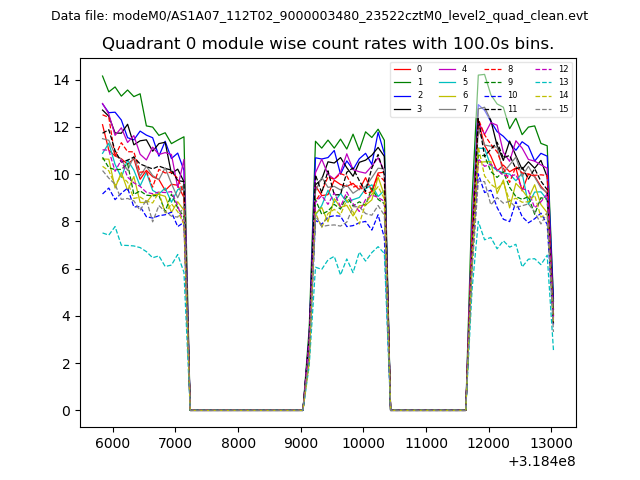 |
 |
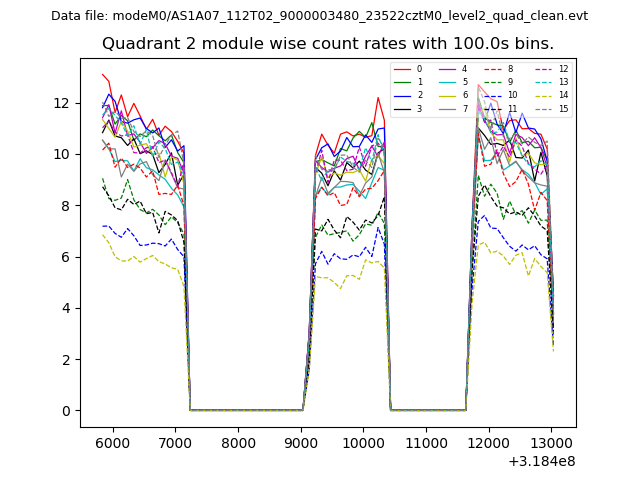
| Module-wise count rates for Quadrant B Data is divided into 100 sec bins |
 |
 |
| Module-wise count rates for Quadrant C Data is divided into 100 sec bins |
 |
 |
| Module-wise count rates for Quadrant D Data is divided into 100 sec bins |
 |
 |
| Parameter | Plot |
|---|---|
| CZT HV Monitor | 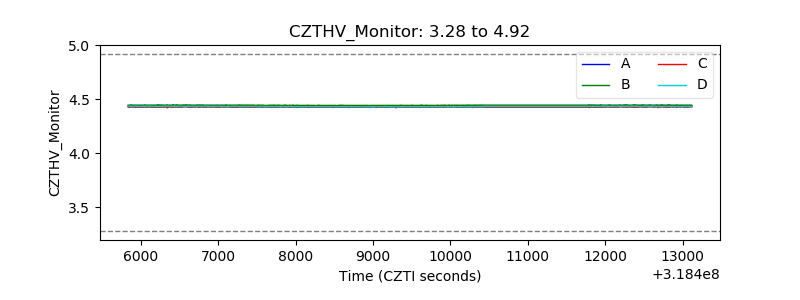 |
| D_VDD | 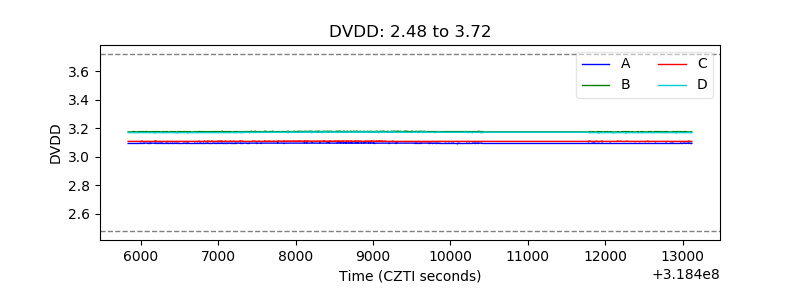 |
| Temperature 1 | 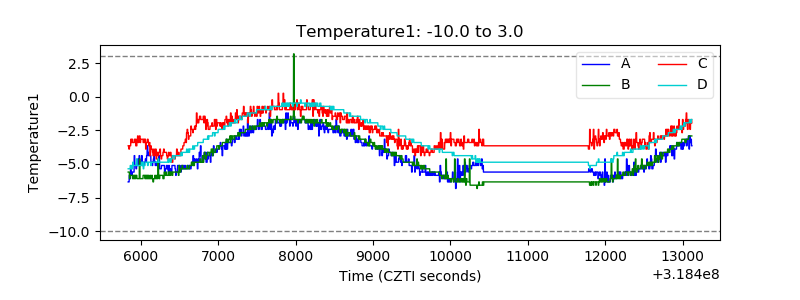 |
| Veto HV Monitor | 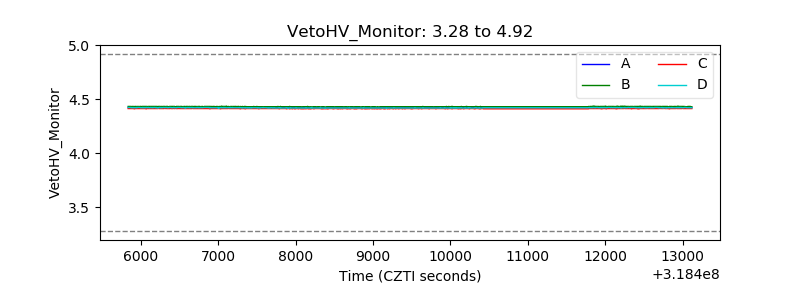 |
| Veto LLD | 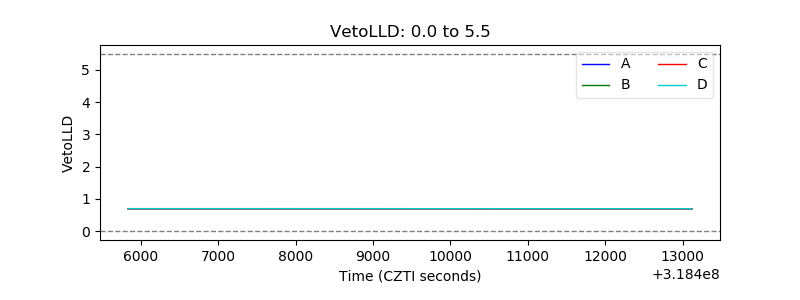 |
| Alpha Counter | 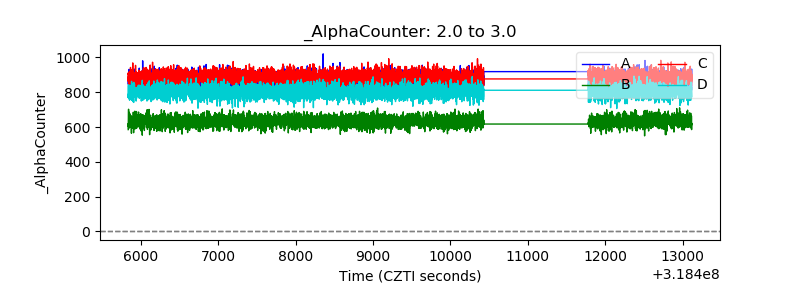 |
| _CPM_Rate | 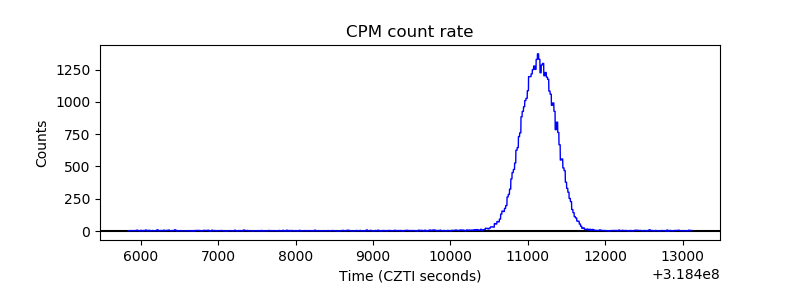 |
| CZT Counter | 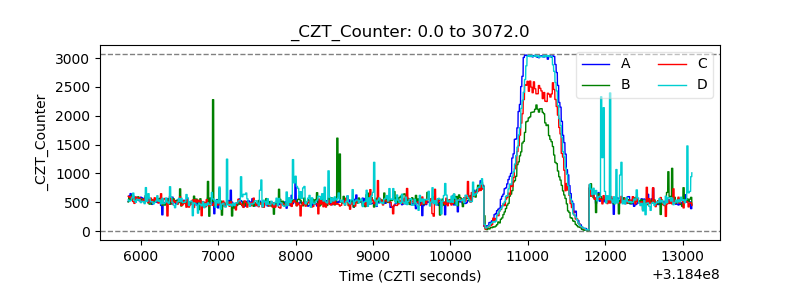 |
| +2.5 Volts monitor | 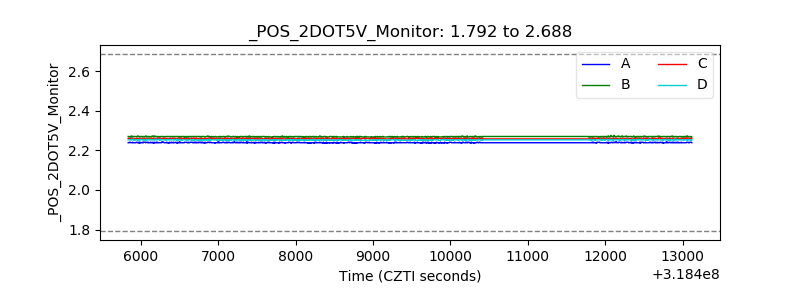 |
| +5 Volts monitor |  |
| _ROLL_ROT | 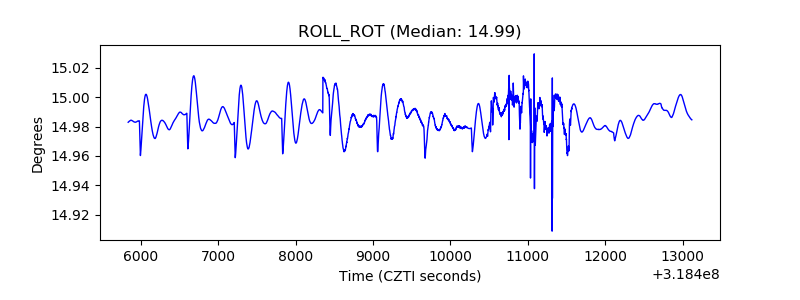 |
| _Roll_DEC | 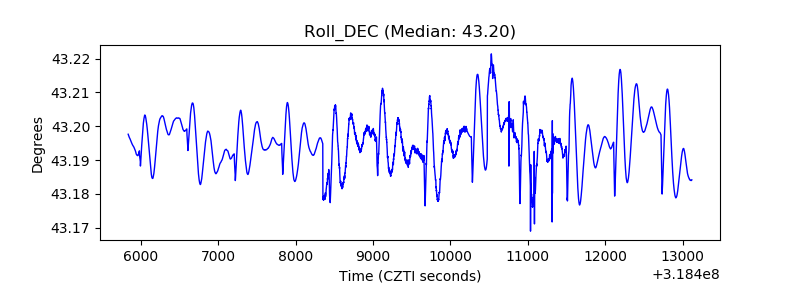 |
| _Roll_RA | 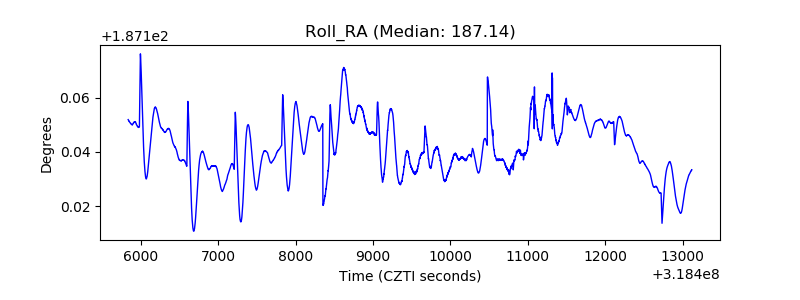 |
| Veto Counter | 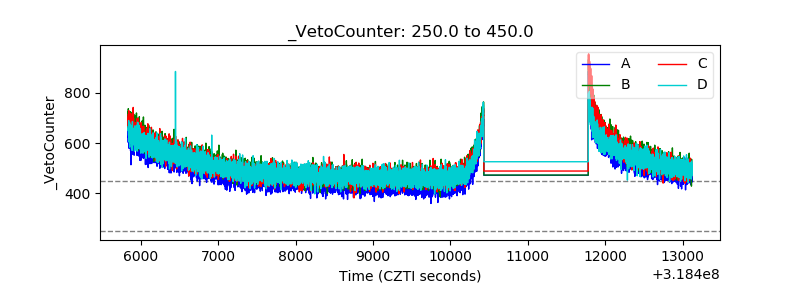 |