| Param | Original file | Final file |
|---|---|---|
| Filename | modeM0/AS1A07_112T02_9000003480_23698cztM0_level2.evt | modeM0/AS1A07_112T02_9000003480_23698cztM0_level2_quad_clean.evt |
| Size (bytes) | 49,023,360 | 15,816,960 |
| Size | 46.8 MB | 15.1 MB |
| Events in quadrant A | 350,947 | 102,624 |
| Events in quadrant B | 370,573 | 106,452 |
| Events in quadrant C | 353,951 | 102,498 |
| Events in quadrant D | 347,604 | 99,912 |
| Mode M9 | |||
|---|---|---|---|
| Quadrant | BADHDUFLAG | Total packets | Discarded packets |
| A | 0 | 4 | 4 |
| B | 0 | 6 | 6 |
| C | 0 | 6 | 6 |
| D | 0 | 6 | 6 |
| Mode SS | |||
|---|---|---|---|
| Quadrant | BADHDUFLAG | Total packets | Discarded packets |
| A | 0 | 50 | 30 |
| B | 0 | 42 | 24 |
| C | 0 | 48 | 30 |
| D | 0 | 43 | 25 |
| Mode M0 | |||
|---|---|---|---|
| Quadrant | BADHDUFLAG | Total packets | Discarded packets |
| A | 0 | 4428 | 2734 |
| B | 0 | 4570 | 2846 |
| C | 0 | 4473 | 2780 |
| D | 0 | 4865 | 3148 |
| Quadrant | Total seconds | Saturated seconds | Saturation percentage |
|---|---|---|---|
| A | 847 | 0 | 0.000000% |
| B | 859 | 1 | 0.116414% |
| C | 846 | 1 | 0.118203% |
| D | 845 | 2 | 0.236686% |
Noise dominated data is calculated using 1-second bins in cleaned event files. If a bin has >2000 counts, and if more than 50% of those come from <1% of pixels, then it is considered to be noise-dominated and hence unusable.
| Quadrant | # 1 sec bins | Bins with >0 counts | Bins with >2000 counts | High rate bins dominated by noise | Noise dominated (total time) | Noise dominated (detector-on time) | Marked lightcurve |
|---|---|---|---|---|---|---|---|
| A | 1217 | 939 | 0 | 0 | 0.00% | 0.00% | 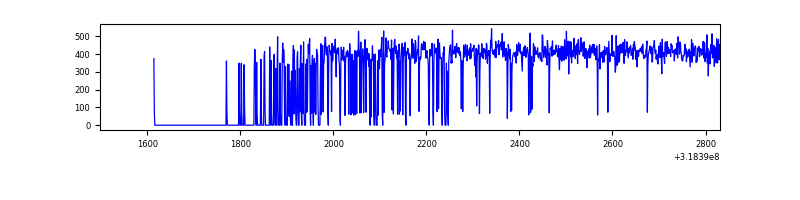 |
| B | 1333 | 957 | 0 | 0 | 0.00% | 0.00% | 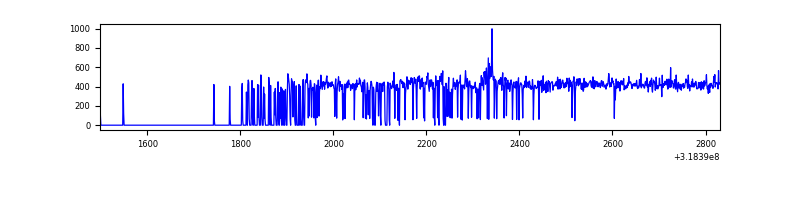 |
| C | 1149 | 953 | 0 | 0 | 0.00% | 0.00% | 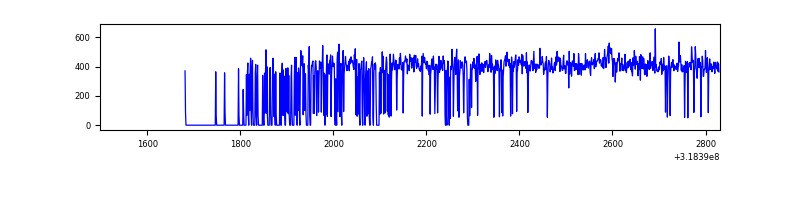 |
| D | 1170 | 956 | 2 | 2 | 0.17% | 0.21% | 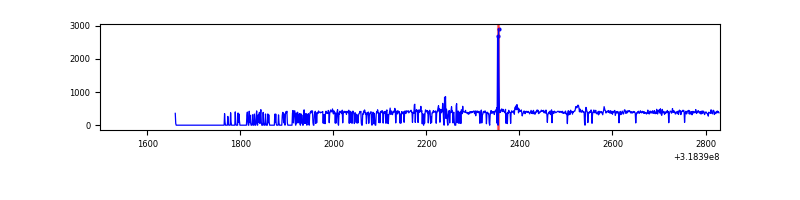 |
Top three noisy pixels from each quadrant. If the there are fewer than three noisy pixels in the level2.evt file, extra rows are filled as -1
| Pixel properties | Quadrant properties | ||||||
|---|---|---|---|---|---|---|---|
| Quadrant | DetID | PixID | Counts | Sigma | Mean | Median | Sigma |
| A | 13 | 254 | 1291 | 58.56 | 91 | 89 | 20.5 |
| A | 3 | 137 | 807 | 34.98 | 91 | 89 | 20.5 |
| A | 0 | 226 | 743 | 31.86 | 91 | 89 | 20.5 |
| B | 0 | 183 | 3745 | 182.46 | 93 | 91 | 20.0 |
| B | 12 | 111 | 2261 | 108.35 | 93 | 91 | 20.0 |
| B | 11 | 111 | 2028 | 96.72 | 93 | 91 | 20.0 |
| C | 14 | 238 | 13613 | 611.86 | 87 | 87 | 22.1 |
| C | 10 | 9 | 1535 | 65.5 | 87 | 87 | 22.1 |
| C | 13 | 61 | 557 | 21.26 | 87 | 87 | 22.1 |
| D | 12 | 217 | 6324 | 271.11 | 86 | 83 | 23.0 |
| D | 13 | 174 | 6292 | 269.72 | 86 | 83 | 23.0 |
| D | 1 | 52 | 4534 | 193.35 | 86 | 83 | 23.0 |
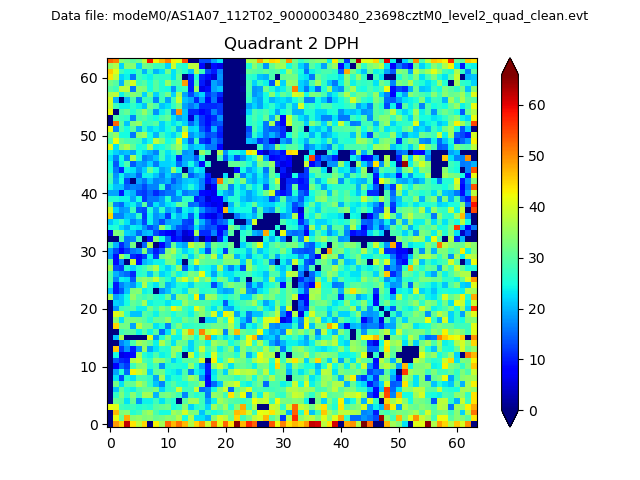
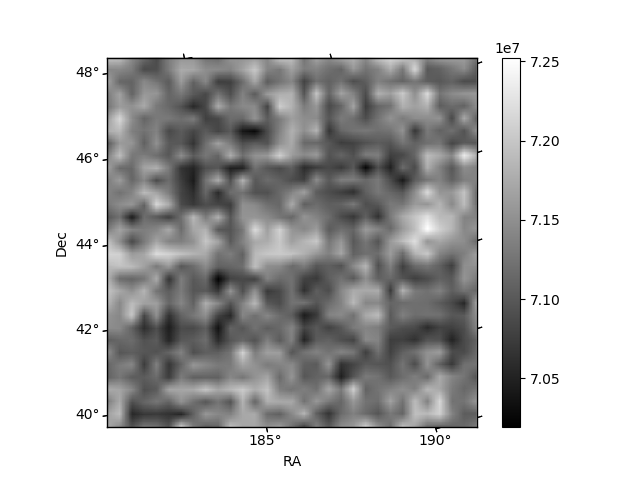
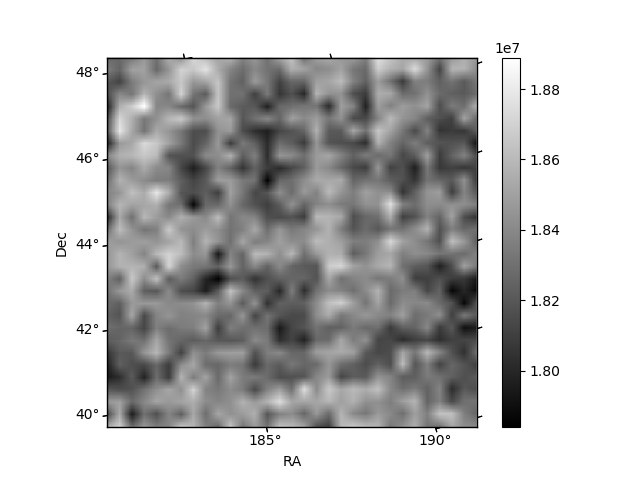
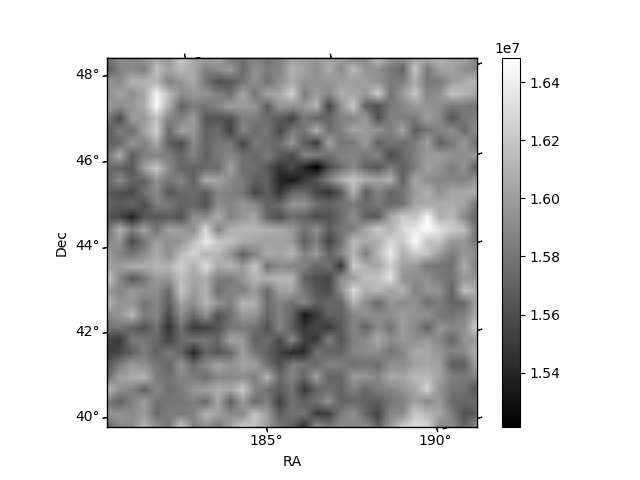
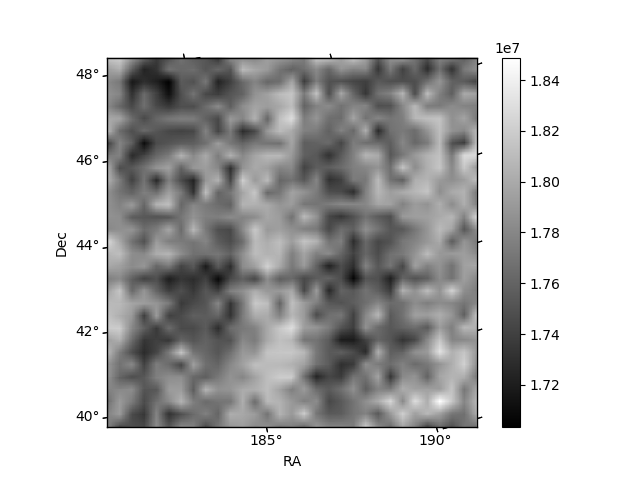
Histogram calculated using DETX and DETY for each event in the final _common_clean file
| Quadrant A | 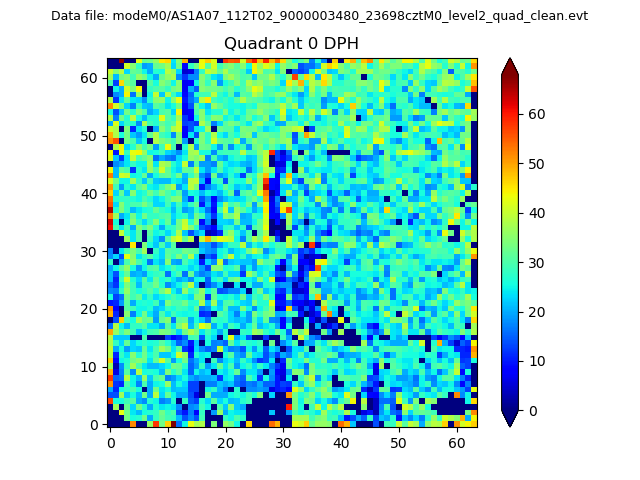 |
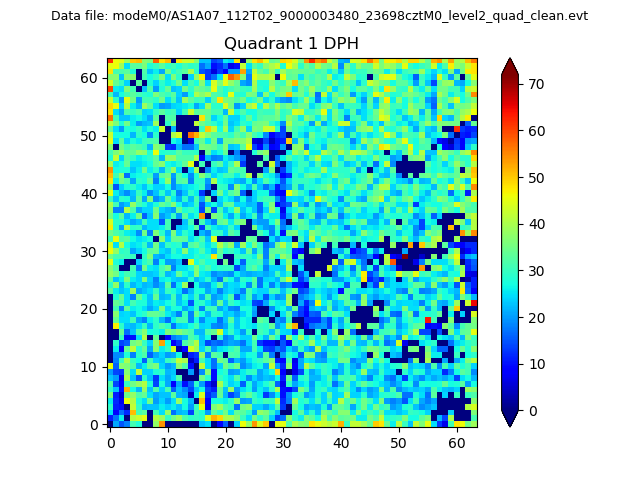 |
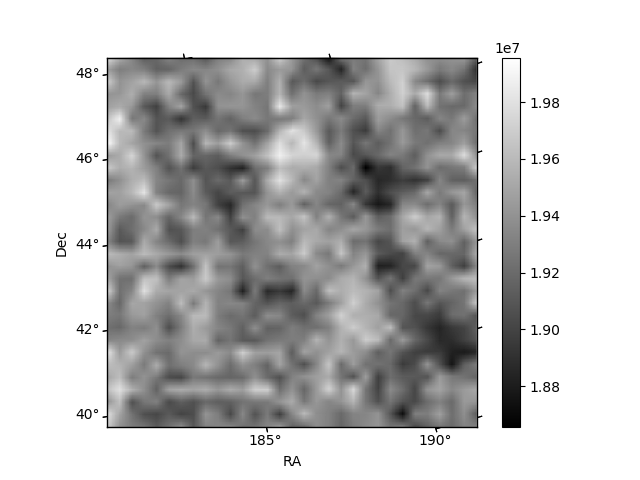
Quadrant B |
|---|---|---|---|
| Quadrant D | 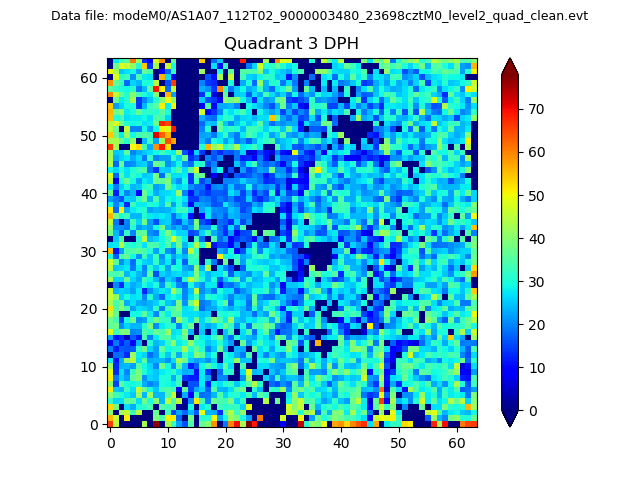 |
 |
Quadrant C |
| Plot type | Count rate plots | Images |
|---|---|---|
| Comparison with Poisson distribution Blue bars denote a histogram of data divided into 1 sec bins. Red curve is a Poisson curve with rate = median count rate of data. |
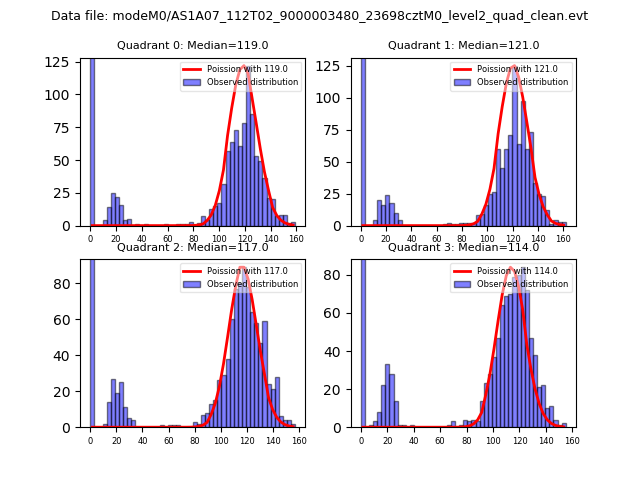 |
 |
| Quadrant-wise count rates Data is divided into 100 sec bins |
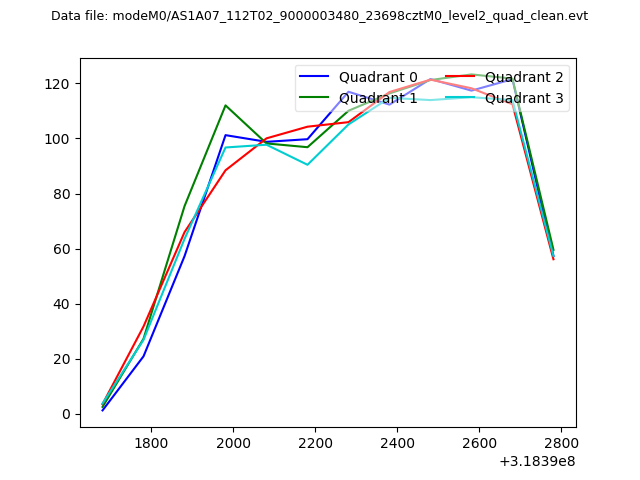 |
|
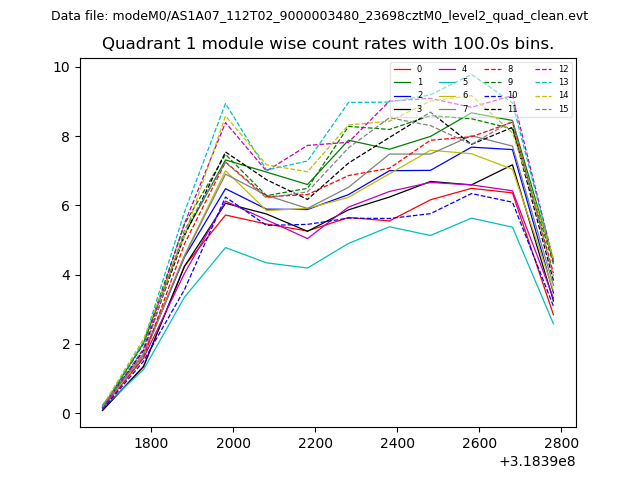
| Module-wise count rates for Quadrant A Data is divided into 100 sec bins |
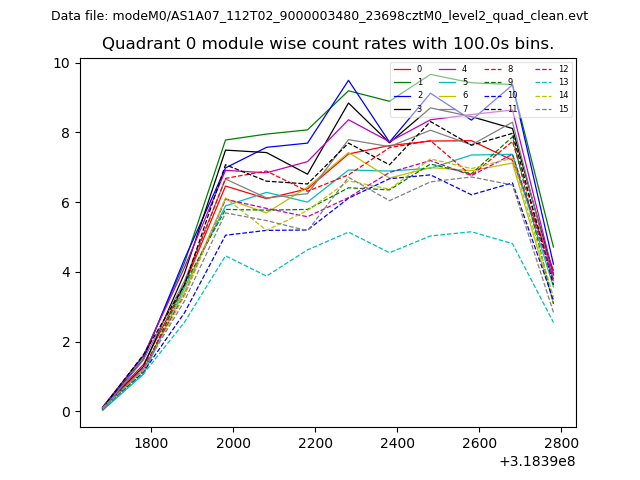 |
 |
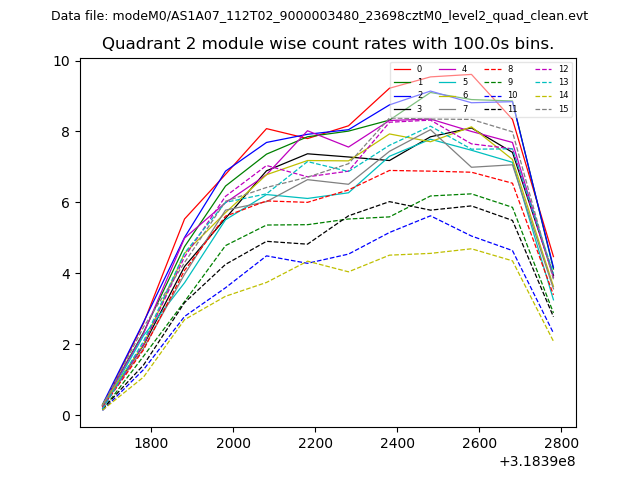
| Module-wise count rates for Quadrant B Data is divided into 100 sec bins |
 |
 |
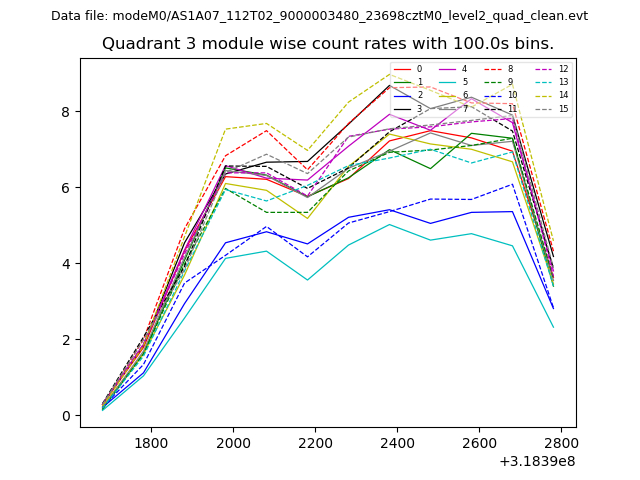
| Module-wise count rates for Quadrant C Data is divided into 100 sec bins |
 |
 |
| Module-wise count rates for Quadrant D Data is divided into 100 sec bins |
 |
 |
| Parameter | Plot |
|---|---|
| CZT HV Monitor | 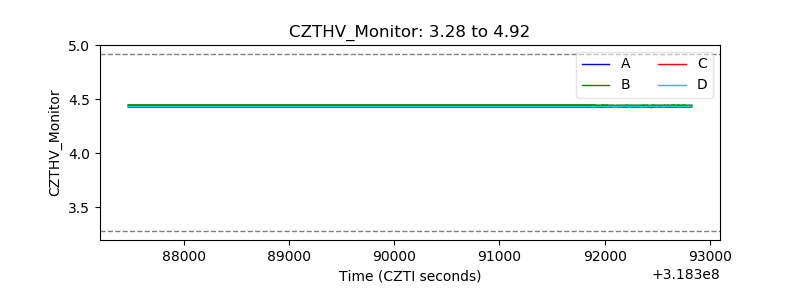 |
| D_VDD | 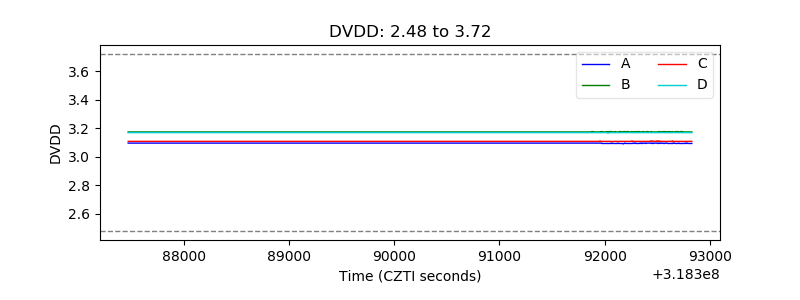 |
| Temperature 1 | 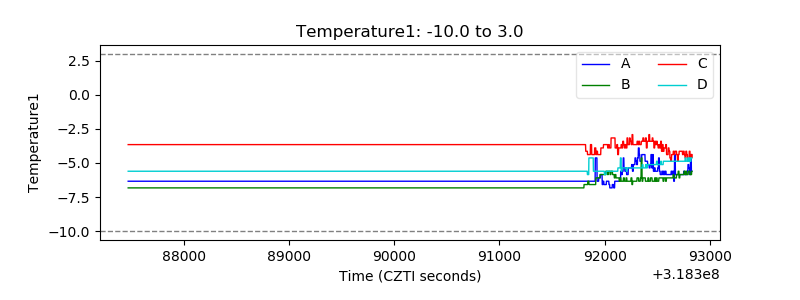 |
| Veto HV Monitor | 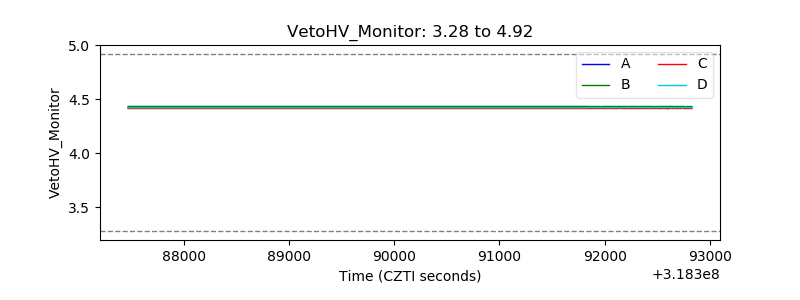 |
| Veto LLD | 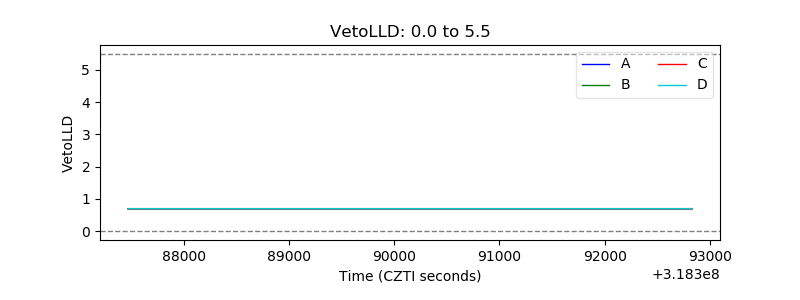 |
| Alpha Counter | 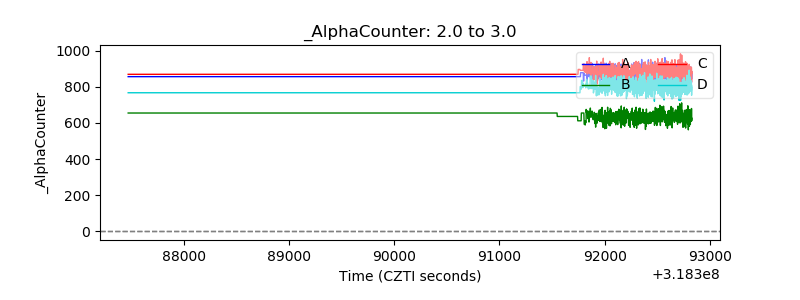 |
| _CPM_Rate | 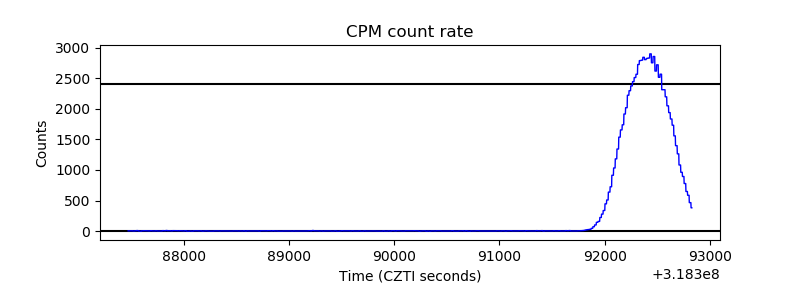 |
| CZT Counter | 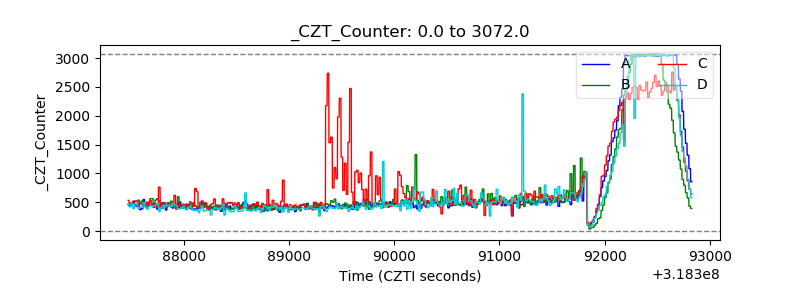 |
| +2.5 Volts monitor | 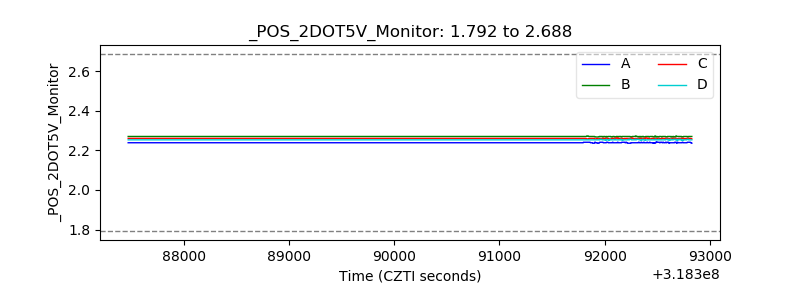 |
| +5 Volts monitor | 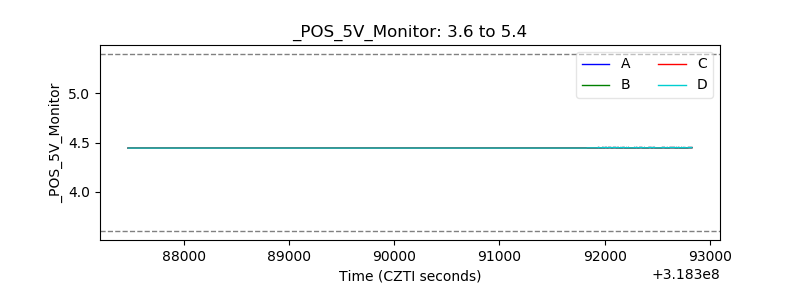 |
| _ROLL_ROT | 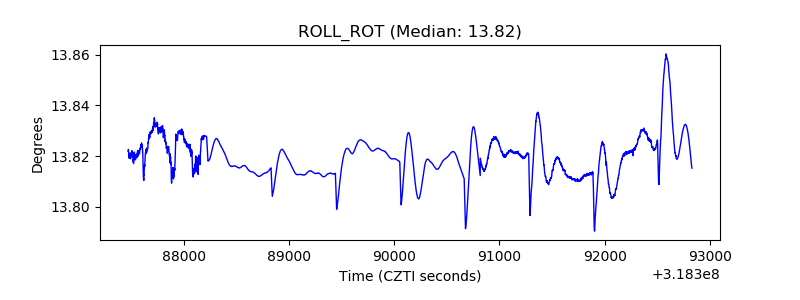 |
| _Roll_DEC | 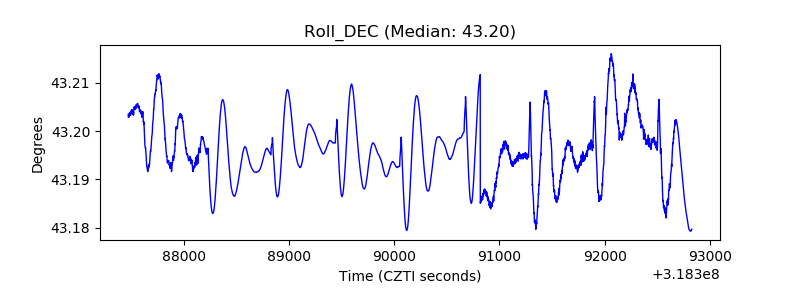 |
| _Roll_RA | 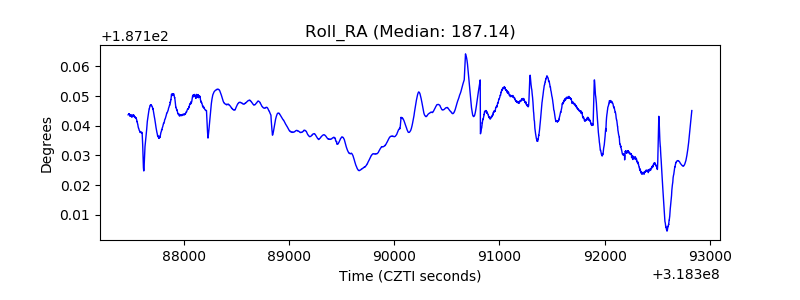 |
| Veto Counter | 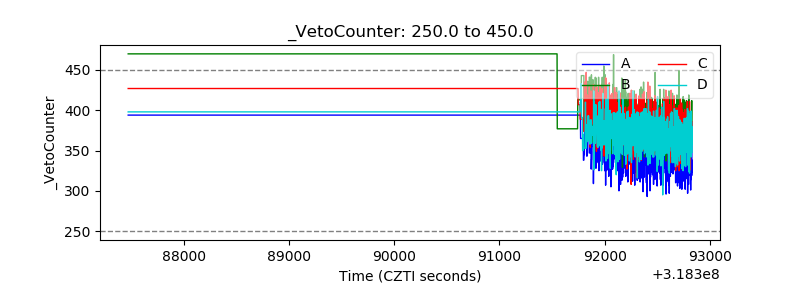 |