| Param | Original file | Final file |
|---|---|---|
| Filename | modeM0/AS1A07_011T01_9000003482cztM0_level2.fits | modeM0/AS1A07_011T01_9000003482cztM0_level2_quad_clean.evt |
| Size (bytes) | 2,704,008,960 | 2,474,046,720 |
| Size | 2.5 GB | 2.3 GB |
| Events in quadrant A | 16,748,712 | 14,564,532 |
| Events in quadrant B | 15,885,786 | 14,602,636 |
| Events in quadrant C | 16,081,740 | 13,895,454 |
| Events in quadrant D | 14,070,070 | 12,764,053 |
| Mode M9 | |||
|---|---|---|---|
| Quadrant | BADHDUFLAG | Total packets | Discarded packets |
| A | 0 | 443 | 0 |
| B | 0 | 444 | 0 |
| C | 0 | 445 | 0 |
| D | 0 | 445 | 0 |
| Mode SS | |||
|---|---|---|---|
| Quadrant | BADHDUFLAG | Total packets | Discarded packets |
| A | 0 | 5690 | 0 |
| B | 0 | 5690 | 0 |
| C | 0 | 5686 | 0 |
| D | 0 | 5694 | 0 |
| Mode M0 | |||
|---|---|---|---|
| Quadrant | BADHDUFLAG | Total packets | Discarded packets |
| A | 0 | 574176 | 0 |
| B | 0 | 612213 | 0 |
| C | 0 | 590786 | 0 |
| D | 0 | 705935 | 0 |
| Quadrant | Total seconds | Saturated seconds | Saturation percentage |
|---|---|---|---|
| A | 278879 | 3139 | 1.125578% |
| B | 278839 | 5069 | 1.817895% |
| C | 278895 | 5860 | 2.101149% |
| D | 278810 | 10540 | 3.780352% |
Noise dominated data is calculated using 1-second bins in cleaned event files. If a bin has >2000 counts, and if more than 50% of those come from <1% of pixels, then it is considered to be noise-dominated and hence unusable.
| Quadrant | # 1 sec bins | Bins with >0 counts | Bins with >2000 counts | High rate bins dominated by noise | Noise dominated (total time) | Noise dominated (detector-on time) | Marked lightcurve |
|---|---|---|---|---|---|---|---|
| A | 361998 | 279075 | 0 | 0 | 0.00% | 0.00% |  |
| B | 361998 | 279007 | 0 | 0 | 0.00% | 0.00% |  |
| C | 361998 | 279005 | 0 | 0 | 0.00% | 0.00% |  |
| D | 361998 | 278849 | 0 | 0 | 0.00% | 0.00% | 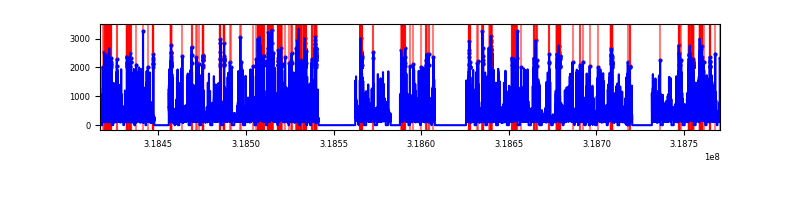 |
Top three noisy pixels from each quadrant. If the there are fewer than three noisy pixels in the level2.evt file, extra rows are filled as -1
| Pixel properties | Quadrant properties | ||||||
|---|---|---|---|---|---|---|---|
| Quadrant | DetID | PixID | Counts | Sigma | Mean | Median | Sigma |
| A | 0 | 29 | 16625 | 11.72 | 4361 | 4098 | 1068.6 |
| A | 7 | 110 | 13603 | 8.9 | 4361 | 4098 | 1068.6 |
| A | 0 | 30 | 12902 | 8.24 | 4361 | 4098 | 1068.6 |
| B | 2 | 9 | 12875 | 10.84 | 4212 | 4026 | 816.4 |
| B | 2 | 8 | 10875 | 8.39 | 4212 | 4026 | 816.4 |
| B | 14 | 254 | 10401 | 7.81 | 4212 | 4026 | 816.4 |
| C | 12 | 241 | 11135 | 6.7 | 4256 | 3985 | 1067.8 |
| C | 3 | 126 | 10822 | 6.4 | 4256 | 3985 | 1067.8 |
| C | 9 | 209 | 10805 | 6.39 | 4256 | 3985 | 1067.8 |
| D | 3 | 14 | 10338 | 6.28 | 4017 | 3662 | 1063.3 |
| D | 10 | 189 | 10155 | 6.11 | 4017 | 3662 | 1063.3 |
| D | 6 | 67 | 9840 | 5.81 | 4017 | 3662 | 1063.3 |
Histogram calculated using DETX and DETY for each event in the final _common_clean file
| Quadrant A |  |
 |
Quadrant B |
|---|---|---|---|
| Quadrant D | 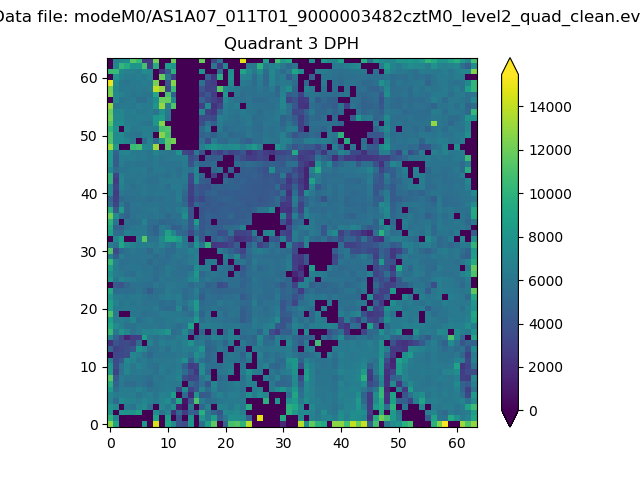 |
 |
Quadrant C |
| Plot type | Count rate plots | Images |
|---|---|---|
| Comparison with Poisson distribution Blue bars denote a histogram of data divided into 1 sec bins. Red curve is a Poisson curve with rate = median count rate of data. |
 |
 |
| Quadrant-wise count rates Data is divided into 100 sec bins |
 |
|
| Module-wise count rates for Quadrant A Data is divided into 100 sec bins |
 |
 |
| Module-wise count rates for Quadrant B Data is divided into 100 sec bins |
 |
 |
| Module-wise count rates for Quadrant C Data is divided into 100 sec bins |
 |
 |
| Module-wise count rates for Quadrant D Data is divided into 100 sec bins |
 |
 |
| Parameter | Plot |
|---|---|
| CZT HV Monitor |  |
| D_VDD |  |
| Temperature 1 |  |
| Veto HV Monitor |  |
| Veto LLD |  |
| Alpha Counter |  |
| _CPM_Rate |  |
| CZT Counter |  |
| +2.5 Volts monitor |  |
| +5 Volts monitor |  |
| _ROLL_ROT |  |
| _Roll_DEC |  |
| _Roll_RA |  |
| Veto Counter |  |